The Bond Market Is Sending a Message. Is the Stock Market Listening?

Key Takeaways
- Treasury yields remain in an uptrend as the September Fed meeting approaches.
- Volatility and momentum in Treasury yields are worth watching closely.
- Next week’s inflation data could provide clues to the stock market’s next possible catalyst.
The August jobs report came in well above expectations, but the stock market barely reacted. However, the odds of a rate hike at the September FOMC meeting increased. That was a reversal from Thursday, when Fed Governor Chris Waller said he was leaning towards keeping interest rates on hold.
Treasury yields were front and center this week. Long-term Treasury yields continue to push toward their highs, despite U.S. Treasury Secretary Scott Bessent increasing long-term Treasury buybacks. The 30-Year Treasury Yield Index ($TYX) is at 5.25%, and the 10-Year Treasury Yield ($TNX) is at 4.78%.
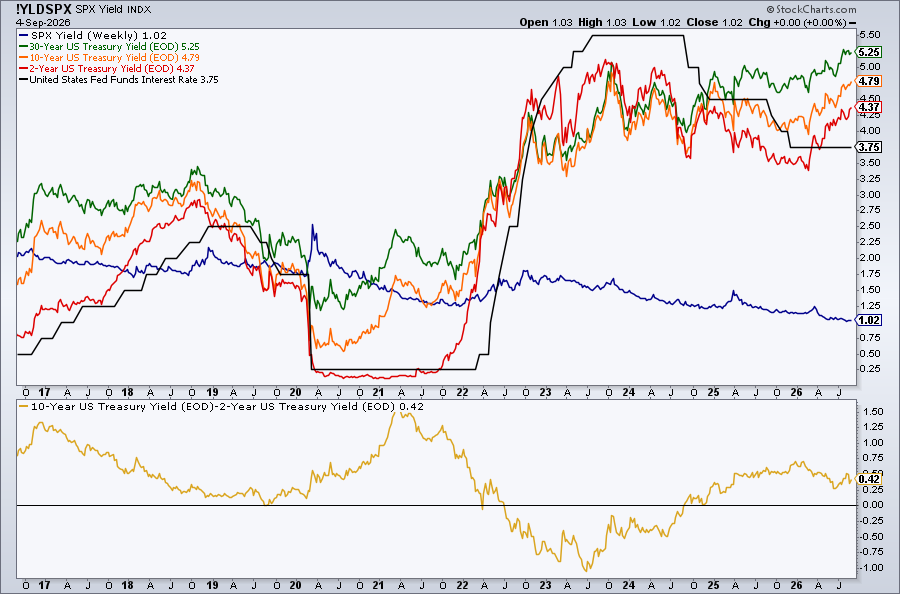
Let’s take a closer look at the 10-Year Treasury Yield.
On the daily chart below, $TNX is clearly in an uptrend. It’s trading above its 21-day exponential moving average (EMA), 50-day simple moving average (SMA), and 200-day SMA. More importantly, all three moving averages are sloping higher.
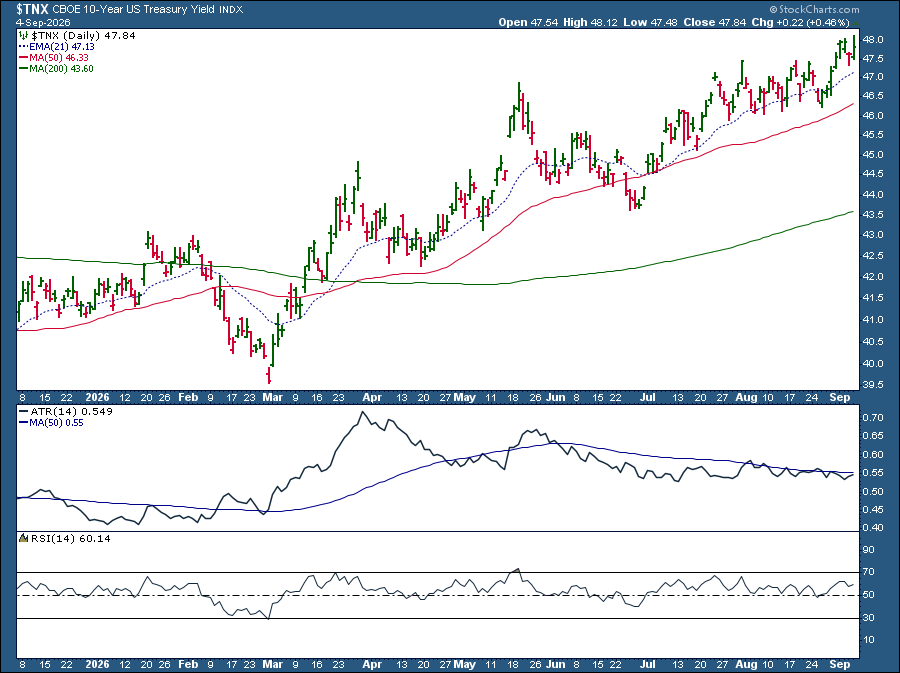
The Average True Range (ATR) indicator in the lower panel tells us something interesting. Even as yields have moved higher, volatility has been declining. The 50-day SMA of the 14-period ATR is trending lower, with the ATR below that moving average. Momentum has also remained relatively steady; the Relative Strength Index (RSI) has stayed between 50 and 70 since July, not especially overbought or oversold.
When you put those pieces together, you get an interesting picture. Since July, the 10-year yield has been moving steadily higher, forming a series of higher highs and higher lows. At the same time, volatility has declined, and momentum has remained relatively stable.
Zoom out to a longer-term chart, such as a five-year weekly, and you’ll see that the 10-year is trading within a range that is narrowing.
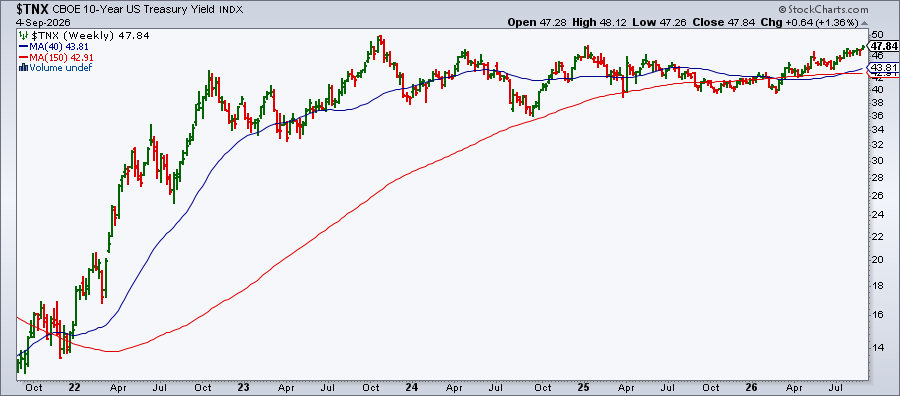
As we approach the September 16 FOMC meeting, I’ll be watching the direction of yields closely, along with any meaningful changes in the ATR and RSI. A shift in volatility or momentum could provide an early warning that rising yields are starting to create cracks in the equity market.
The Yen Intervention
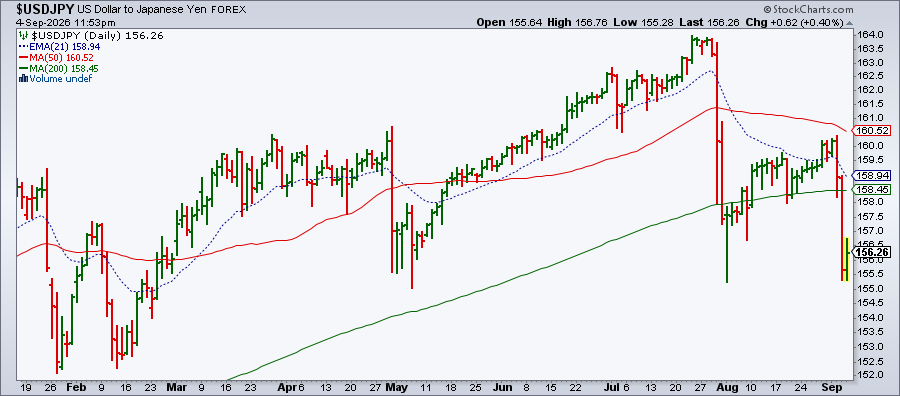
There’s another potential headwind for U.S. Treasuries coming from Japan. With Japanese yields around 3% after hovering close to zero for decades, Japanese investors have less incentive to park money in U.S. Treasuries. This would encourage Treasury selling and increase demand for the yen.
In the daily chart of the U.S. dollar to Japanese yen below, you can see the swift moves in the currency pair after the joint interventions in late July and again in late August. The latter was on the possibility of a currency intervention.
Looking Ahead
So far, rising Treasury yields, the continuing conflict between the U.S. and Iran, and the possibility of an interest rate hike this month haven’t had much impact on stocks. This raises an interesting question. “What is the market going to worry about next?”
Next week brings inflation data. A hotter-than-expected CPI and PPI should get the market’s attention. If it doesn’t, it may be telling us something.
Perhaps the market is looking past inflation and the Fed and towards its next major catalyst. The midterm elections, perhaps?
Don't just follow the market. Understand the forces driving it. Visit the Market Summary page and explore the Intermarket Analysis panel to see the cross-asset action shaping every trend.
Disclaimer: This blog is for educational purposes only and should not be construed as financial advice. The ideas and strategies should never be used without first assessing your own personal and financial situation, or without consulting a financial professional.