Using Breadth and Bollinger Bands to Find Oversold Conditions in the Semiconductor ETF (SMH)
Key Takeaways
- The %B in SMH dips below zero for a short-term price stretch.
- The percentage of SMH stocks trading above the 50-day EMA dips below 20% for a breadth stretch.
The VanEck Semiconductor ETF (SMH) fell pretty hard in July, but the decline was always viewed as a correction because it met the retracement requirements and formed a typical corrective pattern. Chartists looking for signals that a correction is ending can turn to %B and SMH %Above 50-day SMA. Both became oversold in July and one became oversold in early September. This means SMH is again setting up bullish as it corrects within a bigger uptrend.
One of our trading strategies at TrendInvestorPro is to identify tradable pullbacks and oversold conditions within long-term uptrends. This discretionary strategy is based on chart analysis. To complement this strategy, we also have systematic momentum strategies focused on Nasdaq 100 stocks, S&P 500 stocks and ETFs. These strategies capture momentum by owning the strongest names and exiting when they drop below a certain rank. Click here to take a trial and gain full access.
While our systematic strategies have clearly defined rules, the discretionary strategies are more, well, discretionary. Nevertheless, there are clear guidelines and a repeatable process. We must be in a bull market and the stock/ETF must be in a long-term uptrend. Once these conditions are met, I then look for tradable pullbacks using chart patterns and oversold conditions using indicators. Oversold conditions occur when there is a correction, and corrections within uptrends are opportunities.
Bollinger Bands and %B for Oversold Conditions
The first indicator is %B, which is based on Bollinger Bands. Again, I'm only interested in oversold conditions within an uptrend, and SMH is above its rising 200-day SMA. %B is below zero when the close is below the lower Bollinger Band. This means the close is two standard deviations below the 20-day SMA, which is a short-term oversold condition.
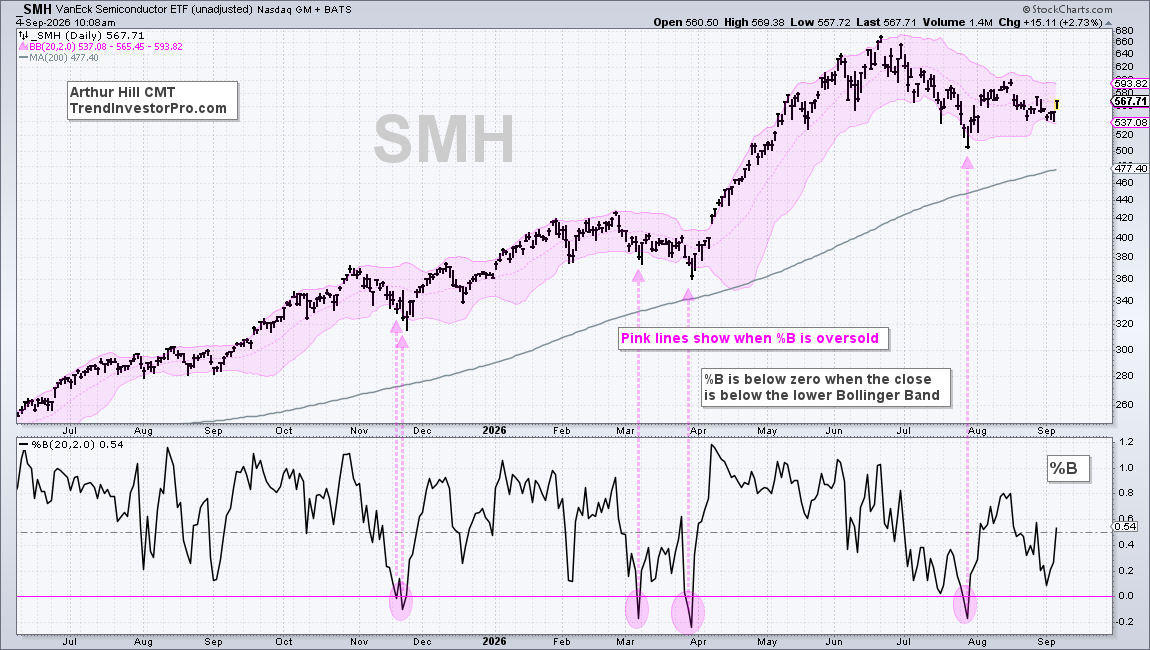
The chart below shows the Semiconductor ETF (SMH) with Bollinger Bands (20,2) and %B (20,2). The pink lines show when the close is below the lower Bollinger Band and %B is below zero. These are oversold conditions. Also notice that the long-term trend is up because SMH is above the rising 200-day SMA.
%Above 50-Day EMA Dips below 20% For a Breadth Stretch
The next chart shows SMH with the percentage of SMH stocks above their 50-day EMAs (!GT50SMH). This is a short-term breadth indicator that is best used for mean-reversion setups (oversold conditions within long-term uptrends). The indicator becomes stretched with a move below 20% and this increases the chances for a bounce.
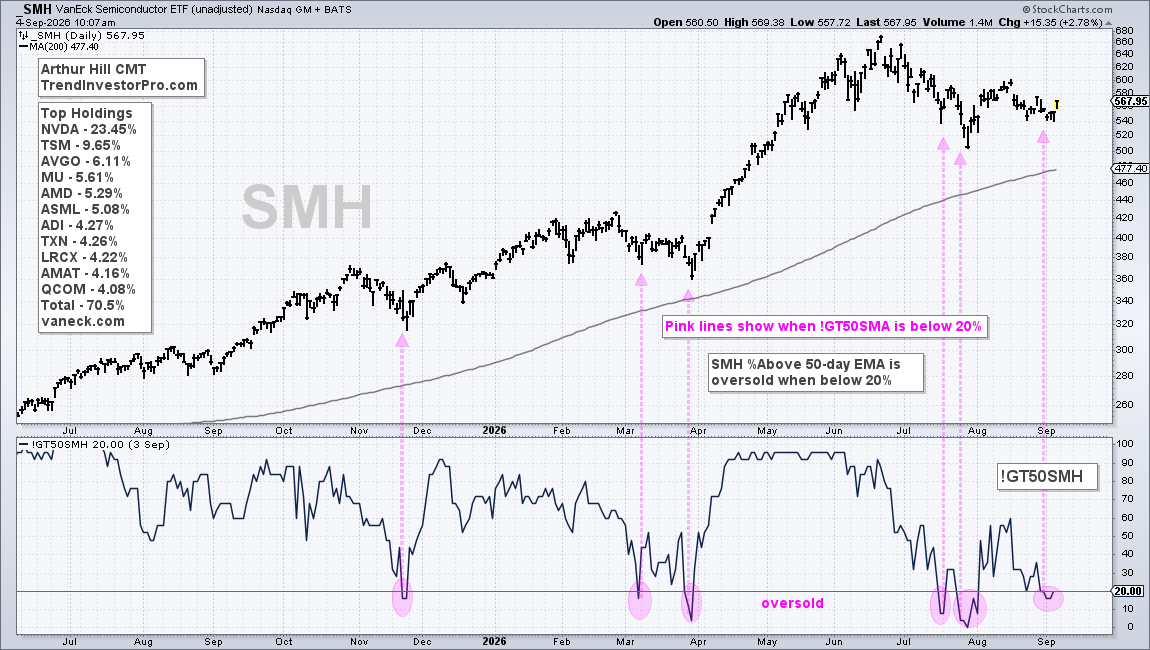
The pink dashed lines show !GT20SMH dipping below 20% in November 2025, March–April, July and early September. The current oversold condition alerts chartists to monitor price action closely. Look for tradable patterns, and watch for breakouts or short-term reversals.
The Semiconductor ETFs (SMH & SOXX), the Memory ETF (DRAM) and some of the top stocks are setting up, including Nvidia (NVDA). This analysis continues for TrendInvestorPro subscribers. We identify the patterns at work, the key levels and the leader. Click here to take a trial and gain immediate access.