The Dow 30 Ranked: The 2026 Leaders, Losers and Surprise Movers
Key Takeaways
- Merck has surged to the top of the Dow’s 2026 leaderboard, while Cisco, Amgen and Coca-Cola remain close behind.
- NVIDIA has fallen back after a summer slump, while Nike is sitting at the bottom and could eventually face removal from the Index.
- The DJIA remains near record highs, but weak September seasonality could test the blue-chip rally as summer’s end approaches.
We're not quite coming down backstretch, but there's a hot race on Wall Street. Thirty blue chips are vying for the crown of leading Dow Jones Industrial Average ($INDU) stock in 2026. For a while, it was a two-horse sprint between Caterpillar (CAT) and Cisco (CSCO); different sectors, but the same AI theme.
Major pharma/biotech news then hit last week, upending the competition. Merck (MRK) and Moderna (MRNA) announced a successful skin cancer vaccine trial, sending the latter's shares soaring 12% (the most since 2009 and MRK's best day relative to the S&P 500 going back to 2005).
Merck Leads, GS & CAT are Outperforming & Most Important to the Dow
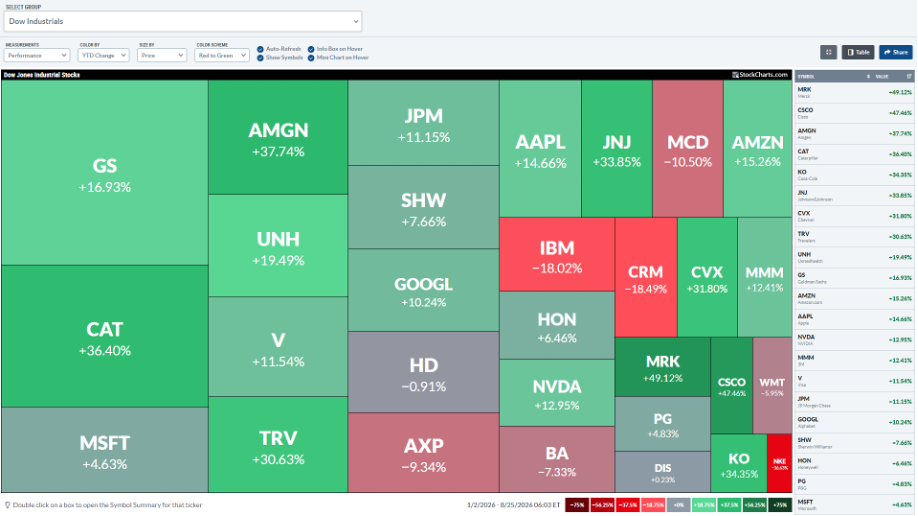
You can check where all of the Dow 30 stand on StockCharts' DJIA MarketCarpet. It's unique in that the performance heat map is sortable by share price, which matches the Dow's price-weighted scheme. MRK holds a narrow lead over CSCO, while fellow Health Care sector stalwart Amgen (AMGN) has recently leapfrogged the suddenly struggling CAT. Coca-Cola (KO) continues to tag record highs, claiming the No. 5 slot.
NVIDIA Has Work to Do
NVIDIA (NVDA), which reports Q2 results Wednesday night, briefly led YTD a few months ago. Recall that the world's largest company's stock price reached $236, a nearly $6 trillion market cap, two weeks before its Q1 report hit the tape. Alas, it has been a summer struggle for Jensen Huang and company, and the stock limps into earnings after a seven-session losing streak that was snapped on Tuesday.
The options market prices in a 5.2% move after the numbers drop, but, even if that's to the good side, it would still leave NVDA just middle of the pack among the 30 YTD.
Nike's Fall From Grace
Bringing up the rear are some long-time laggards and a recent blow-up. Nike (NKE) was kicked to the ground again on Tuesday following an earnings miss out of DICK'S Sporting Goods (DKS), which suffered its worst one-day plunge on record. DKS had been on a multi-year heater, rallying from a pandemic low of $13 to its January 2025 all-time high of $255. Shares traded as high as $244 this past June before the bearish reversal. With Tuesday's turbulence, DKS has retraced more than half of the 2020-2025 climb.
NKE, meanwhile, is among the most fantastically bearish long-term charts. The stock has stair-stepped lower from $179 in late 2021 to below $40 today. Down 37% on the year, it appears poised to lock in a fresh weekly closing low. Remember that weekly prints are more important than daily or even monthly prices, as they filter out mid-week noise and represent the final collective consensus that investors are willing to hold going into the weekend.
If Nike's Out, Who's In?
Could NKE get booted from the DJIA? Now with just a $60 billion market cap, it's possible. The selection committee, made up of five individuals from S&P Global and The Wall Street Journal, could swap it for a recent consumer winner like Starbucks (SBUX), an off-price retailer like TJX Cos. (TJX), or a modern travel company like Airbnb (ABNB).
The consumer, while resilient, is choiceful and fickle, and Nike clearly has some soul-searching to do.
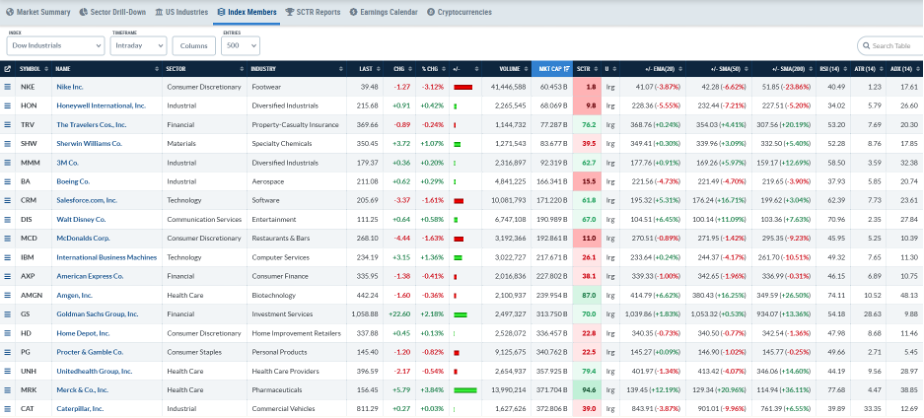
Salesforce (CRM) and IBM (IBM) are distant second and third to Nike's YTD loss. Both are off by 18%. Counter to NVDA, CRM has enjoyed a summer comeback. Up 40% from the June 22 low, the wheat is being pulled from the chaff in software. CEO Marc Benioff and team report quarterly results concurrent with Jensen Huang and NVIDIA on Wednesday afternoon. IBM, however, is still reeling from its historic July 14 plummet. Big Blue is a small Dow weight at 3% after a long run as the index's highest-priced name.
Onward & Upward from Dow 50K
Big picture, some investors may scoff at the notion of applying technical analysis to the Dow Jones Industrial Average, then taking signal from the findings. But here's the thing: The DJIA is the oldest, most well-known grouping of stocks in the world. Everyone knows (at a high level) what the Dow is. When it notches new highs, folks pay attention.
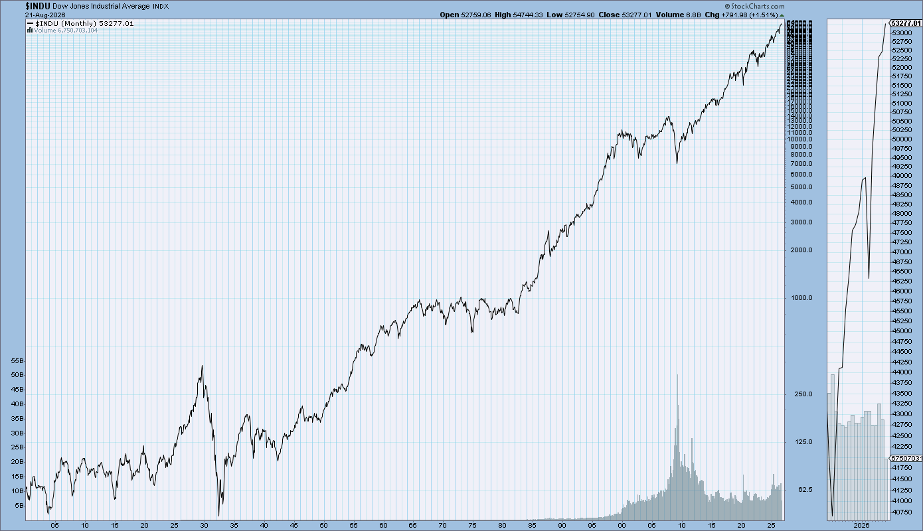
Recall it was almost a year ago when pundits (including myself) laid out the path for Dow 50k. It finally happened with an exclamation mark on Friday, February 6. The handle didn't last for long, as the DJIA corrected to a March 30 low of 45,057.28. A 21.5% mid-year rally to new highs paused three weeks ago, and we now head into a precarious calendar stretch.
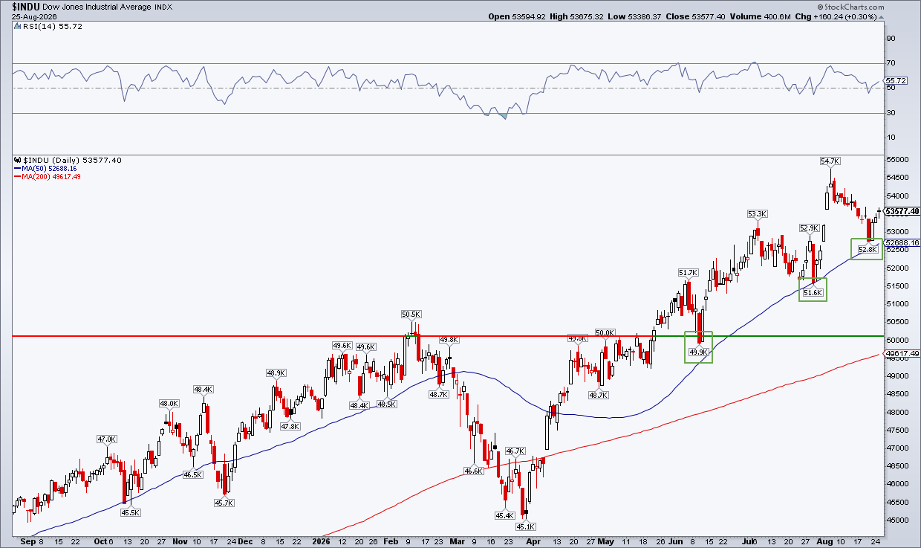
Wake Me Up When September Ends...
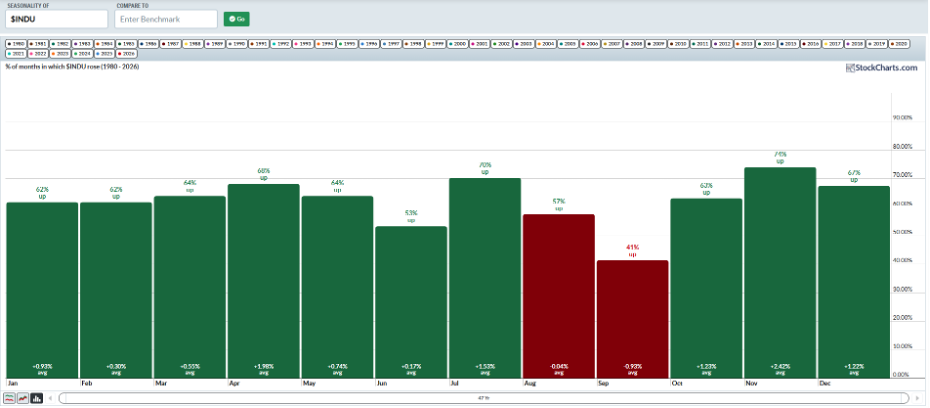
Since 1980, the DJIA has averaged a 0.93% September decline, up just 41% of the time. It's far and away the worst of the 12 months. (StockCharts' revamped Seasonality tool allows users to scan performance over the past 47 years.)
Even the current secular bull market's September swoon is apparent, with a mean return of –0.16% and a mere 53% positivity rate.
The Bottom Line
The Dow Jones Industrial Average has impressively just about matched the S&P 500's 13% YTD total return. It has been a broad advance, with several blue chips taking turns leading the pack. There are some major losers, of course, and we could see more index rejiggering before long. Through it all, the Dow is close to record highs after a February-March correction, though sketchy seasonality is now at hand.
Disclaimer: This blog is for educational purposes only and should not be construed as financial advice. The ideas and strategies should never be used without first assessing your own personal and financial situation, or without consulting a financial professional.