The Best Five Sectors This Week #82
Key Takeaways
- S&P 500 gained 0.23%, led by Energy, Technology (+1.5%), and Utilities, while other sectors averaged a 1% decline.
- The top five portfolio outperformed the S&P 500 with a 0.71% weekly gain, narrowing its lag to just over 7%.
- Technology remains in the driver's seat with increased weight to 60%, while Materials are replacing Industrials in the top five.
At the end of last week, the S&P 500 ($SPX) posted a modest gain of 0.23%, driven primarily by strong performances in the Energy, Technology, and Utilities sectors. While these sectors gained, the remaining sectors averaged about a 1% decline each. Notably, the Technology sector stood out with a 1.5% increase, playing a significant role in supporting the index.
There have been some changes in the ranking of the sectors, including a change in the composition of the top five sectors within the portfolio: Technology, Health Care, Financials, and Energy remain static at positions 1-4. Materials entered the top five, pushing Industrials out.
- (1) Technology - XLK [60%]
- (2) Health Care - XLV [14%]
- (3) Financials - XLF [19%]
- (4) Energy - XLE [5%]
- (6) Materials - XLB [3%]*
- (7) Real Estate - XLRE*
- (5) Industrials - XLI*
- (9) Consumer Staples - XLP*
- (8) Consumer Discretionary - XLY*
- (10) Communication Services - XLC
- (11) Utilities - XLU
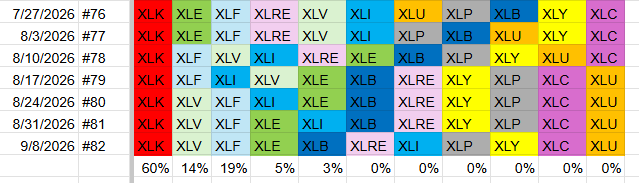
With Materials entering the top five and Industrials dropping out, we also see a shift in portfolio weights. Materials have a lower market cap, which increases the Technology sector’s weight in the portfolio to 60%. This increased weight means Technology's performance will have an even greater impact on the portfolio moving forward.
Weekly RRG
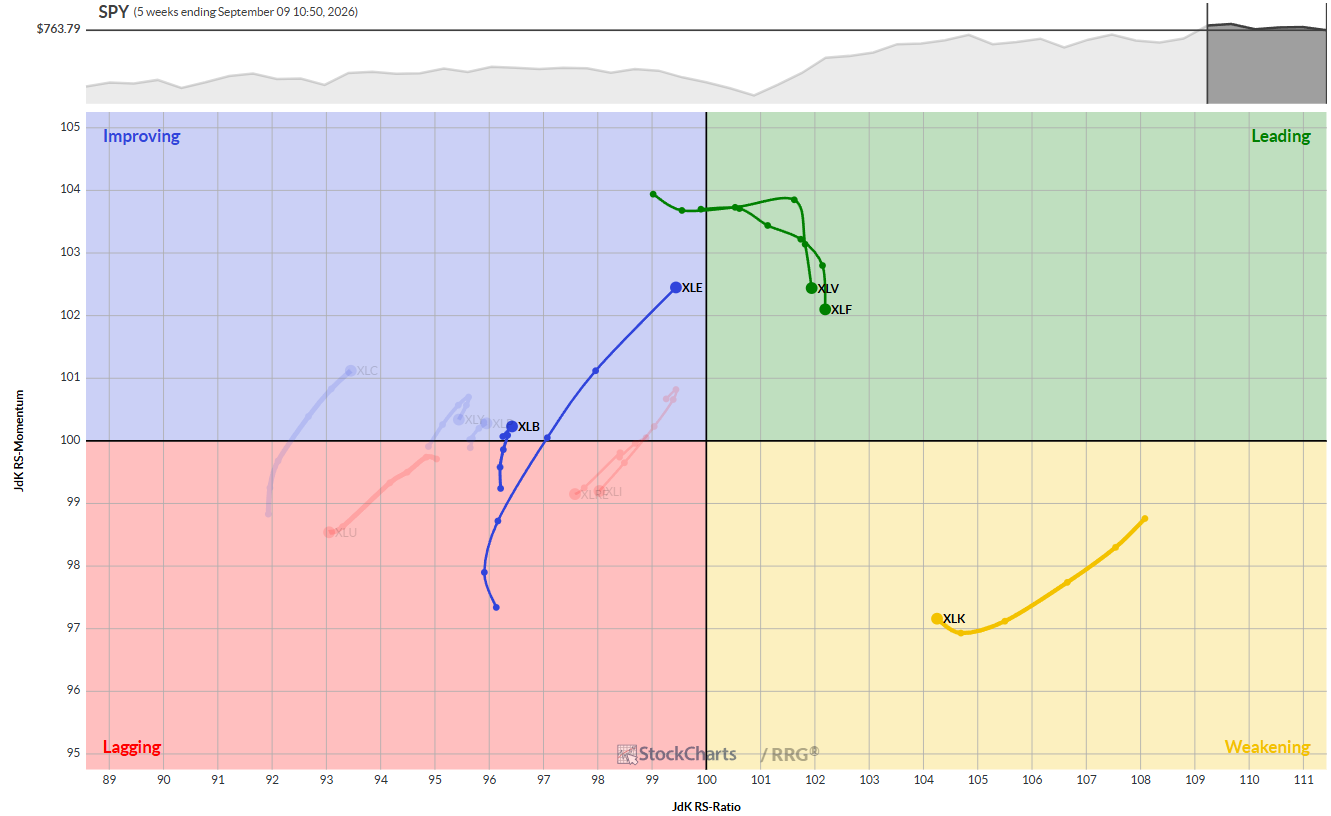
Health Care and Financials remain the leading quadrant but are losing relative momentum, though not yet relative strength. Technology continues its rotation through the weakening quadrant, but is beginning to pick up relative momentum. If this rotation continues, Technology could soon return to the leading quadrant, which would be a positive signal for the broader S&P 500. Energy is showing the longest tail in the improving quadrant and moving rapidly toward leading. Materials is just crossing into the improving quadrant on a positive trajectory.
Daily RRG
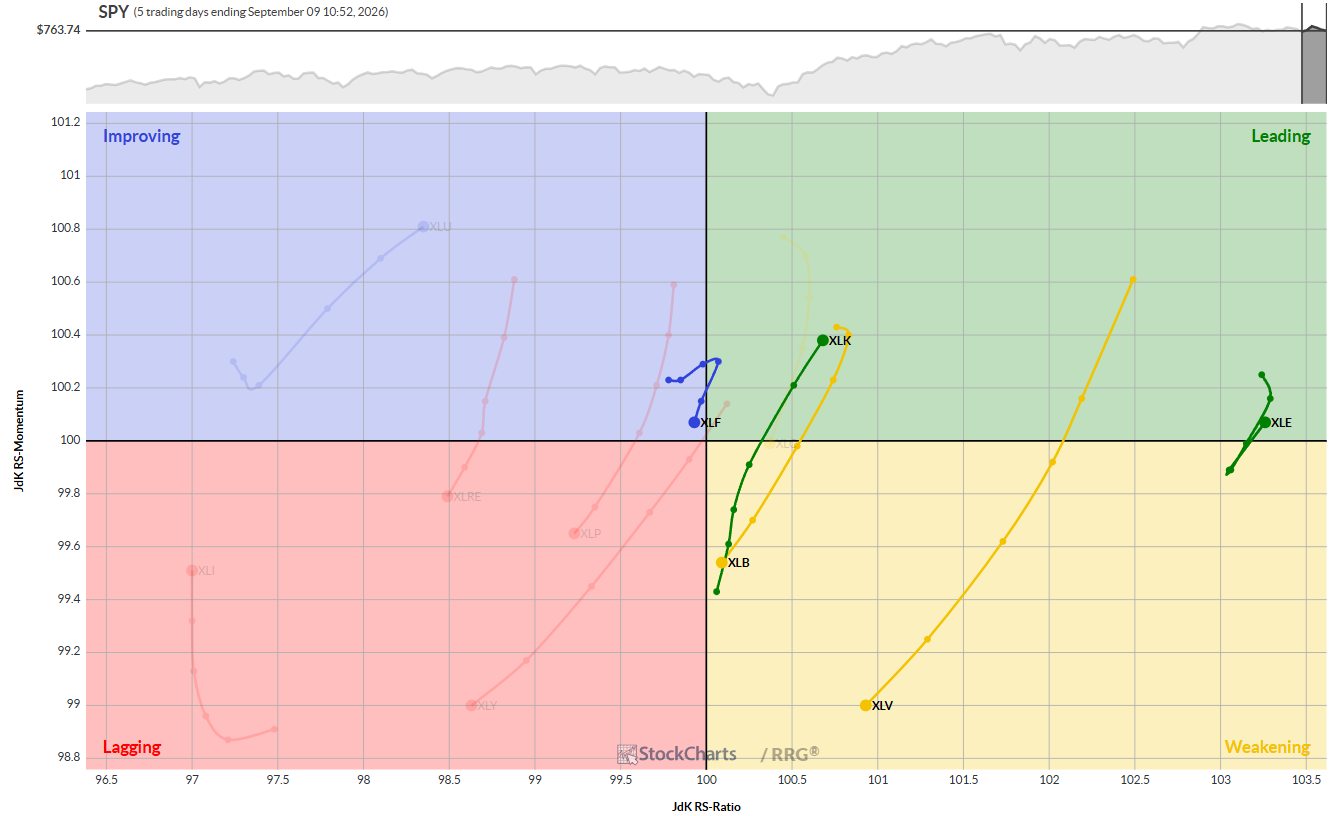
Four of the top five sectors are positioned on the right-hand side of the RRG graph, which is a positive sign. Energy is rebounding back into the leading quadrant after a brief period of lost momentum. Health Care shows a long tail, rotating from leading through weakening. Once this rotation slows and turns, it can provide relative support to the XLV tail in the weekly RRG.
Materials are nearing the lagging quadrant, which contrasts with its weekly movement. The sector's near-term relative trend remains uncertain. Technology is confirming early signs of strength, with its RRG tail pushing into the leading quadrant.
Financials are hovering near the benchmark, rolling over into the improving quadrant with a negative heading. A continued upward rotation is needed to confirm the weekly trend.
Sector Highlights
Technology
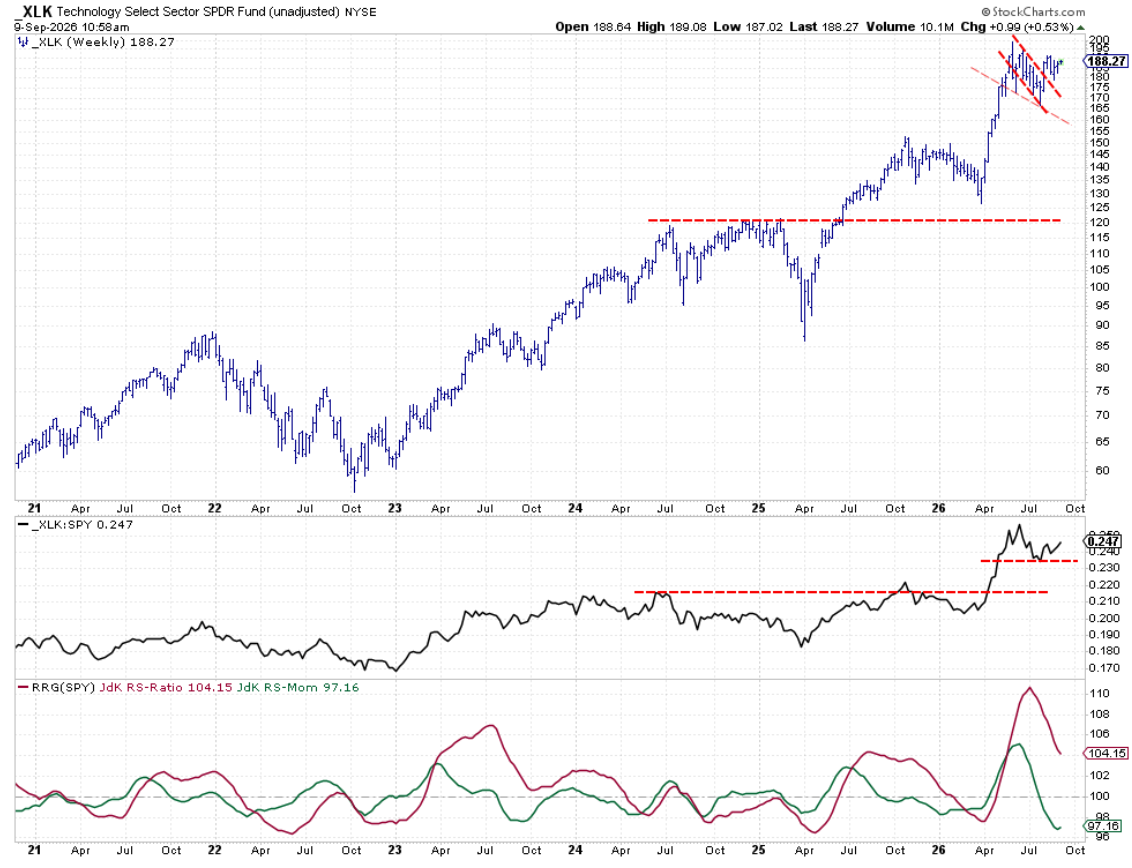
Technology is showing resilience, with a new higher low forming on the weekly bar chart—a positive development. This low should now act as support, and a similar pattern is emerging in the raw relative strength (RS) line. The RRG lines are stabilizing, and the RS momentum line is showing early signs of an uptick. If this continues, the sector could rotate from leading to weakening and back to leading, providing a strong boost to the overall market.
Health Care
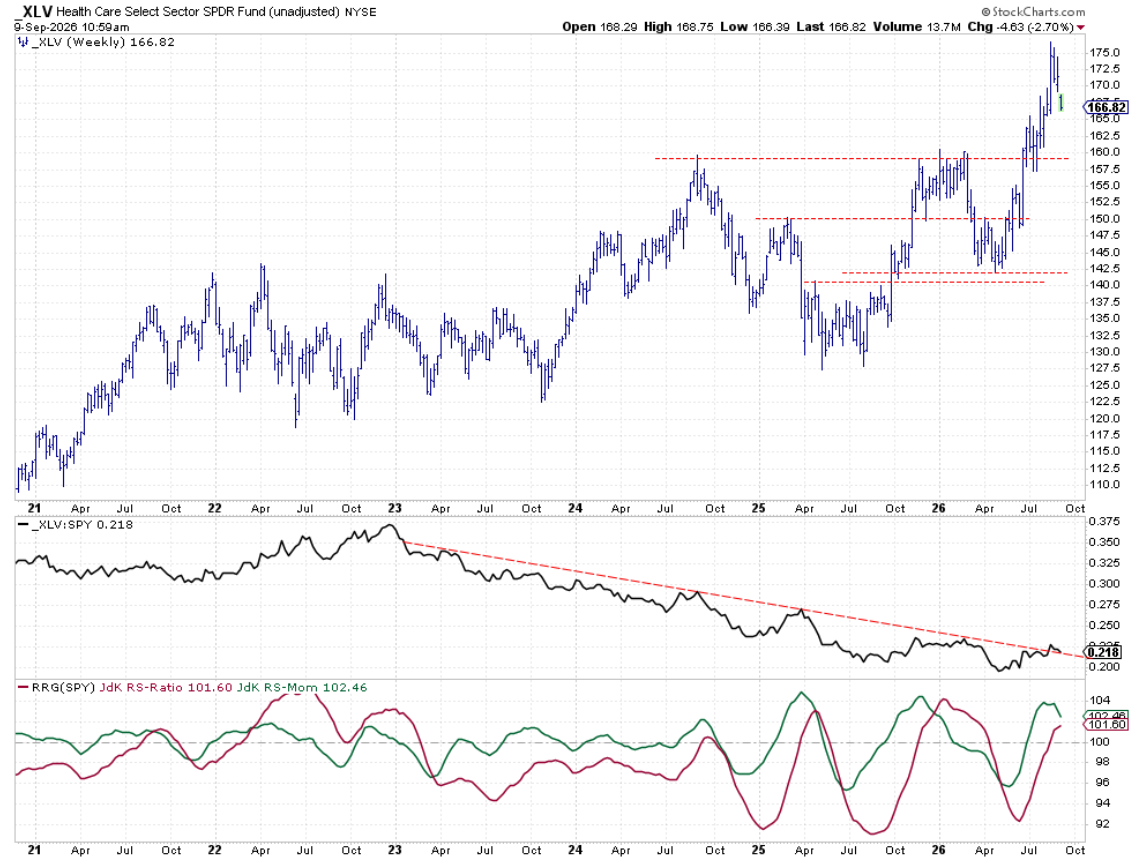
After a strong breakout, healthcare is pulling back but still has significant support at 165 and around 160. The movement of the raw RS line is crucial here. As long as the sector remains above the breakout level and the RRG lines stay above 100, healthcare should maintain its position in the leading quadrant.
Financials
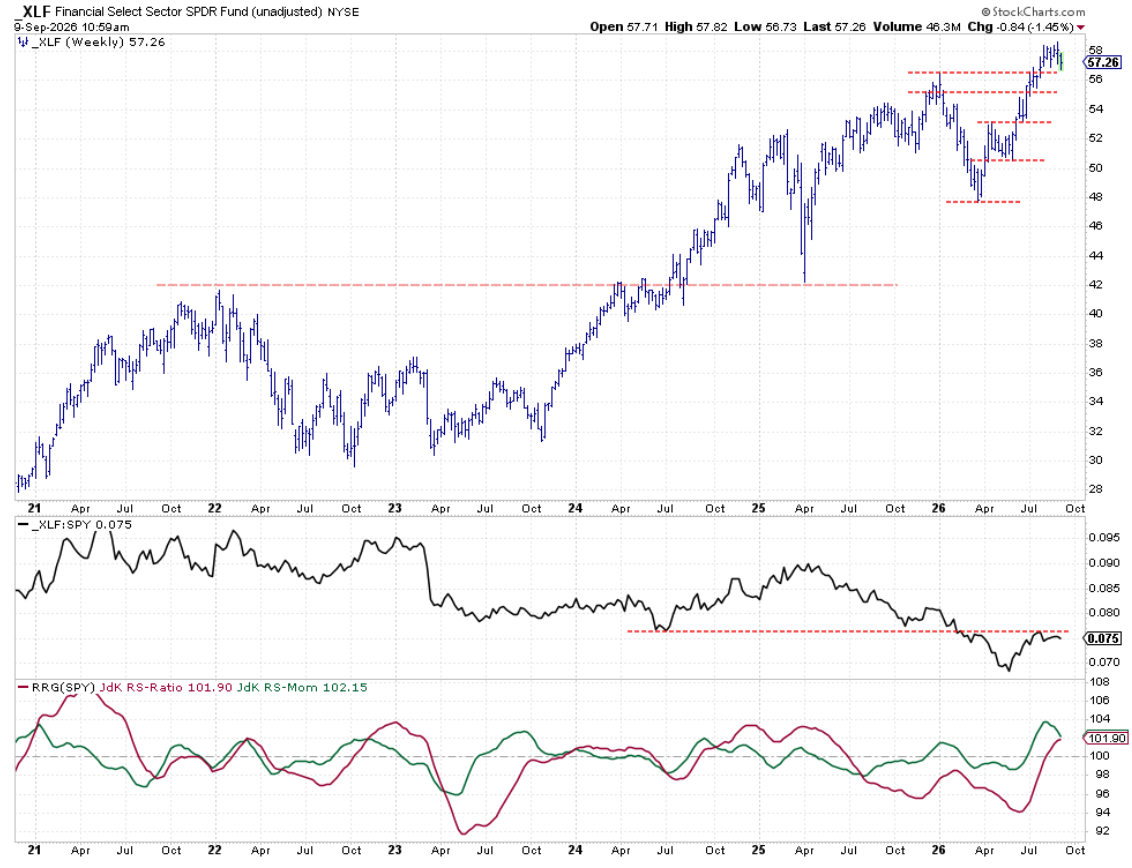
Financials have peaked over the past five weeks, hovering around the 58 level without a decisive breakthrough. The sector is now testing previous highs just above 56.50. Holding this level and establishing a new higher low would be a positive sign. On the relative strength chart, a push above resistance in the raw RS is still needed.
Energy
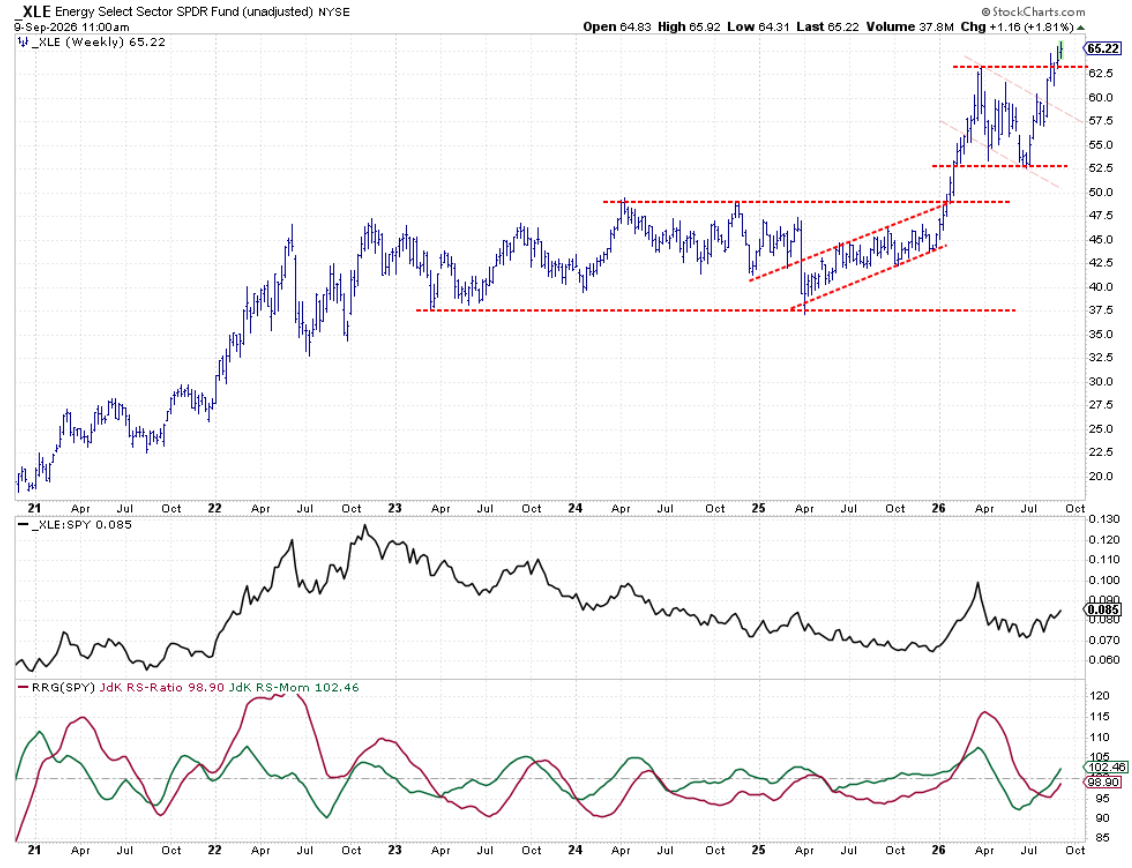
Energy is breaking above its previous high, confirming underlying market strength. The raw RS line is forming higher highs and higher lows, which is lifting the RRG lines and signaling continued sector momentum.
Materials
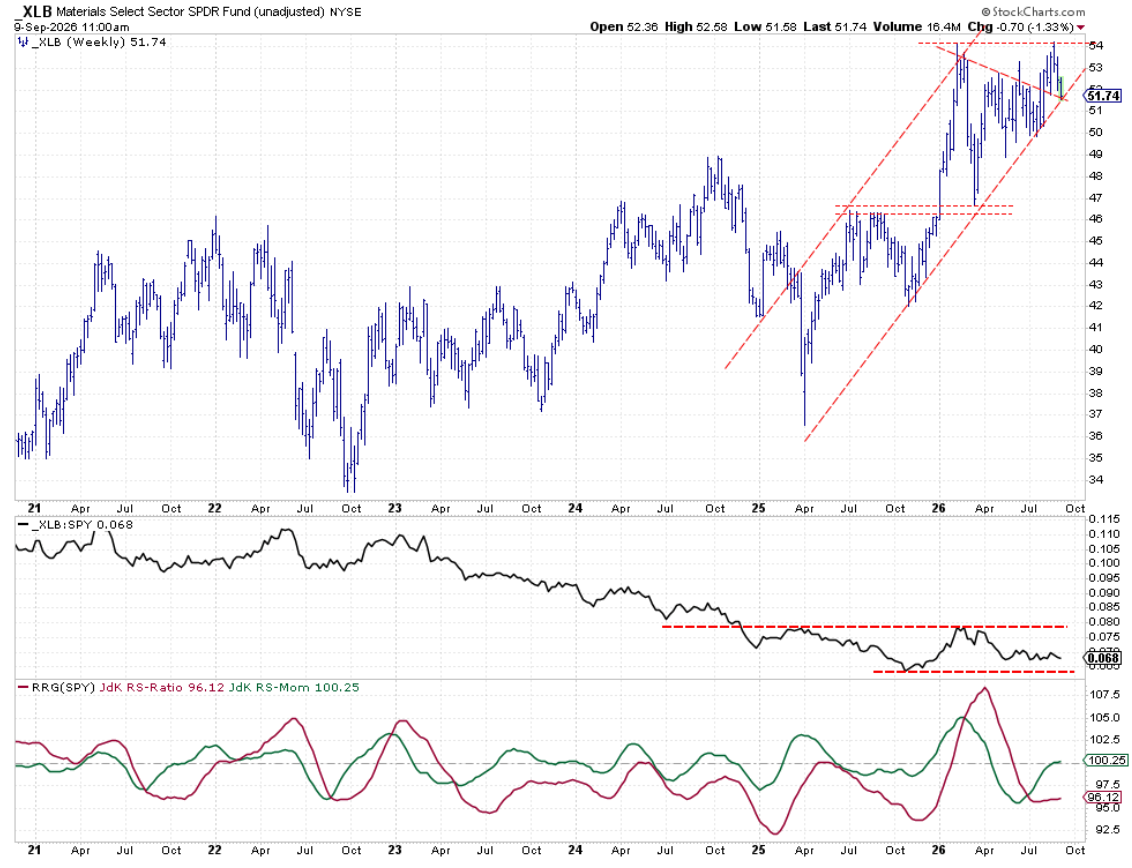
Materials pulled back last week but remain within a rising channel, testing a double support level. The raw RS is moving sideways, causing the RRG lines to level off. The RS-ratio is below 100 and RS-momentum is around 100, placing materials just inside the improving quadrant.
Portfolio Performance
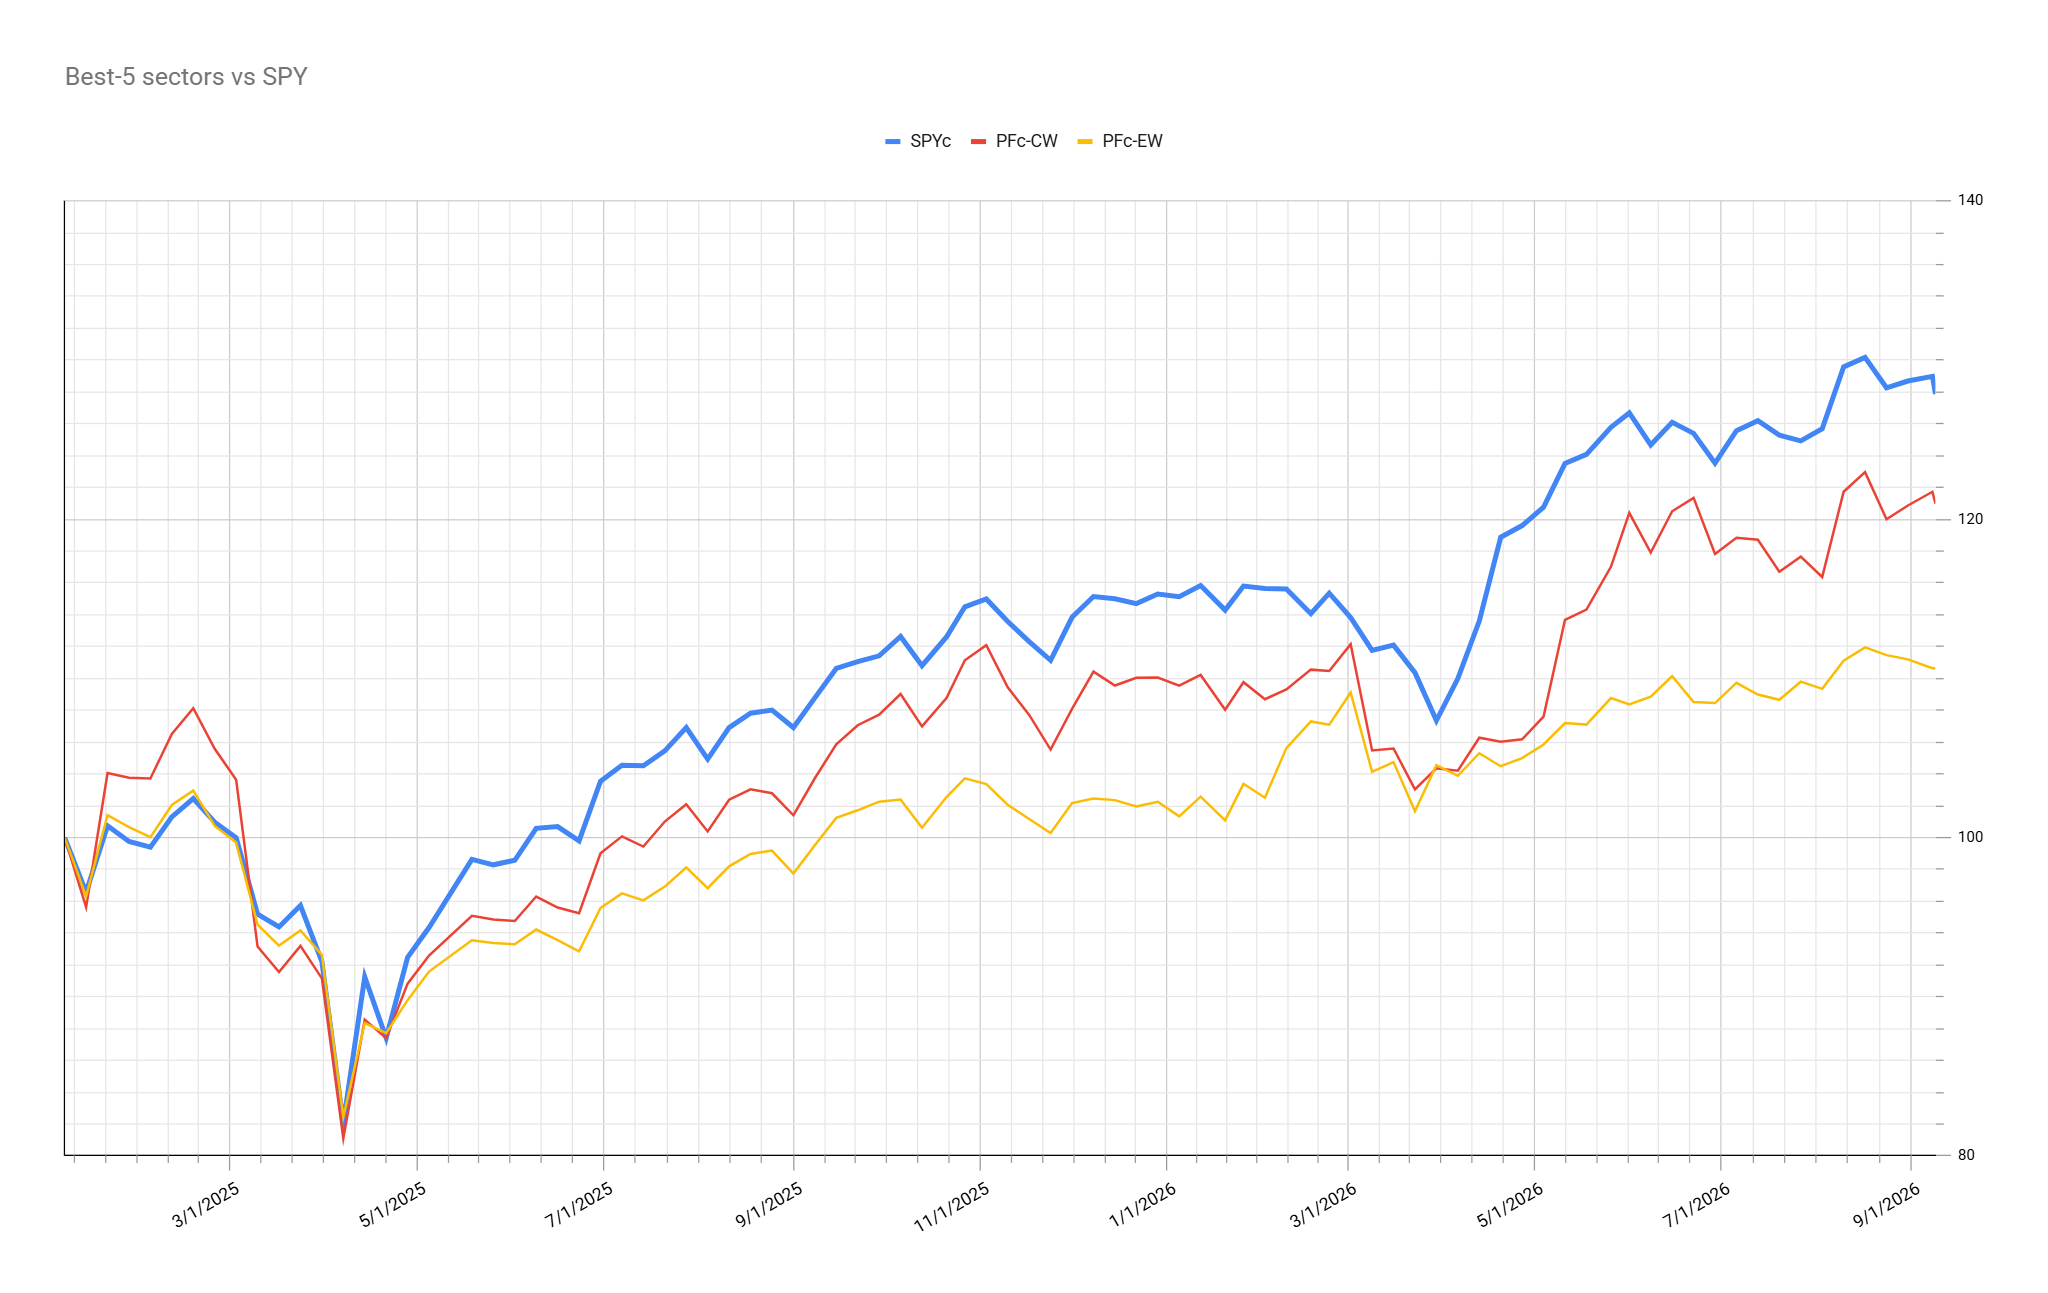
This week, the portfolio outperformed the S&P 500, gaining approximately 0.71%. This outperformance helped narrow our lag versus the S&P 500 since inception to just over 7%. With continued sector rotation and strong signals from technology and energy, the portfolio is gradually crawling back to the S&P 500 benchmark.
#StayAlert, --Julius