$4 Gasoline Ahead? What RBOB Futures and Oil Charts Signal About Pain at the Pump

Key Takeaways
- Oil’s surge toward $120 per barrel is quickly filtering down to retail pump prices.
- RBOB gasoline futures point to a $4 national retail average as energy futures markets enter extreme backwardation amid the ongoing war in Iran.
- Technical signals in the UGA ETF suggest gasoline may be nearing a short-term peak.
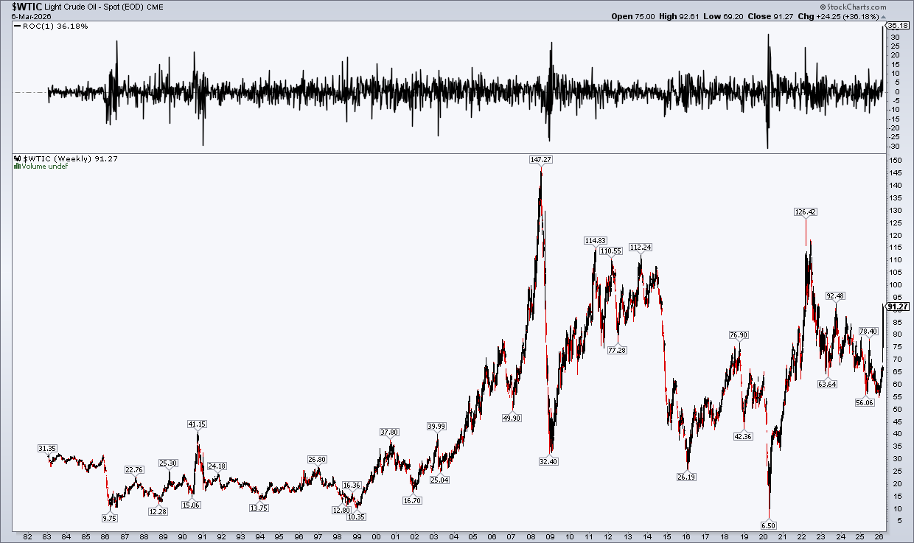
Investors have been rocked by oil’s historic rally from below $70 per barrel on WTI to nearly $120 in the overnight session to begin this week. The S&P 500’s decline reached about 5%, the Russell 2000 Index of small caps entered correction territory (based on futures pricing), and international stocks have been smoked after a torrid rally. The upper dash of the K-shaped economy is no doubt stunned by wild intermarket action.
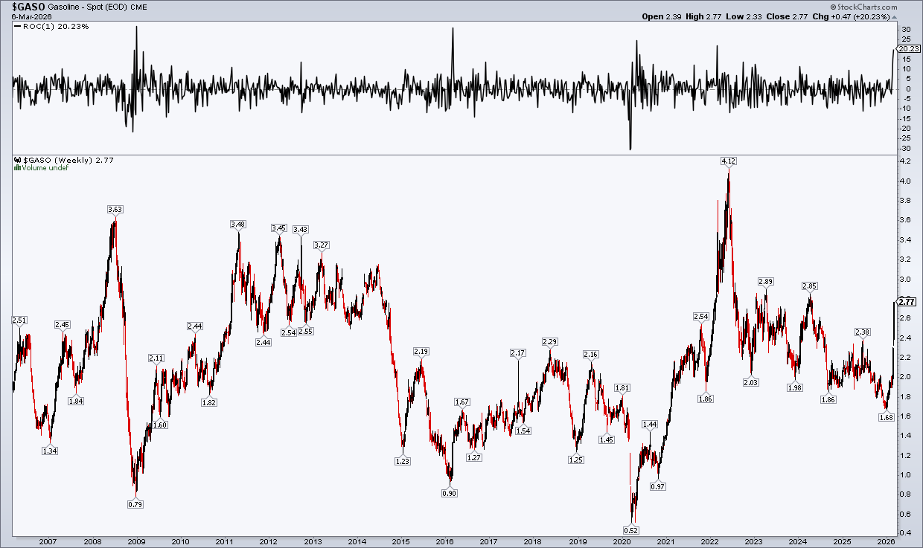
The lower dash, meanwhile, already feels the financial sting at the pump, and there’s more pain to come, it appears. RBOB gasoline ($GASO) is not as widely quoted as WTI or Brent crude oil, but it has a more direct impact on commuters, families, and small businesses.
What is RBOB Gasoline?
For background, RBOB (Reformulated Blendstock for Oxygenate Blending) is a refined, unleaded, petroleum-based component blended with 10% ethanol to produce cleaner-burning, EPA-compliant gasoline.
From RBOB Futures to Retail Gas Prices
The prompt month of RBOB futures closed last week at $2.77. My rule of thumb is to tack on about $0.95 to arrive at the expected national retail average price a few weeks down the road. Quick math says $3.72 is on the way.
But that was before yet another surge to kick off Week 2 of March Madness in energies. Now showing precisely $3.00 on my screen, Americans can expect to see some $4-handles for a gallon of regular unleaded soon (and many states are already there).
AAA reports that the average price rose to $3.478 by Monday morning, with just four states sub-$3. For context, it was a few cents below $3.00 nationwide to close February. So, perhaps a week from now, we’ll hit that $3.95 average.
It’s front-page news stuff, for sure. But can the charts help us determine what lies ahead for gasoline, specifically? At this point, it appears that as go global oil, European natural gas, and US gasoline, so go the stock and bond markets. Let’s dive in.
Why Futures Backwardation Complicates the Chart
It’s not easy performing traditional technical analysis on commodities that turn highly backwardated, meaning when the prompt month’s price is significantly above later-dated contract prices. The opposite, contango, is when bearish oversupply puts intense downward pressure on near-term futures.
Backwardation happens amid speculative booms and physical shortages, while contango may occur during recessions. As it stands, oil and gasoline backwardation trends are the new VIX.
Reading the Gasoline Futures Curve
RBOB for April 2026 delivery is $3.00, but go out to May and it drops to $2.94. Step ahead all the way to the end of the year and December is $2.19. Seasonally, gasoline futures are cheapest for January and February, and those levels are $2.05. So, if nothing else changes, while a $4 national average gas price may be in our near future, a return to $3 is expected come winter.
This futures term structure makes interpreting key chart levels tougher, since there can be large “roll gaps” when the market shifts from one month to the next. The best practice may be to analyze a specific month, e.g. the April 2026 contract, and identify support and resistance spots there. Dissecting the continuing prompt means sussing out signal from noise amid the big rolls.
But there’s another way individual traders can play the volatility and intense trends in the gasoline market.
A Simpler Method to Track Gasoline: UGA
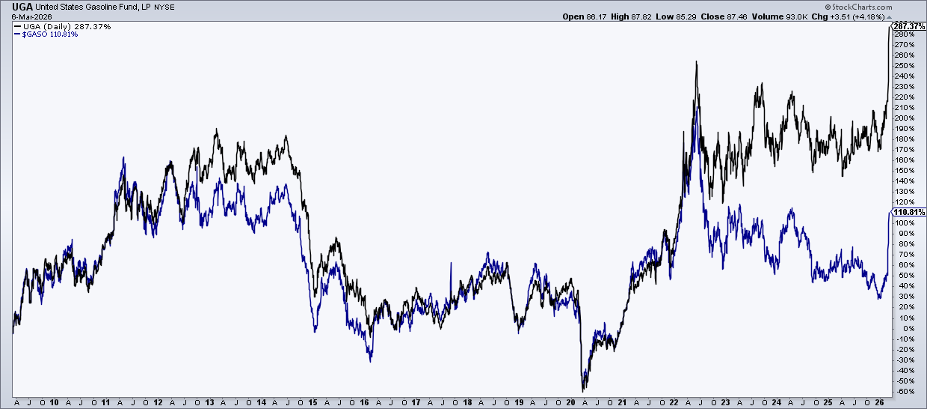
That way is called the United States Gasoline Fund, LP (UGA), an ETF designed to track the daily price movements of gasoline. Its benchmark is the near-month NYMEX-traded RBOB futures contract. If the near-month contract is within two weeks of expiration, UGA’s benchmark will be the next month contract to expire. UGA is not highly traded, however, with an average daily volume of less than 30,000 shares, so, please keep that in mind.
Investors are surely familiar with its cousin, the United States Oil Fund (USO). While USO has a dubious history tracking WTI crude oil, UGA has generally followed RBOB closely. To be clear, both USO and UGA have outperformed their respective continuous prompts over the past years, driven by favorable market structures and macroeconomic trends.
The primary factor has been persistent backwardation in energies since the Russian invasion of Ukraine. USO and UGA have also been able to collect higher interest income on their collateralized cash balances since 2022.
UGA Breaks Out of a Multi-Year Base
Mechanics and definitions aside, here’s what I see in UGA...
Notice in the chart below that the gasoline ETF broke out from a years-long consolidation... before the US and Israel launched strikes on Iran. The close of February was the big signal, as price settled above a key downtrend resistance line. What’s more, UGA bottomed last April and went on to print a series of higher highs and higher lows.
Measured Move Points Higher—But How Much?
Zooming out, we find that the long-term symmetrical triangle’s height was about $30 when it began taking shape. Add that to the recent breakout level of $70, and $100 is the measured-move upside target. Now, $87.46 was last week’s UGA close, so, with this week's rally, chart-pattern work augurs that much of the upside thrust is done — for now, at least.
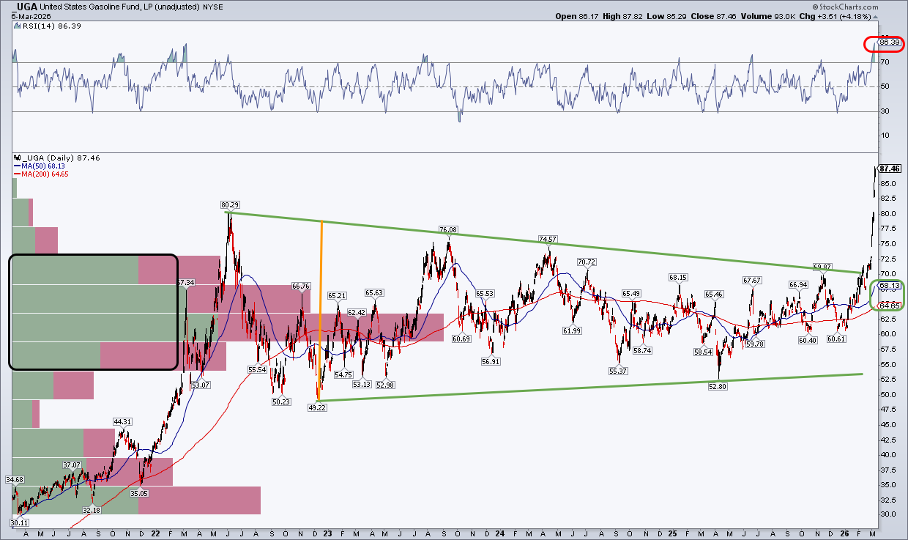
Depending on where UGA pauses in the days, weeks, or (hopefully not) months ahead, we can apply Fibonacci retracement levels using the December–January lows close to $60 as the starting point.
Long-Term Trend Still Favors the Bulls
For now, UGA is at the most overbought level in its 18-year history. And while there’s rarely much volume, a high number of shares traded between $55 and $70 should act as long-term support.
Finally, take a look at the long-term 200-day moving average on the chart above—it's on the rise, suggesting that the bulls control the primary trend. The 50-dma rose through the 200-dma in a bullish golden cross pattern last July, when oil and gasoline volatility were much lower.
A Small Silver Lining?
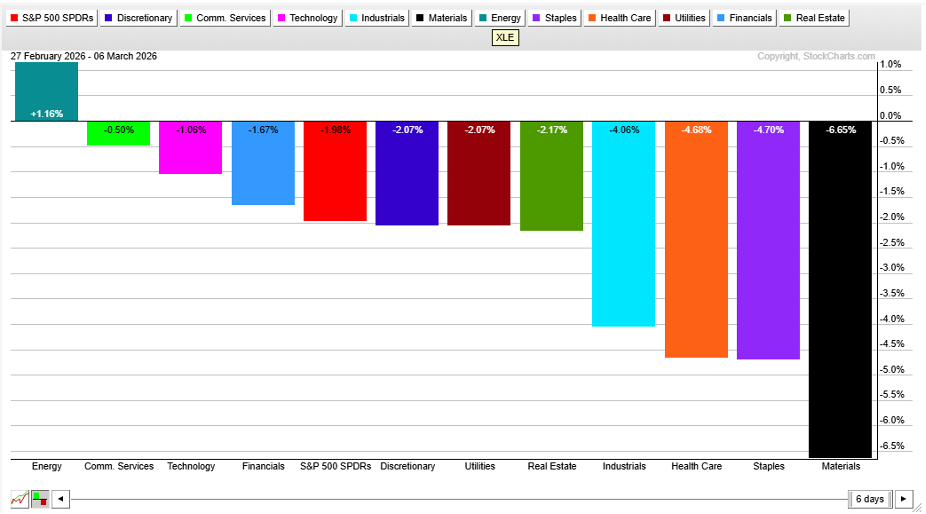
One last glimmer of hope for commuters: while oil and gasoline went bananas last week, energy-sector equities rose just 1.2%. That may suggest the commodity spike is more of a short-term shock than the start of a sustained move.
Had the Energy Select Sector SPDR ETF (XLE) rallied, say, 20%, the market might be signaling a more protracted stretch of $100+ WTI and $3+ RBOB.
The Bottom Line
There’s more pain at the pump on the way, but the UGA ETF may hint that most of the upside damage has been done for those of us who are naturally short physical gasoline.
We have never seen moves like this in the prompt-month energy futures markets, and headlines will surely spur huge up-and-down moves in the hours, days, and weeks ahead. But you don’t have to be a NYMEX futures trader to play it.
Disclaimer: This blog is for educational purposes only and should not be construed as financial advice. The ideas and strategies should never be used without first assessing your own personal and financial situation, or without consulting a financial professional.