Market Rotation: Is "Sell America 2.0" Just Another Leadership Shift?

Key Takeaways
- Rising global yields pressure U.S. megacaps as investors dust off the “Sell America” playbook.
- S&P 500 breaks key technical levels while tech, media, and telecom leadership shows clear signs of fatigue.
- Diversification pays as small caps, foreign equities, and commodities produce big alpha.
On Tuesday, the S&P 500 suffered its second-worst session since late April, and the selling wasn’t evenly spread. The losses were most intense among the tech-media-telecom stocks, with Information Technology and Consumer Discretionary coming under the most pressure. Consumer Staples was the lone sector to finish in the green, while Energy and Health Care sharply outperformed the broader index.
The Big Backup in Rates (Simplified)
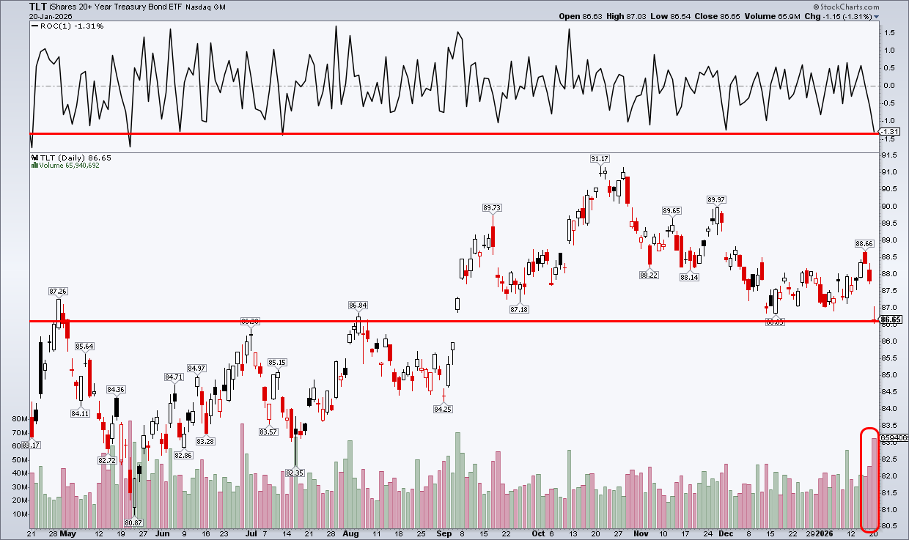
Stocks weren’t the only asset group moving this week, as bond prices were also lower. It was the iShares 20+ Year Treasury Bond ETF’s (TLT) biggest drop since July 11, 2025. The long bond had soared to its highest mark since September 2, within earshot of the 5% level, but rates backed up in a big way thanks to geopolitical drama at home and fixed-income turmoil in Japan.
The Land of the Rising Sun became the land of rising interest rates amid fiscal fears. Its 30-year yield notched a record high of 3.88% before backing off today.
So… Is “Sell America” Back?
Keeping with the global intermarket theme, the US Dollar Index (USD) shed close to 1% between last Friday and this past Tuesday before bouncing back from 98.25 to 98.67 Wednesday morning. During the throes of the selloff, investors started dusting off an old phrase: “Sell America.” Even casual investors know what that is.
It was less than 10 months ago when the S&P 500 endured the brunt of the selling pain shortly after President Trump trotted out those tariff boards from the White House Rose Garden on so-called “Liberation Day.” Tuesday was a miniature version of that turmoil. US mega-cap tech stocks were bloodied the most, while international equities outperformed (though still finishing down). The greenback and Treasury prices were on offer, while gold and silver shot higher (the former now closing in on the $5,000 mark and the latter not far from triple digits).
The big question is: Is this a short-term shakeout or the start of Sell America 2.0?
The S&P 500 Starting to Play Defense
Let’s go straight to S&P 500 price action. The US large-cap index finds itself in unfamiliar territory. Among all the major global equity spaces, it (and the Nasdaq 100) is in the least appealing technical state. Notice in the chart below that SPY gapped down hard on Tuesday and closed near the day’s low.
The S&P 500 plunged below its flattening 50-day moving average, bringing the prospect of a turn-of-the-year false breakout into play. I’d also call out that the RSI momentum oscillator at the top of the chart has printed a series of lower highs, suggesting the uptrend is turning tired.
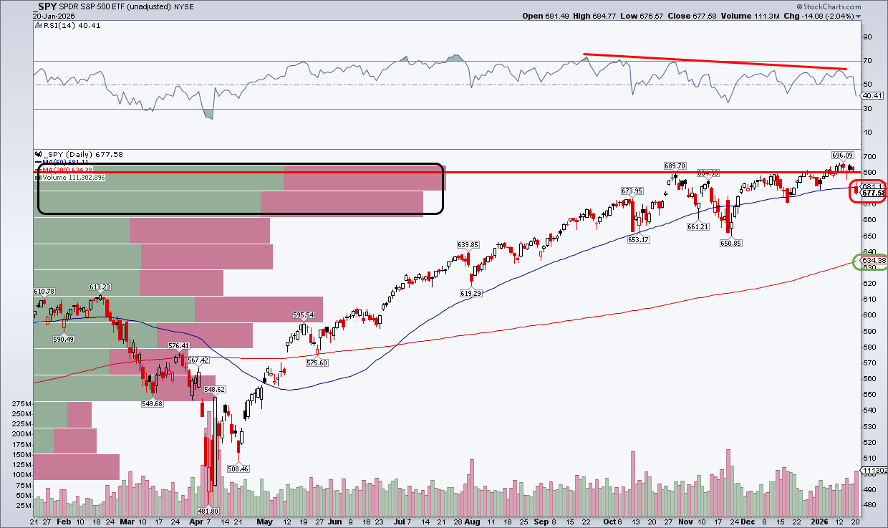
We’ve seen this movie before. A similar setup showed up in November. Immediately after Q3 tech earnings, the bears appeared to have the upper hand. The bulls dusted themselves off and rallied decently into year-end.
Will Earnings Save the Day?
What's different this time, however, is that major quarterly reports are in the offing, just as they were when the real “Sell America” trade was in vogue last April.
Here’s why that matters: It gives investors a chance to reorient themselves away from macro uneasiness and back toward the fundamentals driving the bull market. With the start of the year, added pressure is on executive teams to deliver encouraging CY 2026 outlooks and upbeat tones on conference calls.
So far, earnings season has been a dud, as far as price action goes. According to Bank of America, both beats and misses have been punished by the market. This isn’t a great sign with tech earnings on deck.
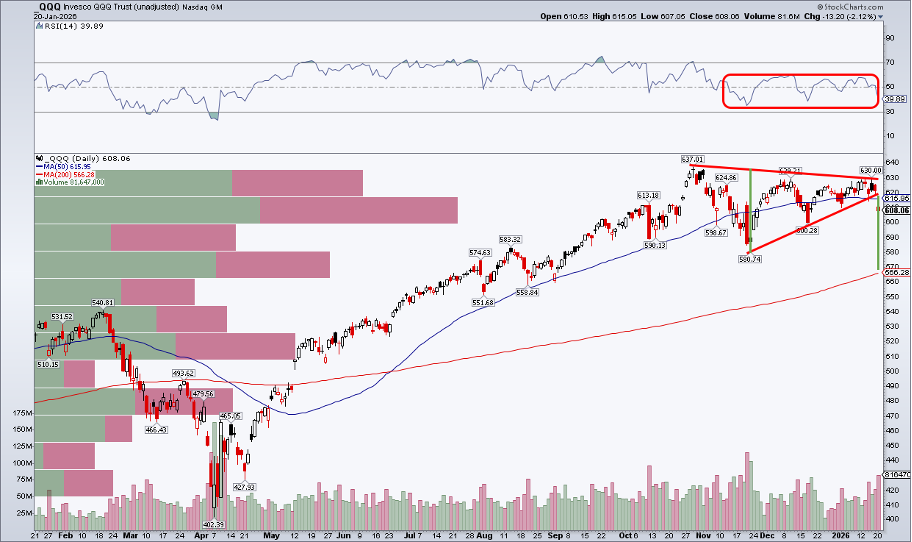
Let’s zoom in on the Nasdaq 100 ETF (QQQ) to see which price levels are most crucial.
Midterm Year Correction Watch
A correction may already be underway. Tuesday’s decline to $608 came on QQQ’s highest volume since right before Thanksgiving. What’s more, the RSI momentum oscillator at the top of the chart has been in a somewhat bearish zone between 30 and 60 since the back half of Q4.
The major negative technical feature is a breakdown from a symmetrical triangle (or coil) pattern. Yesterday’s failure triggered a downside measured-move price objective to $565 based on the height of the triangle and subsequent breakdown. $565 has confluence with the rising 200-day moving average, currently at $566.
The Mag 7 and AI names largely peaked versus the All-Country World Index ETF (ACWI) just as the Q3 reporting period began. Technically, there are a few signs that the trend is reversing.
The Good News: Diversification Is Working
It’s not all bad news for investors, though. Leadership outside of U.S. mega-caps has been impressive.
- The iShares Russell 2000 ETF (IWM) has outperformed SPY in each session thus far in 2026; domestic small caps are now solidly up compared to the S&P 500 going back a year.
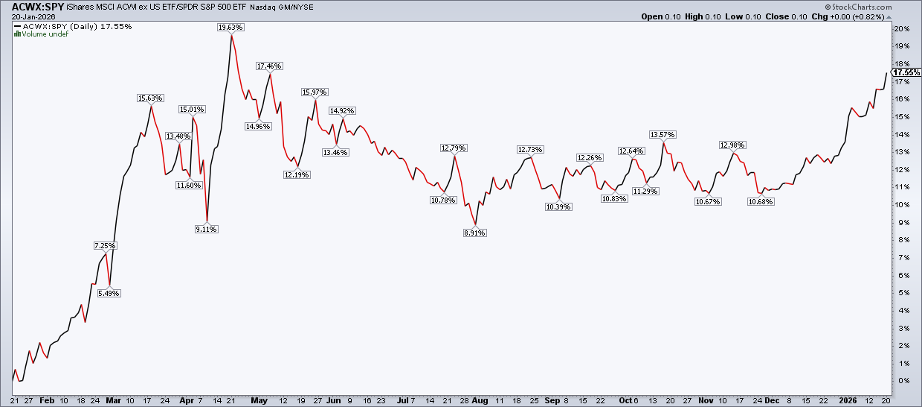
- Outperformance has also been consistent among foreign equities, with the All-Country ex-US ETF (ACWX) at fresh relative highs going back to last May.
- Credit spreads remain tight, and the iShares Core US Aggregate Bond ETF (AGG) remains up 7% on a total-return basis over the past 12 months.
- The Invesco DB Commodity Index Tracking Fund (DBC) tagged its highest price since August 2022.
The Bottom Line
The Mag 7 and U.S. megacaps are vulnerable heading into the heart of the Q4 earnings season. Other areas remain on their collective front foot. The risk is that alpha-generating areas become liquidity sources if we see a protracted global selloff. I’ll be on watch for that in the weeks ahead.
Disclaimer: This blog is for educational purposes only and should not be construed as financial advice. The ideas and strategies should never be used without first assessing your own personal and financial situation, or without consulting a financial professional.


