Market Breadth Breaks Down, but These Stocks Still Look Strong

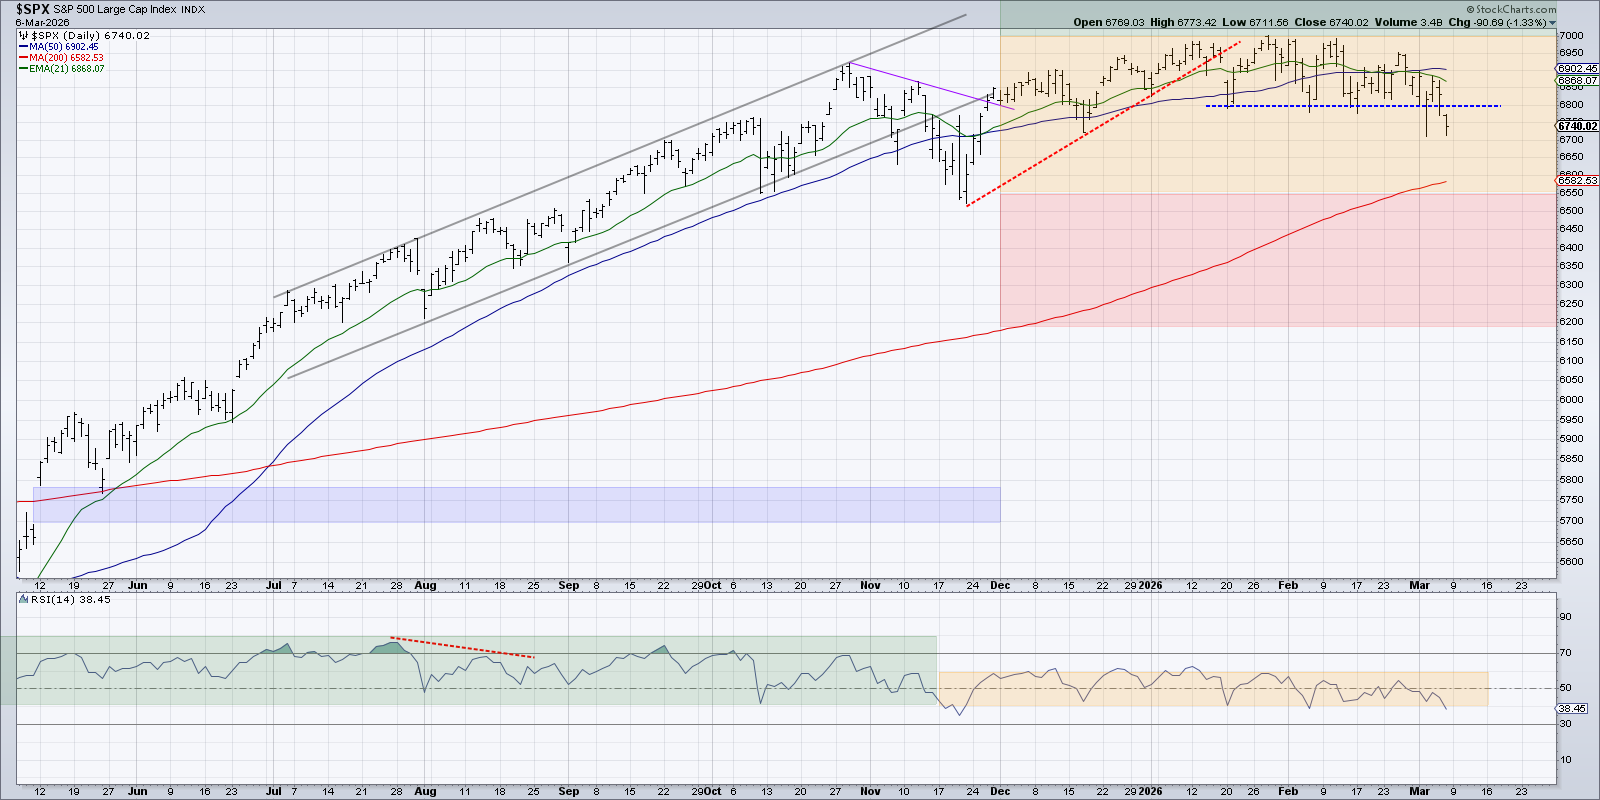
While this week was marked by a dramatic downward shift in market breadth conditions, I was still able to assemble a pretty decent list of ten charts to watch for the month of March. And even though the S&P 500 index appeared to finish the week below our initial “line in the sand” at 6800, the three charts we’re reviewing today should serve as a reminder that it’s always a good time to own good charts!
Our first chart provides a play on surging crude oil prices, although it’s worth noting that stocks like MPC experienced a strong upward surge before the most recent Middle East conflict began to emerge last week.
Marathon Petroleum Corp. (MPC)
The chart of Marathon Petroleum features a classic “big base breakout” pattern, where a consistent level of resistance was finally broken to the upside. The best part of this particular breakout? The volume is also confirming the recent upside move.
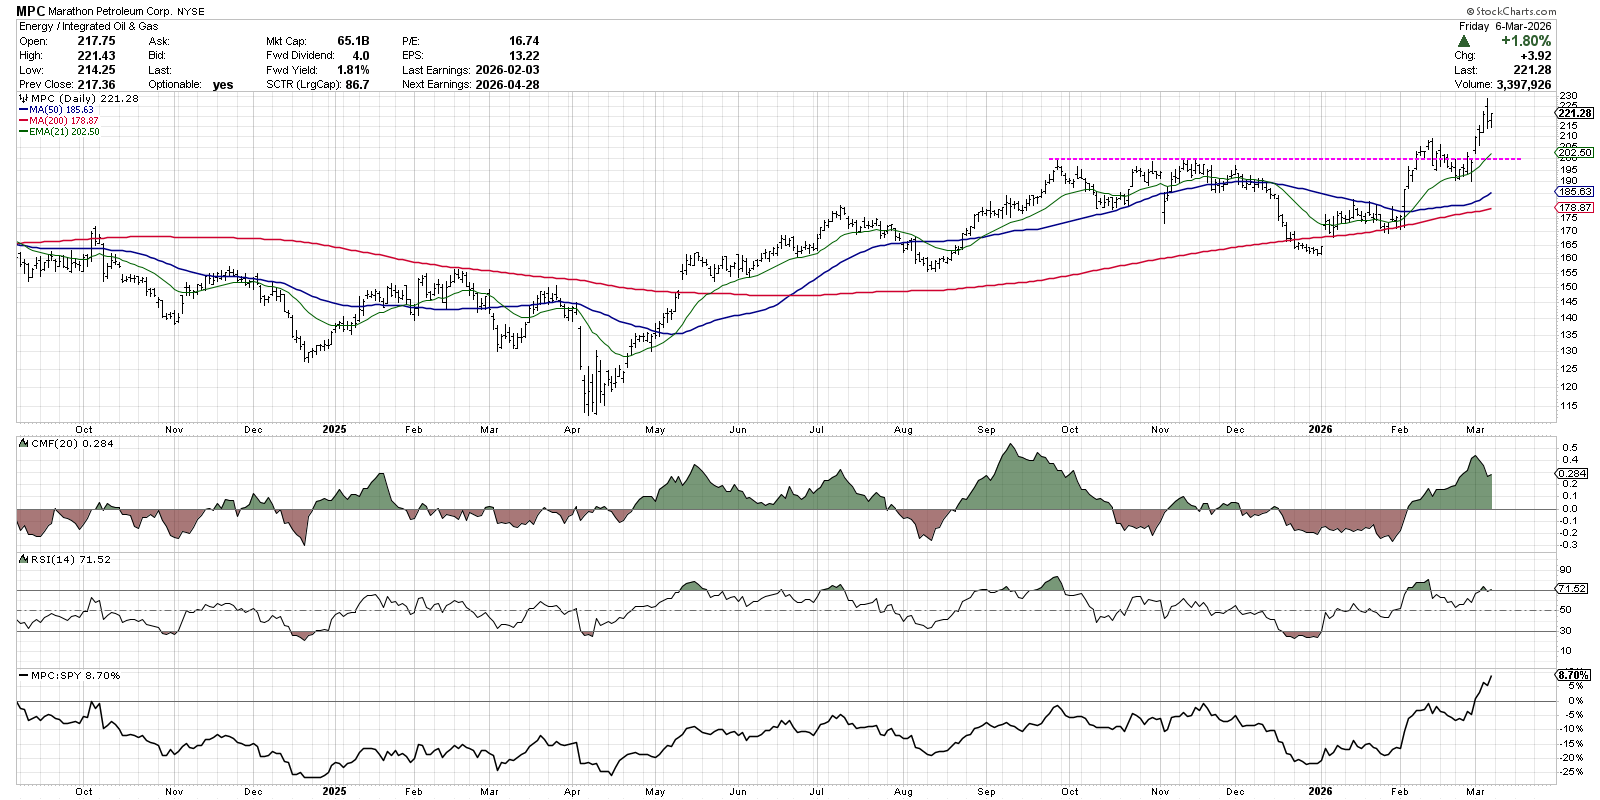
MPC finally broke above the $200 level in February, after testing it as resistance a number of times in Q4. A quick pullback followed, bringing the price down to test an ascending 21-day exponential moving average, before a gap higher in March.
Note how the Chaikin Money Flow indicator, located in the first panel below the price, moved above the zero level in earlier February. This indicates stronger signs of accumulation, as buyers overwhelmed selling pressure to propel Marathon to a new 52-week high. With strong price action, volume support, and improving relative strength, MPC appears poised for further gains.
Target Corp. (TGT)
The earnings list this week featured a number of big box retailers, with Target standing out as a great way to measure consumer sentiment. If you take a big step back from your monitor, you’ll notice a huge double bottom pattern on the chart of TGT, followed by an impressive surge off the November low.
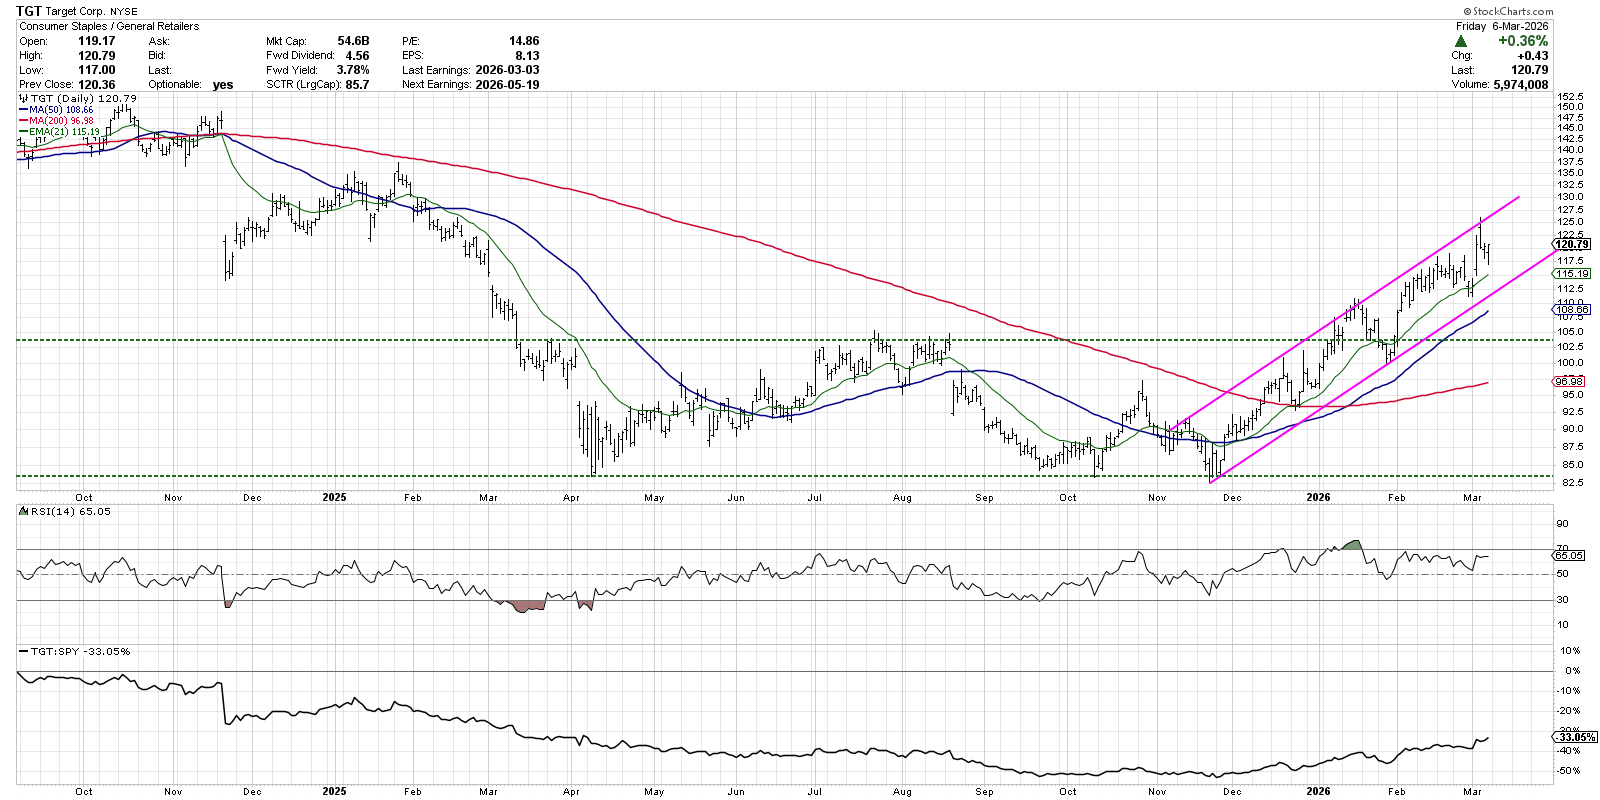
Since that November 2025 low, Target has gained about 45% while the major U.S. equity benchmarks have been relatively flat. The consistent uptrend pattern of higher highs and higher lows suggests willing buyers are stepping in to buy short-term pullbacks during this accumulation phase.
If there’s one concern on this particular chart, it’s a potential bearish momentum divergence in Q1. New swing highs in February were marked by weaker momentum readings, implying a lack of upside follow-through. After this week’s bounce off the 21-day EMA, I’d be looking for a new price high driven by higher RSI levels to validate the current uptrend phase.
Palantir Technologies (PLTR)
While it feels as if growth sectors like technology would not provide the best opportunities, given the broad rotation into value sectors, I can’t help but identify strong charts regardless of their sector designation. With that in mind, it may be a great time to revisit Palantir.
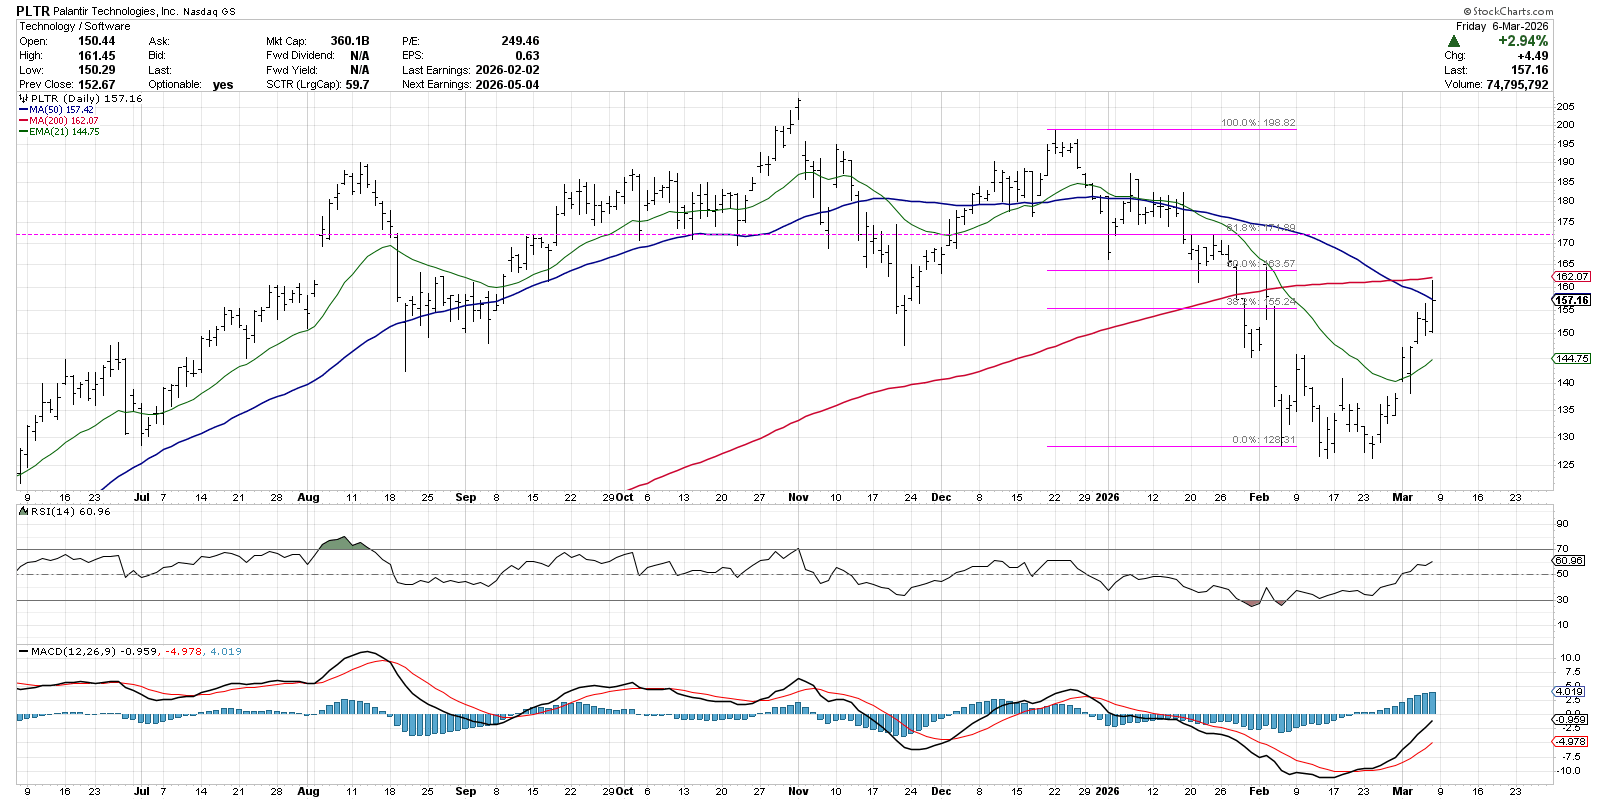
To be clear, this is a stock that has been below its 200-day moving average since late January. The price momentum has been abysmal, with the Relative Strength Index (RSI) remaining mostly below 50 since that breakdown. But after a bullish crossover from the MACD indicator on the third week in February, we’re curious if resistance levels will be left in the rearview mirror by this former high-flying growth stock.
PLTR had a strong week despite weaker equity benchmarks, and Friday's strong close pushed the stock above a 38.2% retracement of the December to February drop. If Palantir can continue above the 200-day moving average, we’d focus on potential resistance at the 61.8% retracement level around $172. For now, the Moving Average Convergence/Divergence (MACD) buy signal and improving price momentum suggests further upside potential for Palantir.
For a full review of these charts, along with the rest of the top ten charts on my list for March, check out my latest video on StockCharts TV!
RR#6,
Dave
P.S. Ready to upgrade your investment process? Check out my free behavioral investing course!
David Keller, CMT
President and Chief Strategist
Sierra Alpha Research LLC
marketmisbehavior.com
https://www.youtube.com/c/MarketMisbehavior
Disclaimer: This blog is for educational purposes only and should not be construed as financial advice. The ideas and strategies should never be used without first assessing your own personal and financial situation, or without consulting a financial professional.
The author does not have a position in mentioned securities at the time of publication. Any opinions expressed herein are solely those of the author and do not in any way represent the views or opinions of any other person or entity.