Nifty Awaits Budget Trigger as Consolidation Narrows
The past week saw the markets trading in a defined range while maintaining a positive bias. After witnessing some volatility early on, the Nifty oscillated between 24,932 and 25,458 before ultimately settling with modest gains. India VIX dropped 3.95% to 13.63, indicating cooling volatility. Overall, the Nifty ended the week with a gain of 272 points or 1.09%.
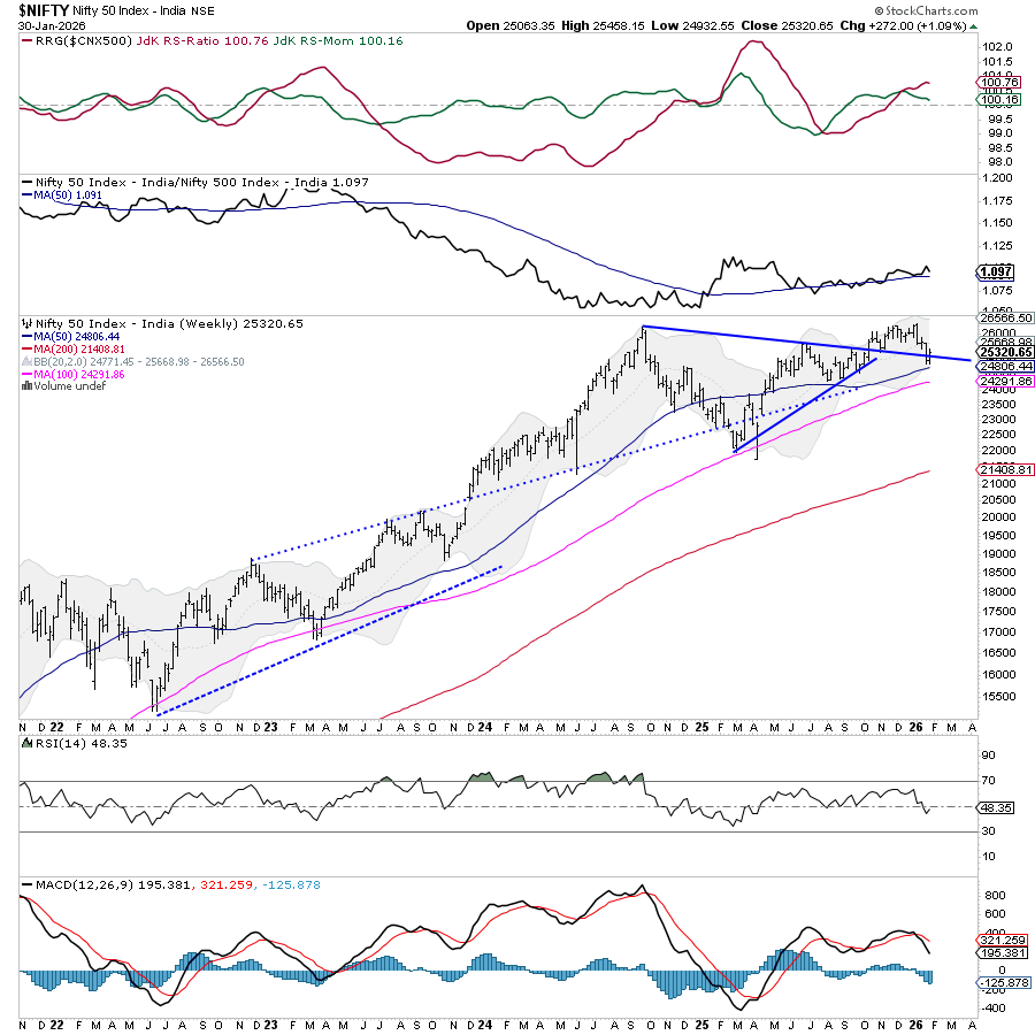
A key domestic event, the Union Budget, is scheduled for Sunday. Markets have a full session on Sunday. Nifty continues to trade within a broad consolidation zone and has managed to defend its 50-week MA (24,806); it has also defended the 200-day MA (25,199) after slipping below it in the previous week. The Index can be observed taking support near the downward falling trendline and has closed slightly above this critical zone. Markets are currently not in a trending phase, and a decisive break above 25,400 or below 24,900 would be required to set a directional move. The trend remains vulnerable to headline risk from Budget announcements, which could trigger a breakout or breakdown depending on the proposals.
Given the critical event on Sunday (Union Budget), the markets may see a flat or mildly cautious start to the week. Historically, such special sessions begin in a range-bound fashion until post-11 AM, after which sharp volatility usually sets in. For the week ahead, immediate resistance is placed at 25,500 and 25,700 levels, while supports exist at 24,900 and 24,750.
The weekly RSI is at 48.35 and remains neutral, neither showing any divergence nor an extreme condition. The weekly MACD remains below its signal line, maintaining a negative crossover. There is no significant candlestick formation this week; the recent candle is small-bodied, reflecting indecision and range-bound action.
From a pattern standpoint, Nifty remains within a large rising channel. The falling trendline point is placed between the 20-week MA and the lower Bollinger Band, making 24,750–24,800 a critical support area. The Index is currently trapped between the 20- and 50-week moving averages (24,748 and 24,806), and the inability to break either side could extend the ongoing consolidation.
In view of the significant event risk, traders and investors would do well to stay cautious in the earlier part of the week. A stock-specific approach is advised over aggressive index positioning. Protecting profits and avoiding leverage ahead of Budget outcomes would be prudent. It would be wise to wait for directional clarity post-Budget before taking any decisive calls. The best approach for the coming week would be to remain vigilant, protect gains, and respond to breakouts or breakdowns from the current zone with measured risk.
Sector Analysis for the Coming Week
In our look at Relative Rotation Graphs®, we compared various sectors against the CNX500 (NIFTY 500 Index), representing over 95% of the free-float market cap of all the listed stocks.
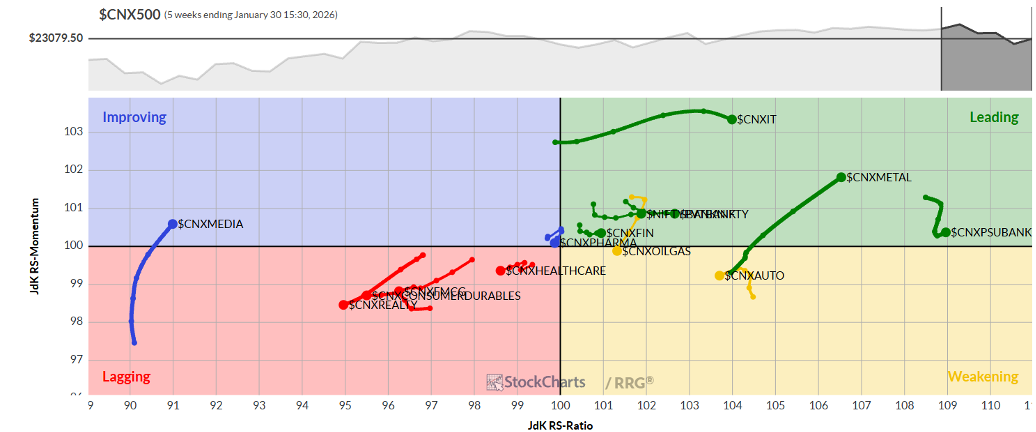
Relative Rotation Graphs (RRG) show the Nifty IT Index, Financial Services, Midcap 100, Metal, PSUBank, Banknifty, and Services Sector Indices placed inside the leading quadrant. While indices like Services and Midcap 100 are loosening their relative momentum, this group is likely to largely outperform the broader markets relatively.
The Auto Index and the Infrastructure Index are inside the weakening quadrant. While stock-specific performance may be seen, these two sector indices may see their relative performance slow down.
The FMCG and the Realty Index continue to languish inside the lagging quadrant. These groups may relatively underperform the broader Nifty 500 Index. The Energy Index is also inside this quadrant; however, it is sharply improving its relative momentum.
The Media Index has rolled inside the improving quadrant. Besides this, the PSE Sector Index is also inside the improving quadrant; these groups may improve their relative performance against the broader markets relatively.
Important Note: RRG™ charts show the relative strength and momentum of a group of stocks. In the above chart, they show relative performance against NIFTY500 Index (Broader Markets) and should not be used directly as buy or sell signals.
Milan Vaishnav, CMT, MSTA
Consulting Technical Analyst
www.EquityResearch.asia | www.ChartWizard.ae