StockCharts Insider: The Big Correction Nobody's Talking About (Because Nothing's Happening)
Before We Dive In…
Everyone braces for a big price plunge. Nerves fray. Stops sharpen. The voice in your head incessantly repeats, “small correction or something worse?” In contrast, nobody braces for “nothing happening.” But that’s the profile of a second kind of correction. Prices just go back and forth, annoyingly, and this can last a few weeks to several months. It’s called a time correction and, like any market condition, it, too, has its share of opportunities and risks.
Corrections Come in Two Flavors
A price correction is typically identified as a steep decline between 10% and 20%. These types of corrections are loud, and they make headlines. They cause some investors to freak out, as the drop is palpable, especially when dealing with huge positions.
A time correction, on the other hand, has the opposite profile. Prices just meander within a range. Typically, that range is smaller than a 10% decline (but not always, as we’ll see). You see the consolidation clearly. You wait, but it can keep going for a long time in some cases. It just continues to do what it's been doing, which is nothing.
What’s Behind Time Corrections?
Several things can cause stocks to fluctuate in a fixed range. Fundamentals have to catch up with a massive bullish run. Investors who’ve held the stock for some time are taking profits while new people are buying in. If we’re talking about a broad index, a rotation among sectors or industries may be taking place under the hood. Markets may be waiting for a bigger catalyst, like an interest rate decision, earnings season, or key economic reports.
But the Reality is Much Trickier
Some would say this is a time correction leading to a breakout, and then... another time correction?
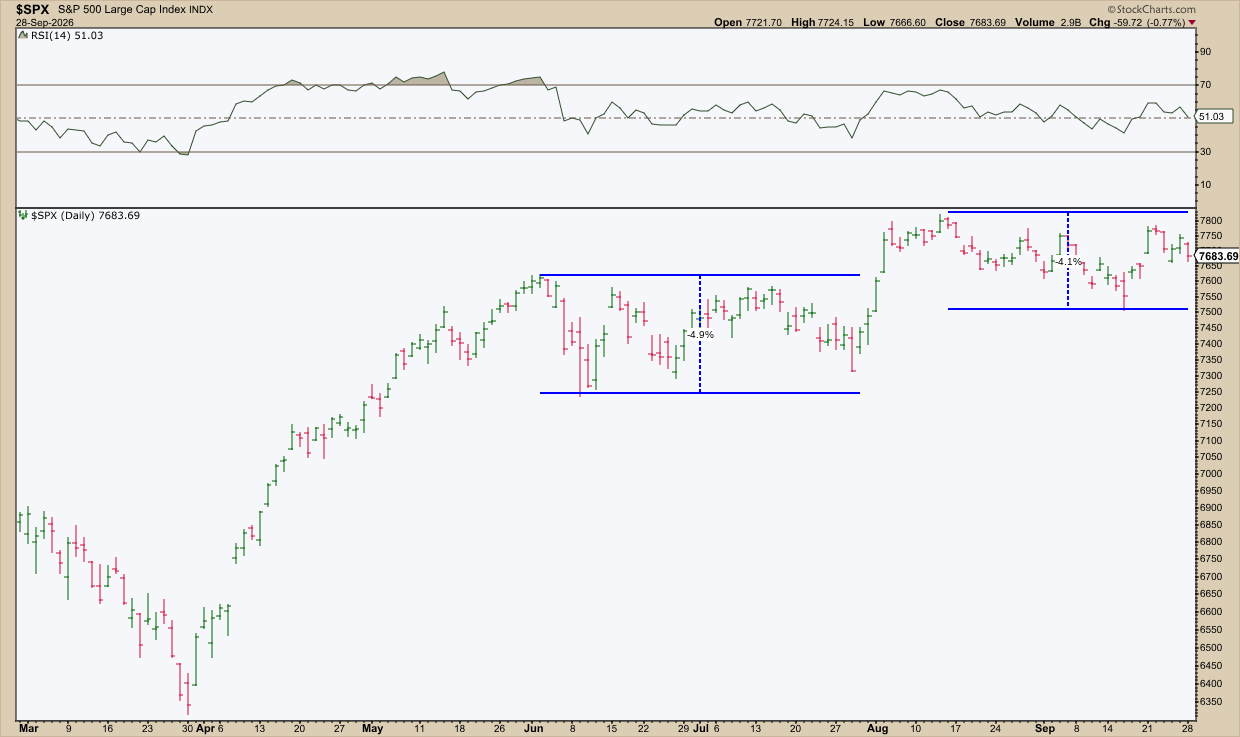
Following a strong rally from April to June, price traded within a (nearly) 5% range for almost two months. Then the S&P broke out of its range at the end of July, only to continue trading another 5% range. Notice the flat range in the Relative Strength Index (RSI) as well.
So what’s going on?
The backdrop isn’t calm. The national debt crossed $40 trillion in August 2026. The 10-year Treasury yield broke above 5% mid-September. Middle East tensions kept oil prices elevated and rising. In this case, if nothing’s happening in the index, it’s because too much is happening in terms of economic signals and the markets are either trying to figure out how to forecast such a messy scenario.
Here's another example.
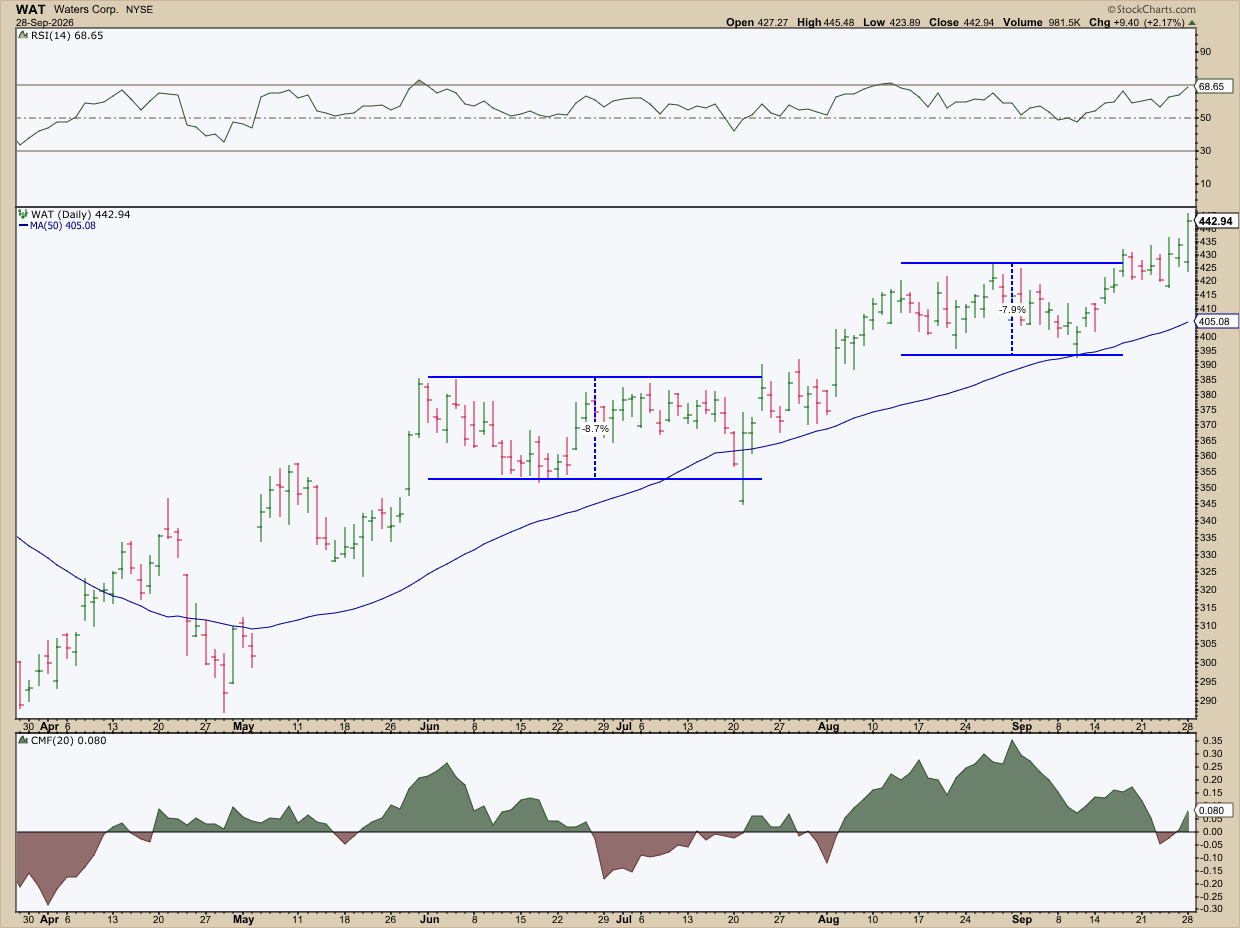
In this chart of Waters Corp. (WAT), you see a volatile rise leading to a peak in late May. Then momentum winds down and, from there, price trades in an 8.7% range until a breakdown, which is followed by an immediate upside breakout in July. WAT continues trading sideways from mid-August to mid-September until it continues churning higher.
Did it wear on investors’ patience, especially considering the geopolitical and economic backdrop? It probably did. But notice the difference in the Chaikin Money Flow (CMF) readings between the two time corrections, and how the 50-day Simple Moving Average continued to slope higher amid the sideways price movement. Maybe we can say that, if these periods did weigh on investor sentiment in a negative way, neither case provided any evidence for selling.
It’s easy to say that a time correction usually doesn’t exceed 10% as a general principle. But, in many scenarios, reality can get much blurrier.
When the Lines Blur
Real life is blurrier than textbook versions. I said earlier that price corrections can be frightening while time corrections are generally boring. I also said that price corrections usually don’t exceed 20%. In many cases, price action will violate all of those rules. Take, for instance, this chart of Dell Technologies, Inc. (DELL).
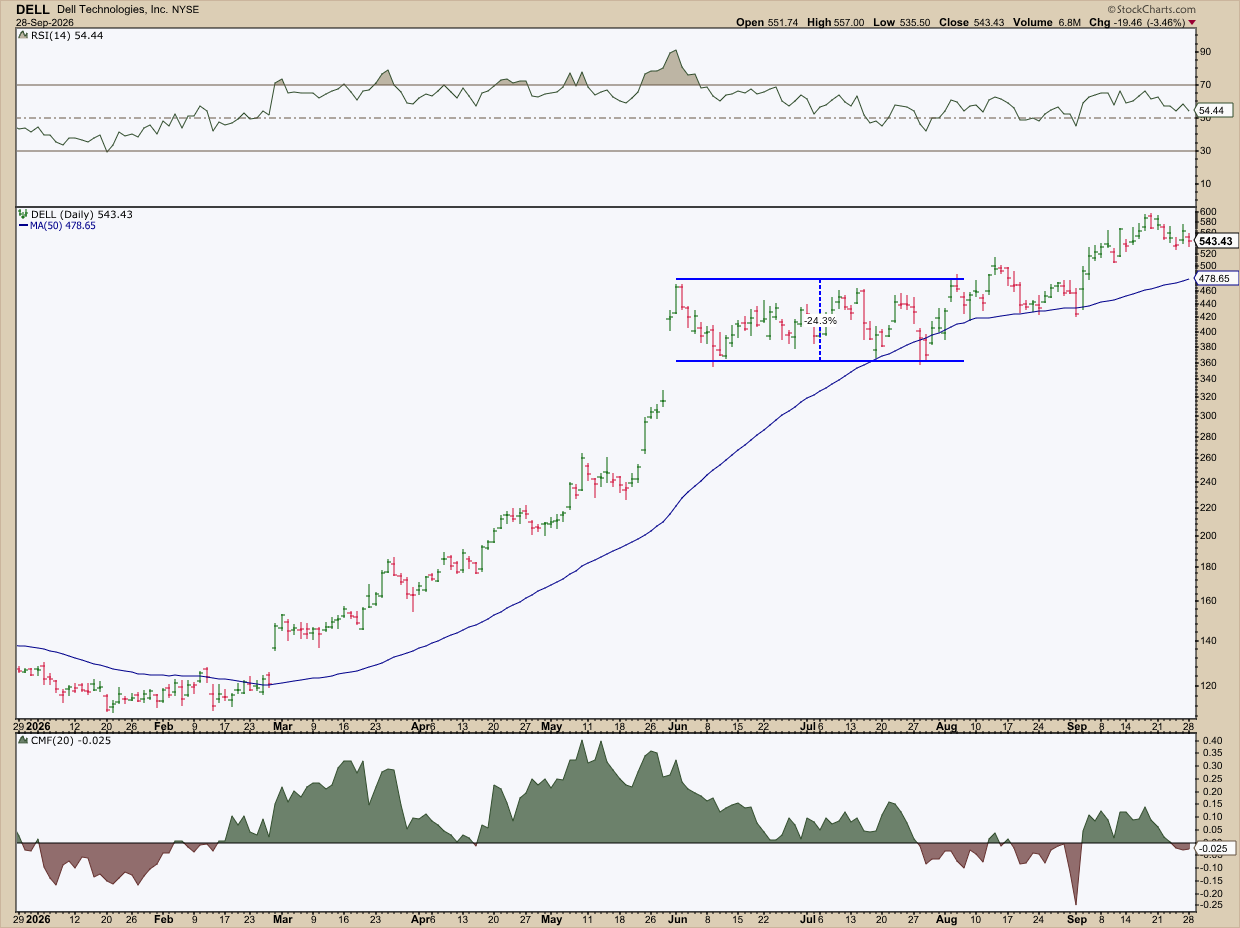
It’s a price correction. It’s also a time correction. And the decline of this hybrid price/time correction exceeded 24%. Additionally, the RSI reading is flat. And the CMF shows dwindling money flow all the way up, while the 50-day SMA continues to grind higher.
Also, if you do some internet research, you’ll find that not everyone agrees on the same definition of a time correction, which many say can last for years.
For example, some analysts call the 13-year Microsoft range a single, multi-year time correction. I’m not sure.
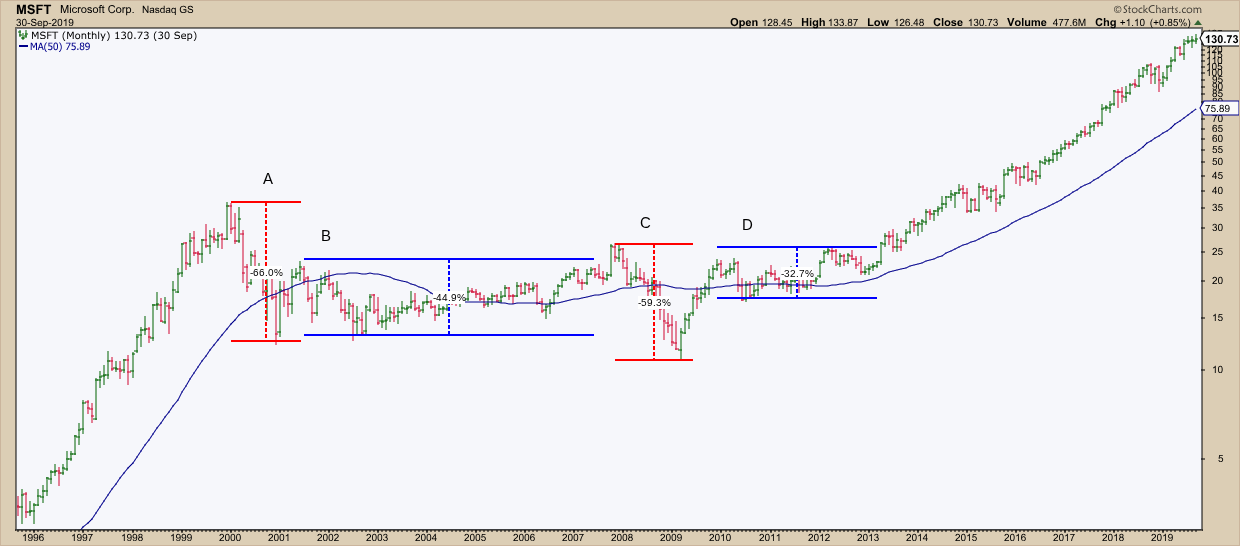
Some may argue, but I wouldn’t consider this a multi-year time correction at all. At best, there are two bear markets (A and C) and perhaps two time corrections (B and D), each exceeding 44% and 32% respectively.
This looks more like a series of valuation resets, doesn’t it? A and C are bear markets riding the Dot-com bust and the 2008 financial crisis. Earnings fell, as with almost every stock in the market.
B and D are different. MSFT earnings kept climbing while prices went nowhere. The ranges were quite large as well. But the mechanics behind it exhibit time correction characteristics. This entire sequence went on for 13 years. So, this is not just one long time correction. It’s four different events.
The Time Correction Trap
The trap is inherently built into the natural uncertainty in the markets. Sure, mistaking a price correction for a time correction and vice versa can cost you. That’s where market structure, measurement, and being aware of fundamentals can really help. Aside from those, here are a few tips to consider.
Insider Tip #1: Don’t Sell Out of Boredom, No Matter How Annoying.
WAT held an upward sloping 50-day SMA with increased volume on the second time correction. DELL’s 50-day SMA had the same slope but with dwindling volume. Nothing immediately said “get out.” It was a test of patience and caution. But it wasn’t a sell thesis.
Insider Tip #2: Don’t Just Hold Out of Habit.
If you look at the MSFT example, the bigger declines in B and D, as they were happening, might have felt like the beginnings of an A and C drop. In retrospect, D’s sideways movement might have looked like B, but just narrower. The difference was in earnings. By Fiscal 2010, MSFT’s profits hit a new record. But the stock didn’t respond to that. Looking back, that was when accumulation happened. But the signal was there.
Insider Tip #3: Check the RSI and CMF to Gauge the Time Correction.
If momentum is slowing, what does the money flow situation look like? And how does it compare to the overall trend? In each case, the readings vary, however slightly. Add in earnings, and you’re seeing more than the average investor.
Insider Tip #4: The Numbers and Concept is Up for Interpretation.
The common measure for a time correction is under 10%. DELL blew way past that and still was in a time correction. MSFT’s 13-year “time correction” wasn’t one at all. It was two bears and two separate time corrections that exceeded 44% and 32%, respectively. Don’t hold on too tightly to the rules.
What matters is the basic mechanics driving either type of correction. Understanding that can help you spot the risks as well as the opportunities. Always keep in mind the wider context, technically and fundamentally.
So, what are the traps here? Here are three that I can think of immediately:
- The first trap is trusting the chart to tell a complete story that only the underlying fundamentals can finish.
- The second trap is relying too heavily on the fundamentals without checking the technical scenario.
- The third trap is assuming nothing is going on underneath and selling when the evidence says “hold” or holding when the evidence says “sell.”
And That’s a Wrap
Corrections don’t always crash. Sometimes they wait, and other times they swing in what feels like sustained crashes. Your task is to figure out exactly what you’re looking at, patiently assess the situation—whether you’re bored or scared out of your wits—and figure out your next best move.