SpaceX, Meta, and Tesla Earnings: 3 Charts to Watch This Week

Key Takeaways
- A trio of tech & AI stalwarts headlines a busy earnings stretch as markets eye a rebound from last week's selloff.
- Technical charts show SpaceX stock price testing support, META flashing bullish signals, and TSLA stuck in a downtrend.
- Options markets imply relatively modest earnings moves for META and SPCX, while TSLA investors wonder if & when SpaceX will scoop it up.
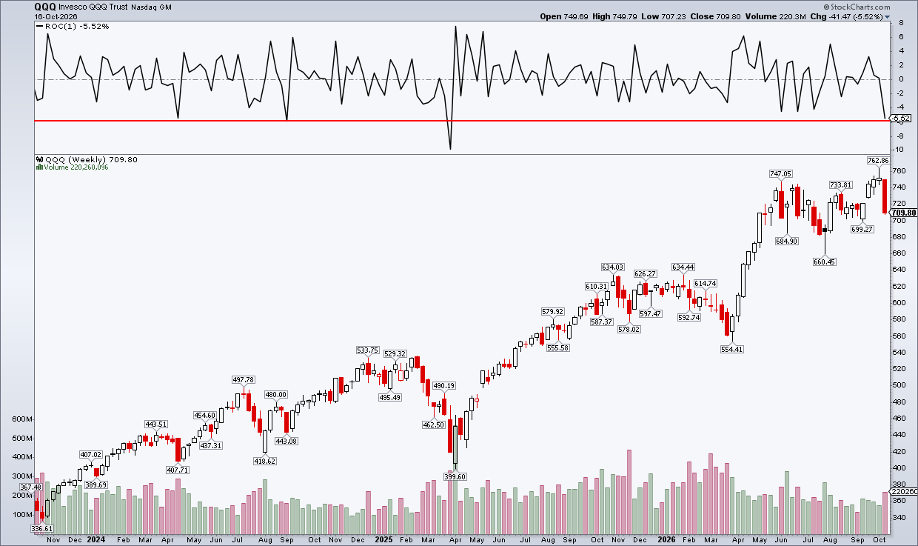
It's Monday, October 19, and the market isn't crashing. Bulls are breathing a sigh of relief after dismal price action last week saw the Nasdaq 100 (QQQ) shed 5.5% for its worst weekly decline since April 2025.
Steep losses in AI equities, namely the neoclouds, called into question the megatrend's health. Tech stocks snapped back to kick off this week and, while the macro data deck is light, the earnings slate is loaded.
Earnings on Tap
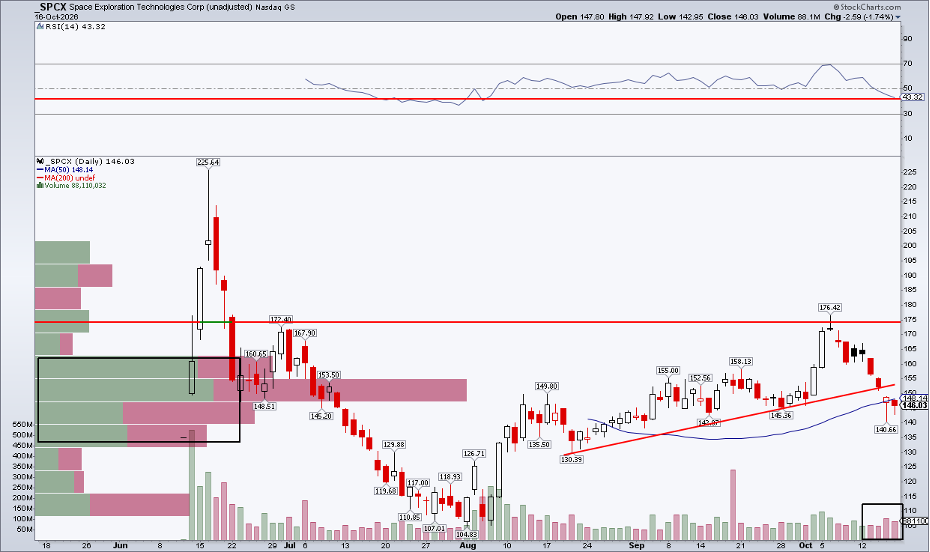
SpaceX (SPCX) kicks things off with its Q3 report, due out after the close on Tuesday. Shares of the $2.0 trillion market-cap Communication Services company plunged 10% on their own over October's middle week, reversing what was an impressive rally from a $105 low notched on August 3 to an intraday peak above $176 earlier this month.
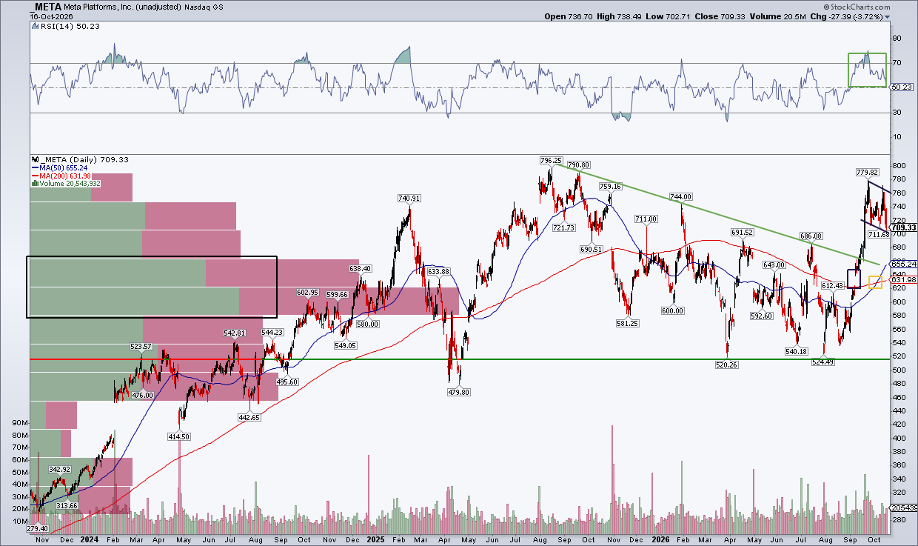
Another hyperscaler then puts out third-quarter numbers on Wednesday afternoon. Meta Platforms (META) was the Mag 7 standout over the back half of Q3, but it, too, has come under thematic selling pressure, correcting 10% in the last few weeks.
Then there's Tesla (TSLA). Spectators were in awe of Elon Musk's long-awaited Roadster. The vehicle took flight, but the stock has been grounded this year. Will that change after revenue and earnings figures hit this week?
Three Stocks, Three Technical Setups
Let's assess the technical playing field for these three early-season reporters. Amid a dearth of macro data and a Fed that's in its 10-day pre-meeting blackout window, investors are likely to once again get a healthy dose of rosy S&P 500 earnings growth details.
As it stands, analysts call for a third-straight quarter of 25%+ bottom-line gains, according to FactSet. Expectations are likely to be high, and it's up to SPCX, META, and TSLA to deliver.
SpaceX: Searching for Support After a Sharp Pullback
Starting with SPCX, shares (which may be doled out to kids around the country, per Musk) hover near their rising 50-day moving average, albeit with limited trading history. Notice in the SpaceX stock price chart below that, last Friday, the price settled about 18% off the ominous October 6 gravestone doji high. It's now exploring well-charted territory, as evidenced by a high number of shares traded from $135 (the Spacex IPO price) to $160. That could very well be the range in which the mega-cap trades following earnings.
The options market prices in a 6.8% earnings-related stock price swing based on the at-the-money straddle expiring soonest after the release. You can find all of SPCX's key option data in the StockCharts OptionsPlay Strategy Center. As for the chart, last week's low of $140.66 is a natural pivot spot. Above it, a long bias makes sense, while resistance has emerged from $172 to $176. Finally, the RSI momentum oscillator at the top of the SharpChart fell to its worst reading since August 5.
Meta: A Bull Flag Before the Big Reveal?
Next up is META, reporting mid-week. Mark Zuckerberg's company was the AI darling following Muse's massive success over the late summer. Ahead of earnings, the stock is doing all the right things, in my technical eye. The chart has a few bullish features. A clear breakout through downtrend resistance ignited a rally to a new 52-week high last month; immediately after, a bullish golden cross pattern occurred, in which the short-term 50-DMA rose above the also-rising 200-DMA.
Although META hasn't tallied a new high since September 24, the current pattern looks like a bull flag to me. The presumption is that the trend of larger degree will play out, meaning a much higher stock price once the pattern resolves. I see a confluence of support in the mid-$600s, while the RSI remains in a bullish zone (from 40 to 90).
No chart is perfect, and the bears can point to a lingering gap down at $613. I doubt that gets hit even on a bearish reaction, given a historically narrow 5.9% options straddle into the Q3 print.
Tesla: The Roadster Took Flight. The Stock Didn't.
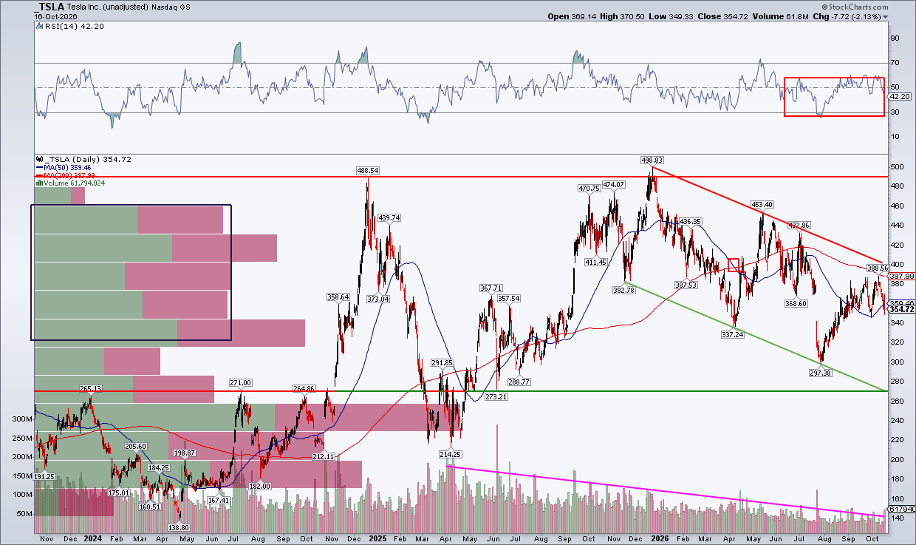
TSLA put on a show last week, but there have been more jeers than cheers from shareholders lately. My default SharpChart is three years and, on that zoom, we find that the stock's peak was $489 in 2024. Sure, TSLA made a marginal new high right before Christmas last year, but it has been a tough slog for the EV automaker and AI hopeful.
As you can see in the chart below, a downtrend channel keeps the bears in charge. That's confirmed by a weak RSI range, along with the stock now trading toward the lower end of a high-congestion zone from $320 to $460. There's risk that TSLA trades down to $270–$280, based on a polarity level and the bottom end of the trend channel. A death cross took place in Q2, just as the broader stock market was in full-blown rally mode.
For now, TSLA is below its falling 200-DMA, and the stock didn't trade well after the flying Roadster event last week (closing lower on Friday on big volume). Speaking of volume, you can really see how TSLA has lost its luster in the daily profile; fewer shares have traded since April 2025. Aside from the charts, investors are surely curious: At what price does TSLA become attractive enough for SpaceX to gobble it up?
The Bottom Line
I'm neutral on SPCX into earnings, bullish about META, and bearish on TSLA. We'll see what price action says over the coming days as all the numbers come in fast and furious.
Disclaimer: This blog is for educational purposes only and should not be construed as financial advice. The ideas and strategies should never be used without first assessing your own personal and financial situation, or without consulting a financial professional.