Assessing the Evidence: Is the Market Forming a Top?

The late summer optimism appears to have given way to a greater sense of uncertainty. At the same time, others remain upbeat, arguing that a sector rotation could propel prices even higher, as though the market were destined to rise indefinitely.
This situation reminded me that I devoted an entire chapter in Technical Analysis Explained to developing a checklist for identifying major market peaks and lows. The objective of this exercise, therefore, is to assess how the current environment measures up against that checklist.
The first point to understand is that, with the benefit of hindsight, a market peak can be viewed as a single event, namely the day of the ultimate high. In real time, however, a peak is more of a process, in which more items in the checklist are crossed off and risks escalate. Let’s go through a partial checklist and see how things stack up.
- For a major top to form, it must first be preceded by a bull market lasting at least nine months. Since the current bull market began in 2022, it easily satisfies this requirement.
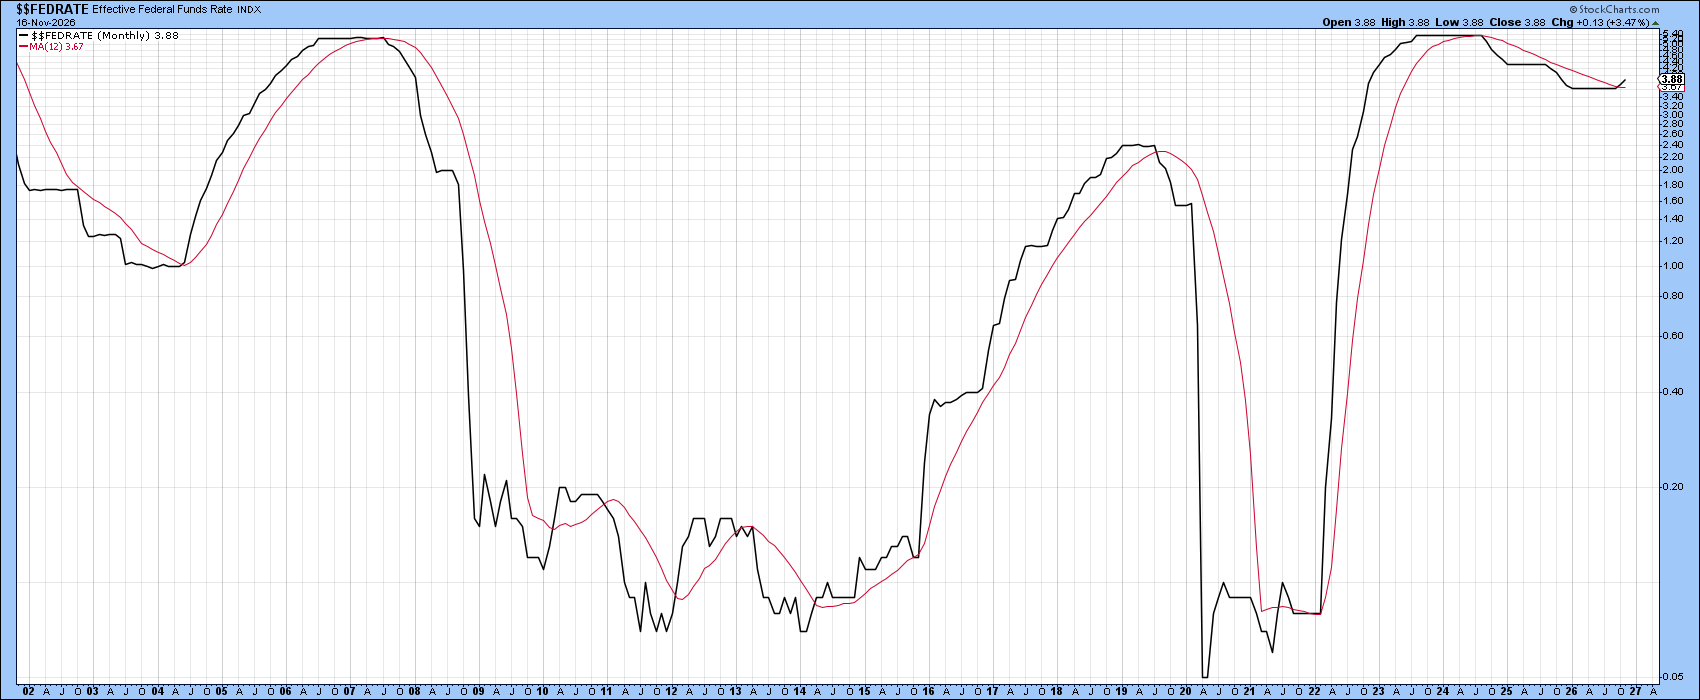
- Almost all major market peaks are preceded by a trend of rising interest rates as policymakers seek to cool inflationary pressures. The Federal Funds Rate has already been raised twice, and a third increase appears likely in December. As Chart 1 shows, the rate is already above its 12-month moving average. A third hike would represent the modern-day equivalent of Edson Gould's "Three Steps and a Stumble" rule, which held that three increases in the discount rate often set the stage for a setback in stock prices. In other words, interest rates eventually rise to a level where the risks of owning equities begin to outweigh the potential rewards.
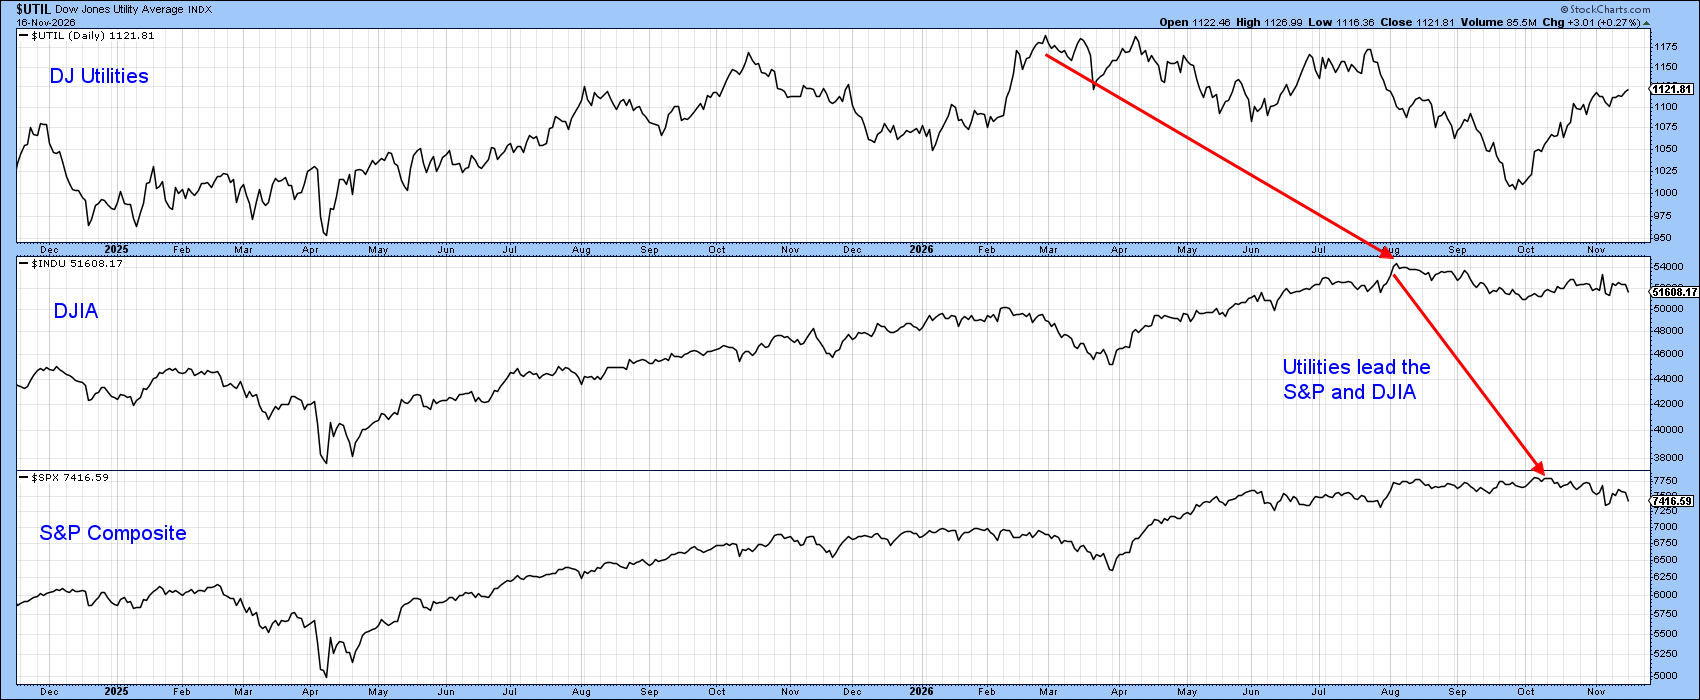
- Major market tops are often preceded by a peak in the Dow Jones Utility Average ($UTIL). Chart 2 shows that this interest-sensitive average topped out ahead of both the Dow Jones Industrial Average ($INDU) and the S&P 500 ($SPX), a pattern that has frequently served as an early warning of broader market weakness.
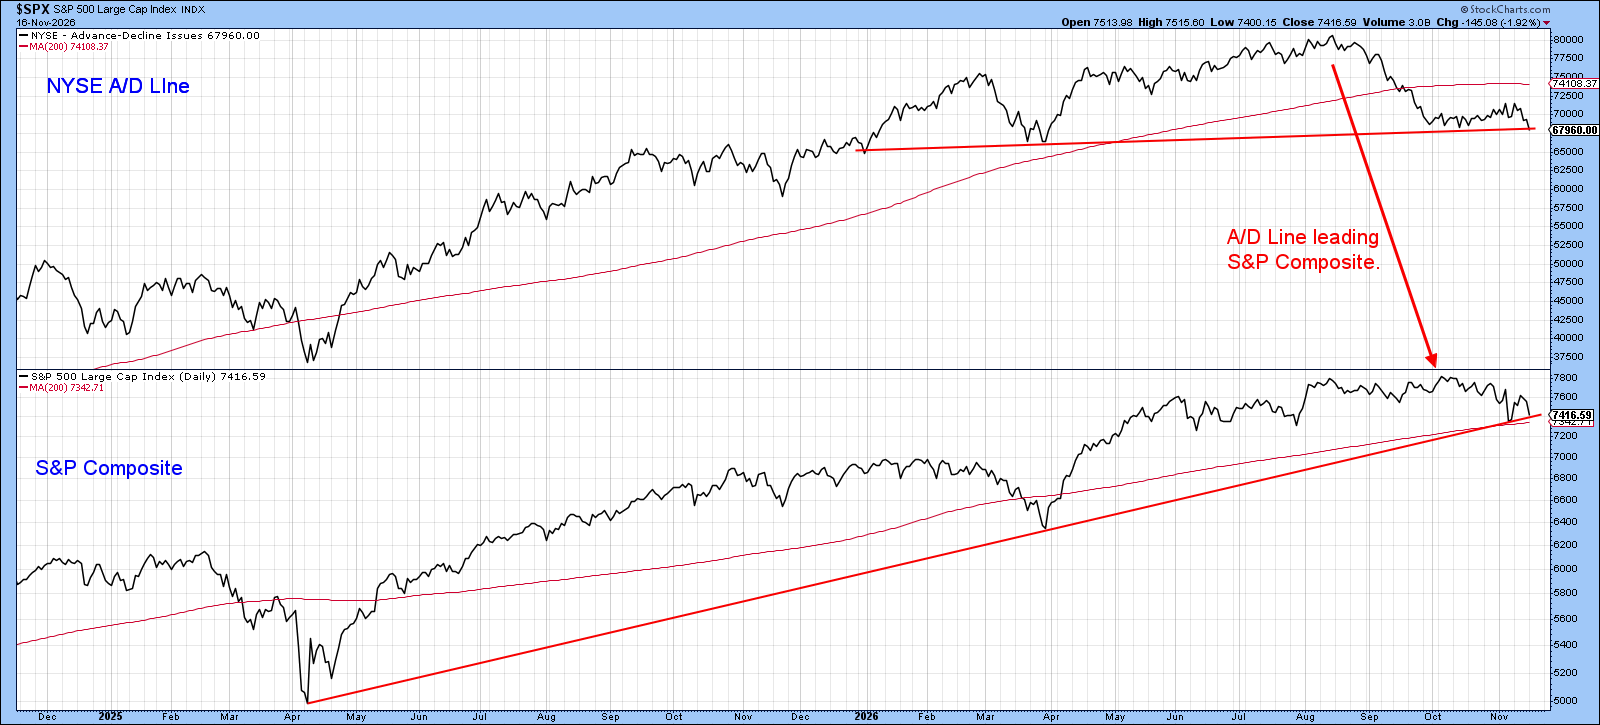
- Rising interest rates have adversely affected the broad market, resulting in a negative divergence between the S&P Composite and the NYSE Advance-Decline Line. Chart 3 illustrates this development. The A/D Line peaked in August and has already broken below its 200-day moving average, a sign that market participation has been weakening beneath the surface. Meanwhile, the S&P is only now approaching a critical support zone defined by its 200-day moving average and post-2025 uptrend line. Unless breadth improves, the weakness in the A/D Line may be signaling further vulnerability for the broader market.
- The Value Line Geometric Average, another measure of market breadth, has also recorded a modest negative divergence relative to the S&P 500.
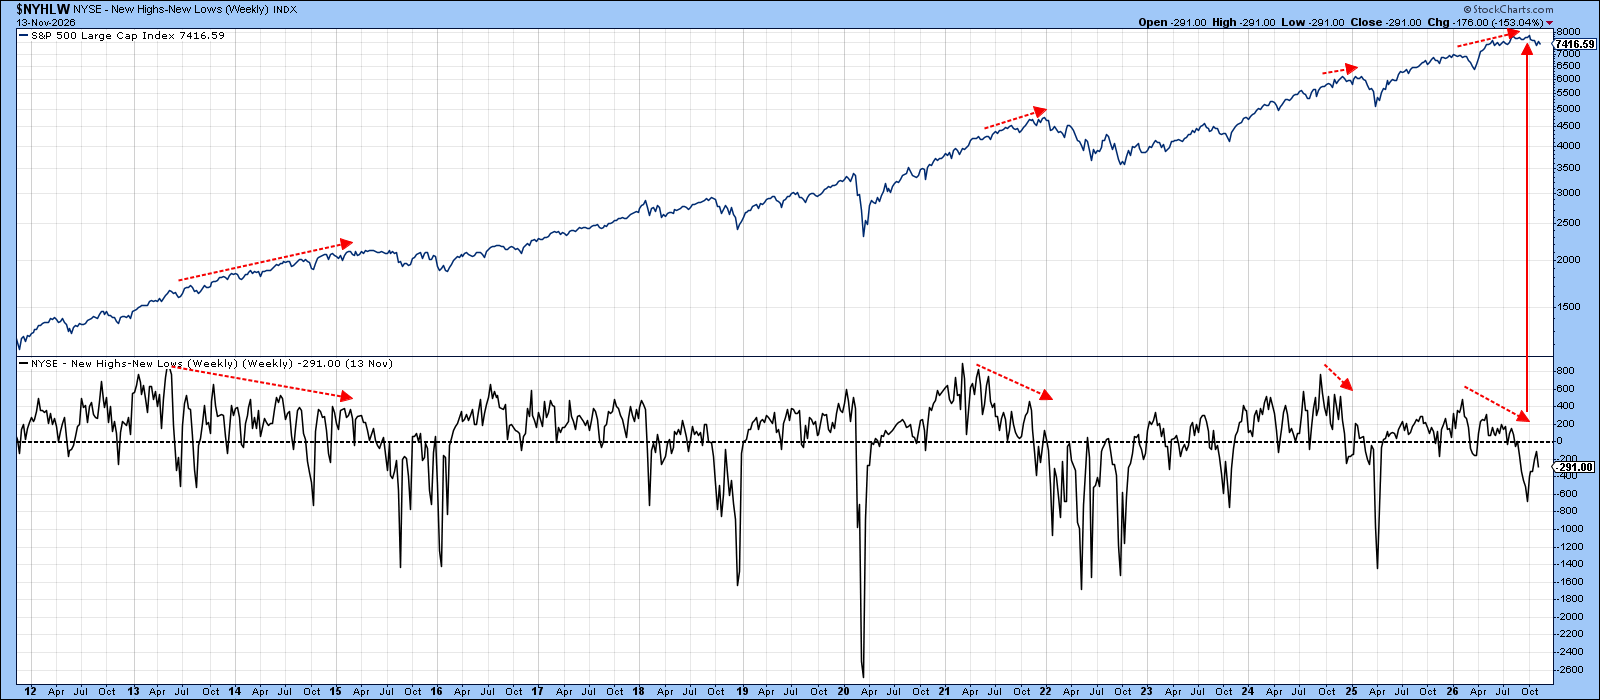
- Net new highs offer yet another way of assessing breadth. Chart 4 plots this indicator using weekly data. The red-dashed arrows identify previous divergences that were subsequently followed by market declines. Admittedly, a divergence alone offers little guidance regarding the magnitude or timing of the ensuing correction. Nevertheless, it’s noteworthy that, at the recent peak in the S&P 500, the number of stocks registering new highs was nonexistent. Moreover, the indicator itself peaked in late 2021 and has been tracing out a series of lower highs ever since. That represents a remarkably persistent and significant long-term divergence.
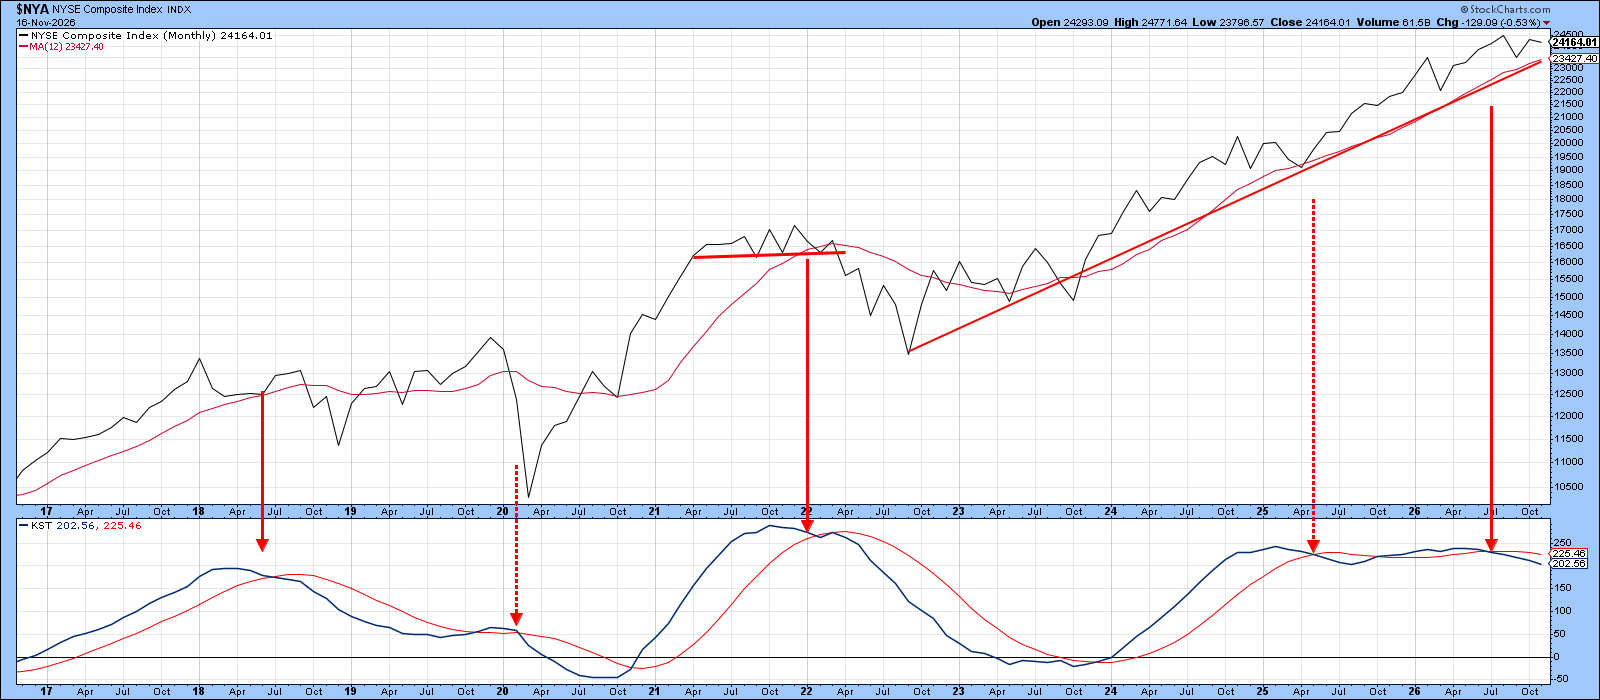
- Another characteristic frequently associated with major market tops is a deterioration in long-term momentum. This can take the form of negative divergences, trendline violations, completed momentum patterns, or reversals in smoothed long-term momentum indicators. At present, there’s little compelling evidence from these measures. However, the long-term KST for the S&P 500, NYSE Composite, and DJIA have all tentatively crossed below their respective nine-month moving averages. While these signals have yet to be fully confirmed, they represent an early warning that upside momentum is fading.
The Bottom Line
The current technical backdrop is certainly open to question and satisfies many criteria on our market-top checklist. Nevertheless, it’s important to recognize that none of these warnings have yet been confirmed by the price action of the major averages. For such confirmation to occur, we would typically need to see developments such as the downside completion of a major trading range, the violation of a long-term trendline, or a decisive break below the 12-month moving average. Until one or more of these events materialize, the evidence remains suggestive rather than conclusive.
Good luck and good charting,
Martin J. Pring
The views expressed in this article are those of the author and do not necessarily reflect the position or opinion of Pring Turner Capital Group of Walnut Creek or its affiliates. The Six Stages of the Business Cycle are followed each month in Martin Pring’s Intermarket Review.