Stocks Wobble as Oil Spikes: What the Charts Are Telling Investors

Key Takeaways
- Despite this week's volatility, the S&P 500 remains in a consolidation phase, holding above key support levels.
- Rising oil prices are weighing on industrials and transportation stocks.
- The longer-term uptrend is still intact, but investors should watch key support levels.
It’s been one of those weeks in the stock market that leaves many investors scratching their heads.
Stocks sold off early in the week, only to rebound as buyers stepped in. By Wednesday, it looked like investors believed geopolitical tensions may stay contained.
Then on Thursday, the narrative shifted again. Oil prices surged, stocks pulled back, and the safe havens like gold and bonds weakened. But in the final hour of trading, the selling pressure eased, and the major indexes began to climb, closing the day off its lows.
At times like this, the best thing investors can do is step away from the headlines and look at what the charts are telling us.
Is this week’s price action the start of something bigger?
The Big Picture: S&P 500 Still In an Uptrend
Let’s start by looking at the long-term picture. When you look at a 20-year monthly chart of the S&P 500 ($SPX), the long-term uptrend is still intact. Yes, the index has pulled back slightly, but overall, the uptrend hasn’t been broken.
On the five-year weekly chart, the pullback is more noticeable. Still, the index is trading above its 40-week Simple Moving Average (SMA). The 40-week SMA is the equivalent of the 200-day SMA. Many investors watch this level to gauge trend strength.
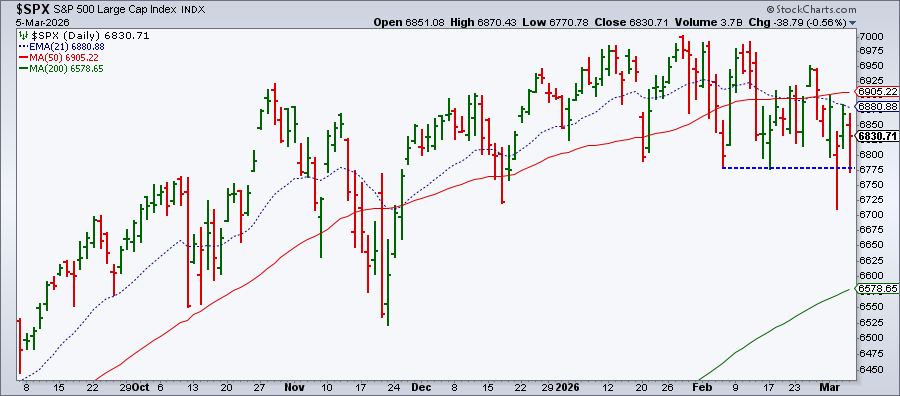
When we zero in further on the one-year daily chart of the S&P 500 below, what stands out is that the S&P 500 is still consolidating within its range. It’s holding above its February lows, which tells us that buyers are willing to step in and buy the dips. At the same time, the rallies don’t break above previous highs. The index isn’t making decisive moves in either direction.
Oil Is Sending a Message
If there’s one asset class that’s clearly displaying a directional move this week, it’s oil.
On Thursday, oil prices surged, briefly trading above $80 per barrel. Higher oil prices can riplle through the global economy. Fuel costs rise, which means higher gasoline prices for consumers, higher jet fuel costs for airlines, cruise ships, and shipping companies.
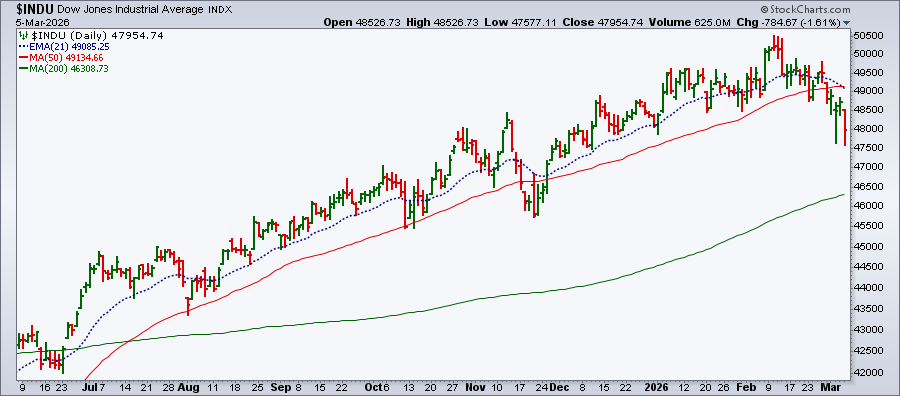
This is one reason the Dow Jones Industrial Average ($INDU) fell 1.61% on Thursday.
Looking at the long-term view, the Dow still looks stable. On a 20-year monthly chart, the uptrend is still intact. On the five-year weekly chart, the index is still above its 40-week SMA, which, as of this writing, is near 46,577. The Dow closed at 47,955 on Thursday.
Now look at the daily chart of the Dow Industrials. The index has slipped below its 50-day SMA, a level that is considered a short-term support level during uptrends. In addition, its 21-day Exponential Moving Average (EMA) has just crossed below its 50-day SMA.
Industrials Take a Hit
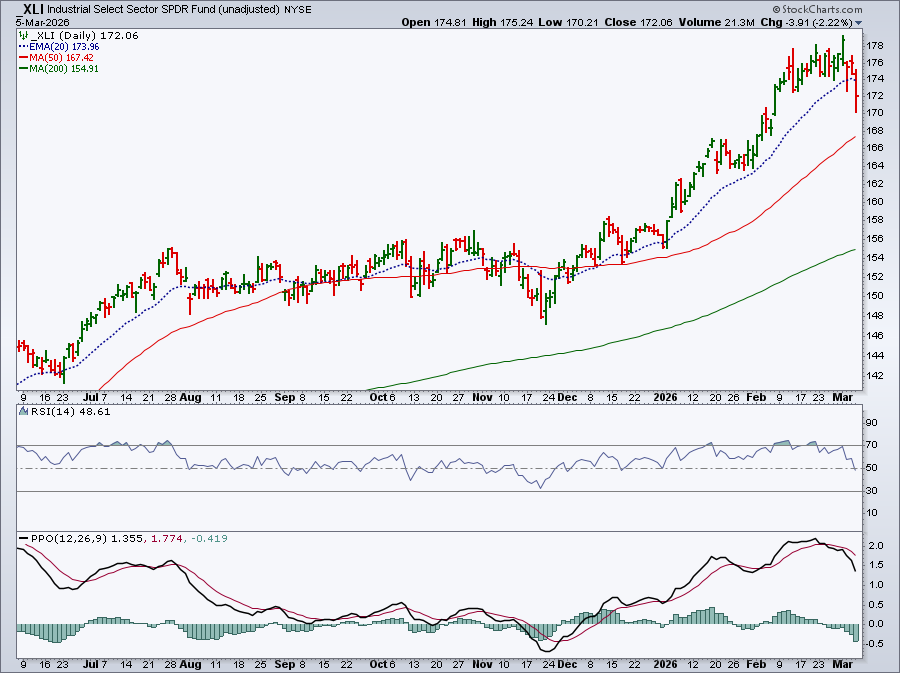
It’s not surprising that the Industrial Select Sector SPDR (XLI) was the worst-performing sector ETF of the day. On the daily chart, XLI slipped below its 21-day EMA. The Relative Strength Index (RSI) and Percentage Price Oscillator (PPO) show declining momentum.
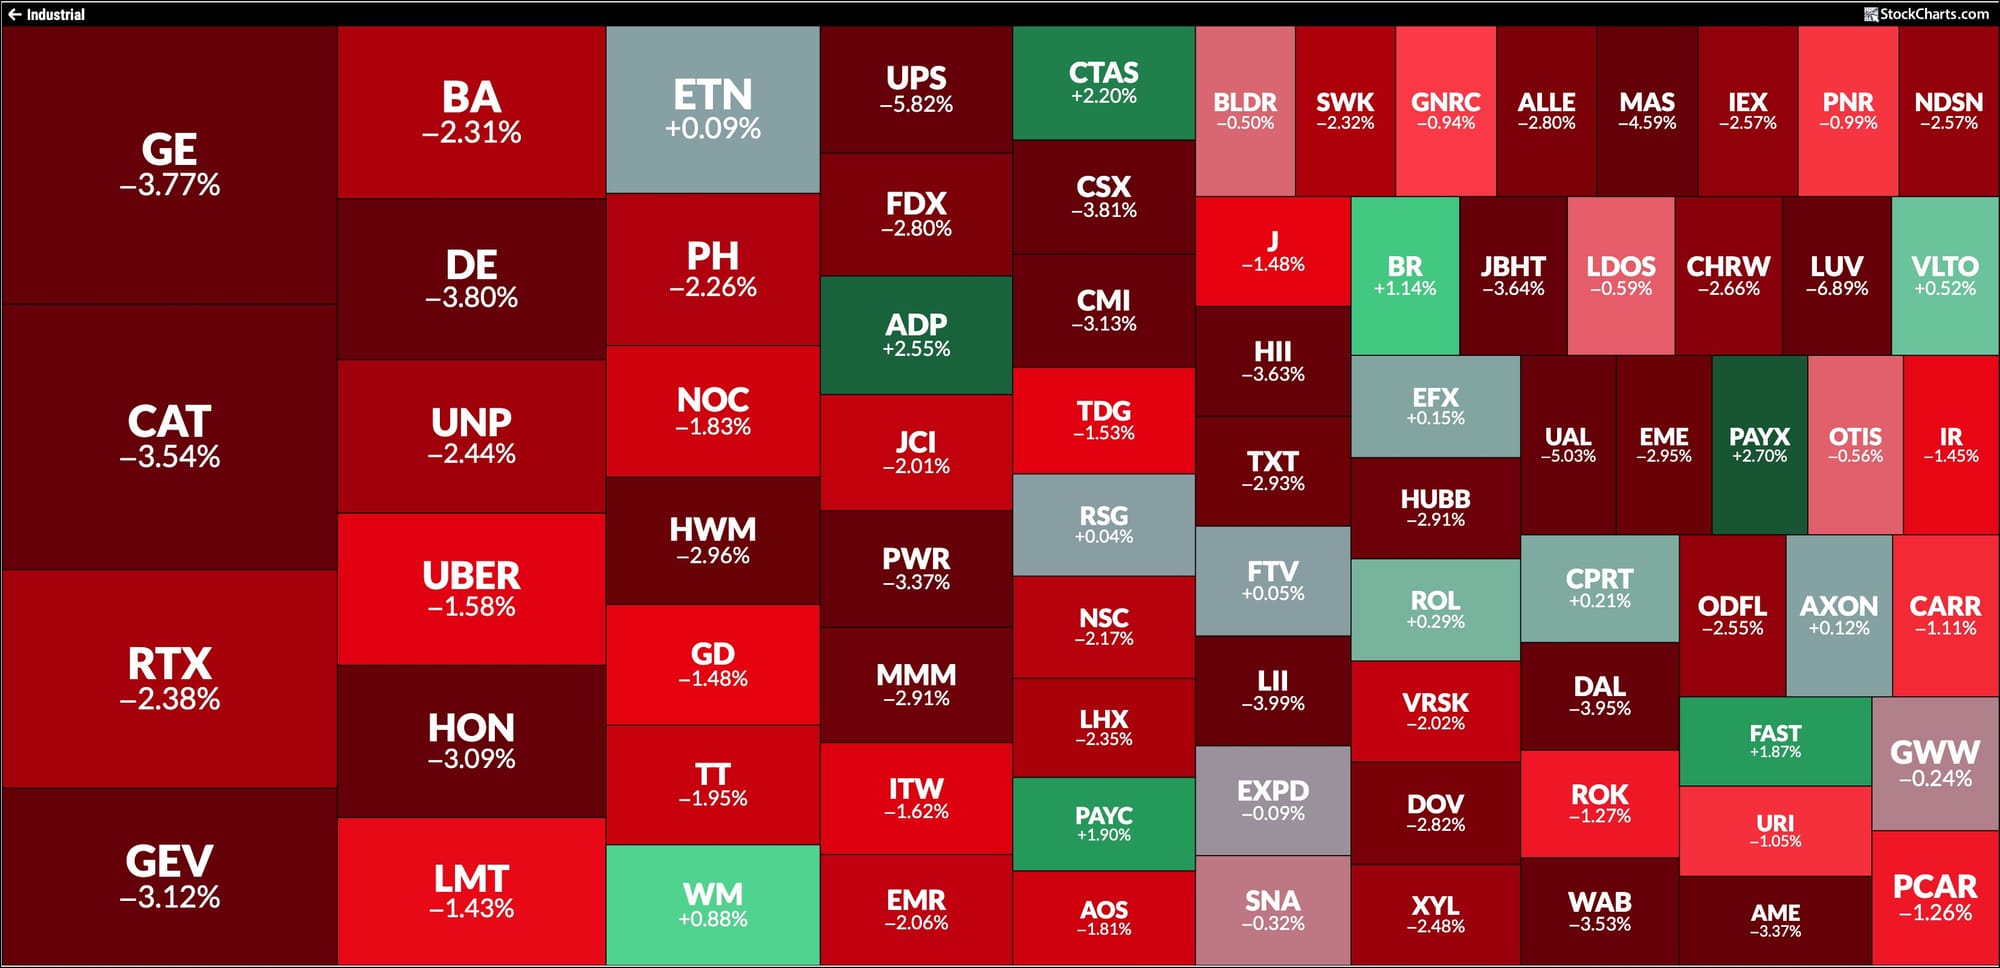
A quick look at the StockCharts MarketCarpets for the Industrial sector shows few green squares. Some of the big names, including General Electric (GE), Caterpillar (CAT), and RTX Corp. (RTX), were hit hard. Other industrial bellwethers such as Boeing (BA), Deere (DA), and several airline stocks also struggled.
Bottom Line
With tensions in the Middle East showing little sign of easing, investor fear is creeping higher. The Cboe Volatility Index ($VIX) closed above 23. If the conflict escalates further, oil prices could rise even higher, sending the VIX even higher.
Several developments could shape the stock market in the days ahead. Oil prices will, of course, remain in focus. Investors will also be watching whether the S&P 500 can hold its recent support levels. A break below those levels could shift the narrative.
With geopolitics front and center, Friday’s jobs report may not do much to move the needle. So far, we haven’t seen too much damage to equities, but a ranging market can get uncomfortable. This week reminded us that the market can change quickly. So, keep an eye on the charts and stay ahead.
Disclaimer: This blog is for educational purposes only and should not be construed as financial advice. The ideas and strategies should never be used without first assessing your own personal and financial situation, or without consulting a financial professional.