MEMBERS ONLY
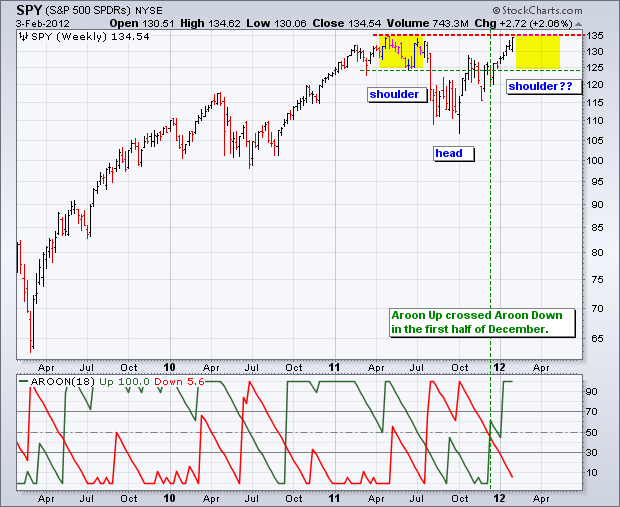
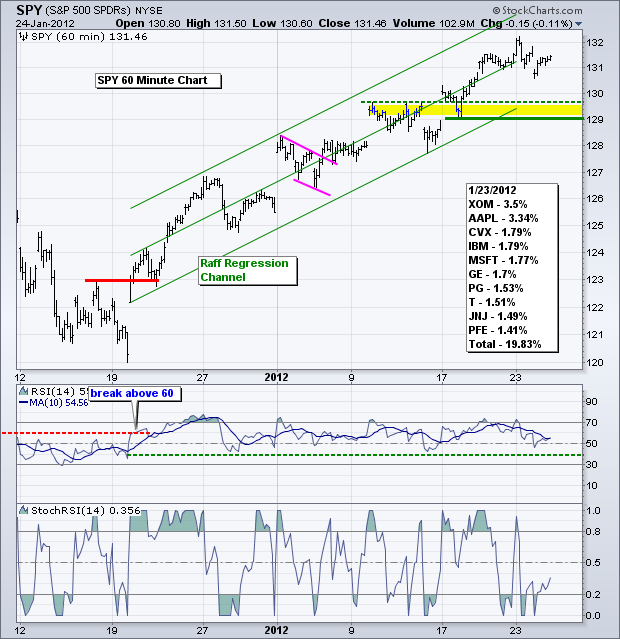
SPY CHALLENGES 2011 RESISTANCE WITH BIG WEEK
by Arthur Hill,
Chief Technical Strategist, TrendInvestorPro.com
With a string of positive economic reports lifting stocks this week, the S&P 500 ETF (SPY) closed higher for the fifth consecutive week. Friday was a big reporting day with Factory Orders showing strength, IWM Services indicating expansion and the employment rate coming down. These positive reports should...
READ MORE
MEMBERS ONLY
Finance Shows Green in the Market Cap Market Carpet
by Arthur Hill,
Chief Technical Strategist, TrendInvestorPro.com
As the Sector Market Carpet shows, the finance sector has the biggest average gain (2.4%) thus far on Friday. Technology is second with the average stock gaining 1.9% on the day. Notice that the boxes are different sizes because of market cap mode. Stocks with the highest market...
READ MORE
MEMBERS ONLY
NYSE AD Line Powers Market with Another New High
by Arthur Hill,
Chief Technical Strategist, TrendInvestorPro.com
There is no change in the indicator summary as all ten indicator groups remain in bull mode. The NYSE AD Line surged to yet another 52-week high and the Nasdaq AD Volume Line moved sharply higher the last six weeks. All nine Bullish Percent Indices are above 60% and seven...
READ MORE
MEMBERS ONLY
Oil Breaks Support as Stocks Remain Overbought
by Arthur Hill,
Chief Technical Strategist, TrendInvestorPro.com
And now for the Employment Report....and Factory Orders....and ISM Services. This is like the golden trio of economic reports. In one day we will cover employment, manufacturing and services. Stocks are overbought. Treasuries are at resistance and well above their late January lows. The Dollar is oversold after...
READ MORE
MEMBERS ONLY
Nordstrom Shows Relative Weakness as Bollinger Bands Narrow
by Arthur Hill,
Chief Technical Strategist, TrendInvestorPro.com
The stock market rallied in January, but Nordstrom (JWN) traded flat and shows relative weakness. Even though the stock has yet to break down, volatility is narrowing as the Bollinger Bands contract. Notice that Bollinger Band width is at its lowest in over six months. Watch the range for the...
READ MORE
MEMBERS ONLY
CAT Powers the Dow Higher
by Arthur Hill,
Chief Technical Strategist, TrendInvestorPro.com
According to the Wall Street Journal, "Caterpillar's 20% stock surge this month contributed nearly 34% of the Dow Jones Industrial Average's 415-point advance." As a price weighted "average" the highest priced issues in the Dow carry the most weight. This is also...
READ MORE
MEMBERS ONLY
SPY Holds Flag Breakout as TLT Backs off Resistance
by Arthur Hill,
Chief Technical Strategist, TrendInvestorPro.com
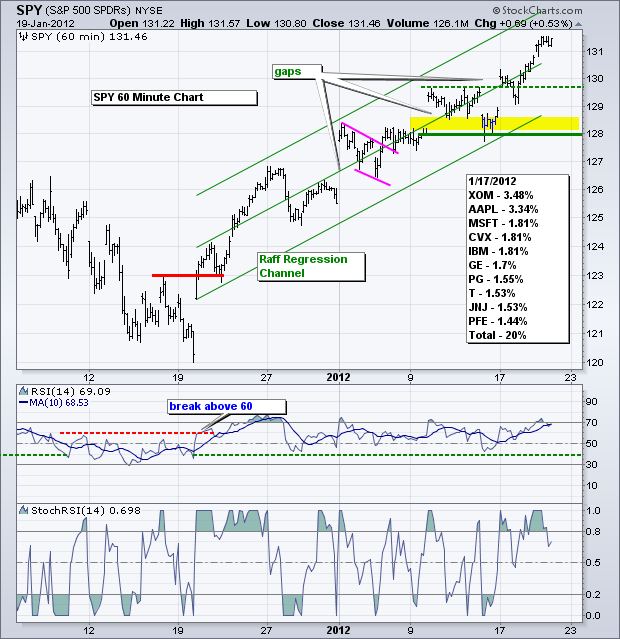
The first trading day of the month produced a relatively modest gain in the S&P 500 ETF, but big gains in the Russell 2000 ETF and S&P MidCap 400 SPDR. Stocks gapped up on the open and then consolidated above their gaps. Even though there was...
READ MORE
MEMBERS ONLY
Charts of Interest: AGN, AMX, CHH, CVH, IMN
by Arthur Hill,
Chief Technical Strategist, TrendInvestorPro.com
Careful out there. It is still earnings season.
AGN Forms Outside Reversal at Resistance.
CHH Forms Bearish Wedge and Bearish Engulfing.
IMN Traces out Ascending Triangle.
Plus AMX and CVN
This commentary and charts-of-interest are designed to stimulate thinking. This analysis is not a recommendation to buy, sell, hold or...
READ MORE
MEMBERS ONLY
SPY Holds Support as TLT Nears Big Resistance Tests
by Arthur Hill,
Chief Technical Strategist, TrendInvestorPro.com
The intermarket arena shows a shift from risk-on to risk-off over the last six to seven days. The 20+ Year T-Bond ETF (TLT) and the Gold SPDR (GLD) are up over 4%, while the US Oil Fund (USO) and the S&P 500 ETF (SPY) are down slightly. The...
READ MORE
MEMBERS ONLY
Electronic Arts Bounces off Support with Bullish Engulfing
by Arthur Hill,
Chief Technical Strategist, TrendInvestorPro.com
Electronic Art (ERTS) declined to the August low in mid January and then firmed the last two weeks. A bullish engulfing formed on Friday as the stock opened weak and closed strong. ERTS follow up on this pattern with a breakout on above average volume. The trend since November remains...
READ MORE
MEMBERS ONLY
Oil ETF Forms Bull Flag as Dollar Remains in Downtrend
by Arthur Hill,
Chief Technical Strategist, TrendInvestorPro.com
Stocks corrected somewhat over the last three days, but managed to recover after a weak open on Monday. Risk-on is in the air this morning after the EU agreed to a "fiscal compact". Stocks futures, oil, gold and the Euro are higher in early trading (4AM ET). On...
READ MORE
MEMBERS ONLY
Charts of Interest: ARO, ATVI, CERN, NBR, NTAP, PTEN, VIP
by Arthur Hill,
Chief Technical Strategist, TrendInvestorPro.com
Care out there. It is still earnings season.
ARO Consolidates after Triangle Breakout.
CERN Firms at Key Retracement.
NBR Bounces off Triangle Support.
Plus ATVI, NTAP, PTEN and VIP.
This commentary and charts-of-interest are designed to stimulate thinking. This analysis is not a recommendation to buy, sell, hold or sell...
READ MORE
MEMBERS ONLY
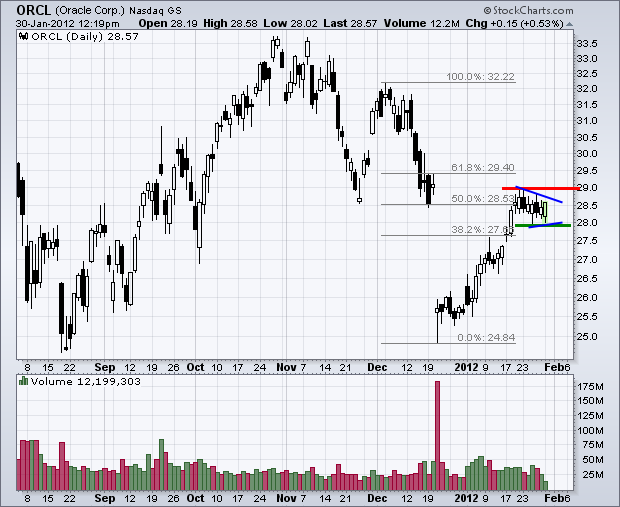
Oracle Stalls at Key Retracement
by Arthur Hill,
Chief Technical Strategist, TrendInvestorPro.com
Oracle (ORCL) surged back above 28 this month, but stalled the last few weeks as resistance came into play. First, notice that broken support turns resistance around 28.50. Second, the stock retraced 50-61.80% of the prior decline. A pennant formed the last two weeks and traders should watch...
READ MORE
MEMBERS ONLY
Stocks Remain Overbought as Treasuries Challenge Resistance
by Arthur Hill,
Chief Technical Strategist, TrendInvestorPro.com
Even though the short-term uptrends remain in place, the major index ETFs are overbought and ripe for a correction. Corrections can evolve as pullbacks or sideways trading ranges. A pullback that retraces around 50% of the prior advance (19-Dec to 26-Jan) might be playable for a short-term trader. A sideways...
READ MORE
MEMBERS ONLY
Spot Light Crude Forms Bull Wedge
by Arthur Hill,
Chief Technical Strategist, TrendInvestorPro.com
Spot Light Crude ($WTIC) surged above 100 in the second half of December and then formed a falling wedge in January. A decline in oil is unusual because the Dollar is down over the last few weeks and stocks are up. A move above 102 would break wedge resistance and...
READ MORE
MEMBERS ONLY
Indicator Summary Hits +10 as Small-Cap Performance Perks Up
by Arthur Hill,
Chief Technical Strategist, TrendInvestorPro.com
With one more upgrade, all ten indicator groups are in bull mode. Relative performance of small-caps was the lagging indicator, but small-cap performance perked up this month as the $RUT:$OEX ratio broke above its December highs. Even though stocks look short-term and medium-term overextended, there are simply no signs...
READ MORE
MEMBERS ONLY
SPY Remains in an Uptrend and Overbought
by Arthur Hill,
Chief Technical Strategist, TrendInvestorPro.com
Stocks opened strong and then sold off to close with small losses. A little pop and drop is normal with the stock market so overbought. Even so, selling pressure was not that strong and the short-term uptrends remain in place. All sectors were lower with energy leading the way (-1....
READ MORE
MEMBERS ONLY
Regional Bank SPDR Forms Big Bearish Engulfing
by Arthur Hill,
Chief Technical Strategist, TrendInvestorPro.com
With stocks opening strong and then moving sharply lower, the intraday bearish engulfing scan is filling up quite quickly. Of note, the Regional Bank SPDR (KRE) has a bearish engulfing in play on Thursday afternoon. In fact, notice how the ETF pretty much engulfed the last 11 days of trading...
READ MORE
MEMBERS ONLY
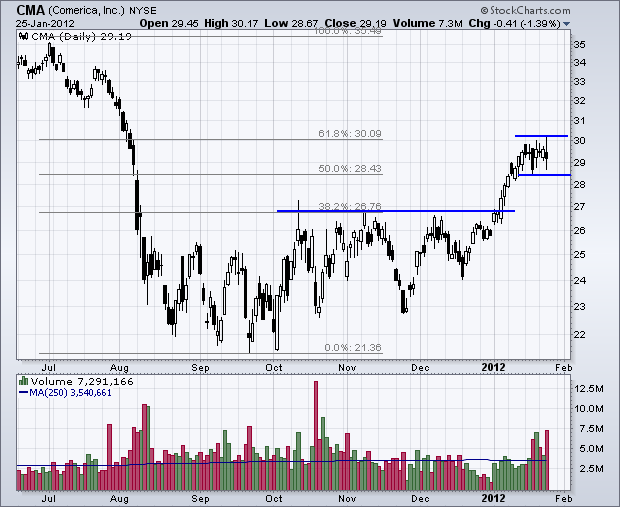
Charts of Interest: CMA, JCP, JWN, SSP, UIS, WHR
by Arthur Hill,
Chief Technical Strategist, TrendInvestorPro.com
CMA Stalls at Key Retracement.
SSP Consolidates with Triangle Formation.
UIS Bounces off Key Retracement with High Volume.
Plus JPC, JWN, WHR
This commentary and charts-of-interest are designed to stimulate thinking. This analysis is not a recommendation to buy, sell, hold or sell short any security (stock ETF or otherwise)...
READ MORE
MEMBERS ONLY
Stocks Surge and Bonds Fail after Fed Statement
by Arthur Hill,
Chief Technical Strategist, TrendInvestorPro.com
There is nothing like a little Fed frenzy. Stocks surged after the Fed announced an extension of their zero interest rate policy. Treasuries surged ahead of the statement, but gave it all back afterwards. The Dollar fell sharply and commodities surged in the afternoon. Gold was the standout winner with...
READ MORE
MEMBERS ONLY
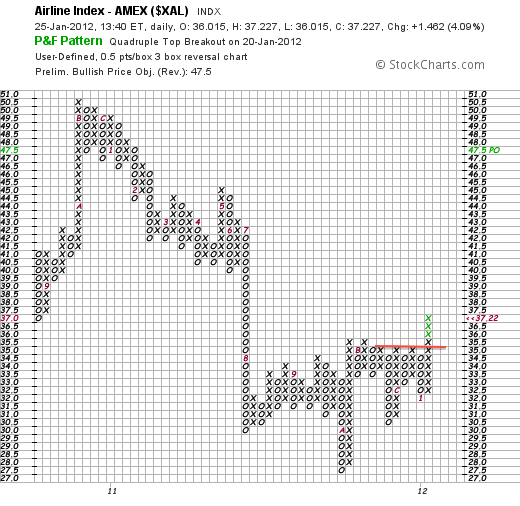
Amex Airline Index Forges Quadruple Top Breakout on P&F Chart
by Arthur Hill,
Chief Technical Strategist, TrendInvestorPro.com
The Amex Airline Index ($XAL) lagged the market throughout 2011, but may be poised to lead with a breakout in 2012. The P&F chart below is a classic three box reversal chart with each box representing 50 cents. Notice that the current X-Column broke above the last three...
READ MORE
MEMBERS ONLY
Trading Turns Indecisive Ahead of the Fed
by Arthur Hill,
Chief Technical Strategist, TrendInvestorPro.com
Another blowout quarter from Apple is lifting the Nasdaq futures this morning, but the rest of the market is rather subdued as the Fed's policy statement looms this afternoon. Stocks ended mixed on Tuesday as indecision continued ahead of the Fed. Small-caps were higher with the Russell 2000...
READ MORE
MEMBERS ONLY
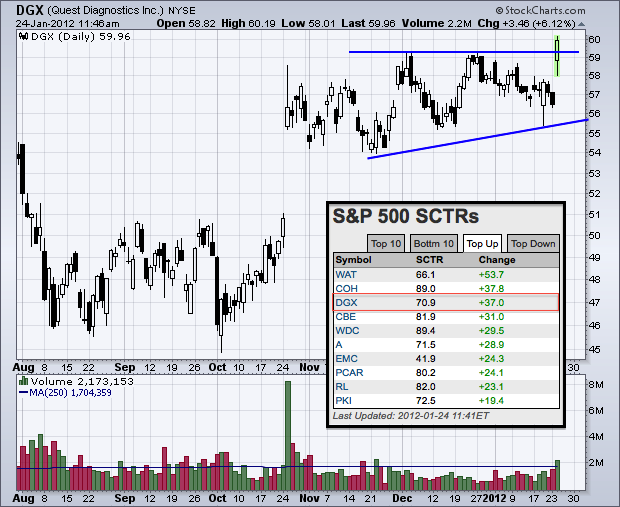
Quest Diagnostics Breaks Resistance with SCTR Surge
by Arthur Hill,
Chief Technical Strategist, TrendInvestorPro.com
A look at the StockCharts Technical Rank (SCTR) movers shows Quest Diagnostics with a big move (+37) on Tuesday. On the price chart, DGX broke ascending triangle resistance with a surge in volume today.
Click this chart for a live image...
READ MORE
MEMBERS ONLY
Stocks Turn Indecisive as TLT Breaks Support
by Arthur Hill,
Chief Technical Strategist, TrendInvestorPro.com
It is another big day on the earnings front. McDonalds, Baker Hughes and Air Products report before the open. Apple, Altera, AMD and Yahoo report after the market close. In addition to a big earnings week, we have EU debt wrangling, rumors on Portugal and a FOMC meeting. The US...
READ MORE
MEMBERS ONLY
Charts of Interest: ATVI, FST, GFI, GT, LLY, MMM
by Arthur Hill,
Chief Technical Strategist, TrendInvestorPro.com
Careful out there during earnings season.
ATVI Declines on High Volume
GFI Consolidates Near Wedge Breakout.
GT Forms Pennant after Sharp Decline.
Plus FST,GFI, LLY, MMM...
READ MORE
MEMBERS ONLY
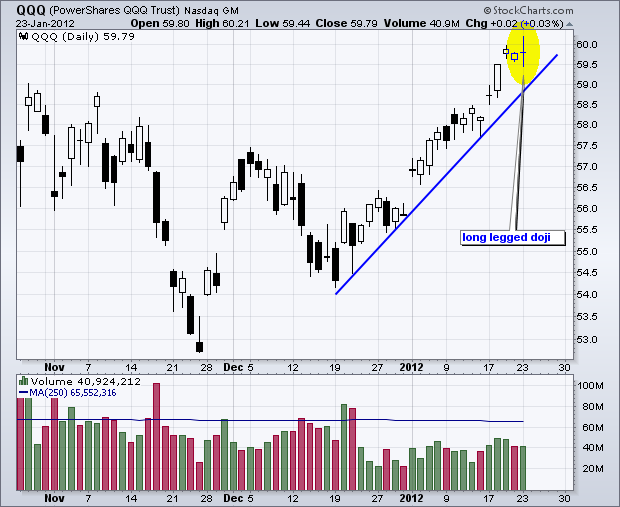
QQQ Forms Long Legged Doji
by Arthur Hill,
Chief Technical Strategist, TrendInvestorPro.com
QQQ opened flat, surged, dipped and then recovered to close basically unchanged on the day. As a result, the ETF formed a long legged doji, which shows indecision on the day. Overall, the trend remains up as the ETF holds above the December trendline. A break below this trendline would...
READ MORE
MEMBERS ONLY
SPY hits New High and GLD Breaks Triangle Resistance
by Arthur Hill,
Chief Technical Strategist, TrendInvestorPro.com
It could be a volatile week, but what else is new. EU finance ministers are meeting to discuss the Greek debt situation because Greece is facing a large rollover in March. The Fed meets on Tuesday-Wednesday with a policy statement expected on Wednesday afternoon. Red-hot housing stocks will be in...
READ MORE
MEMBERS ONLY
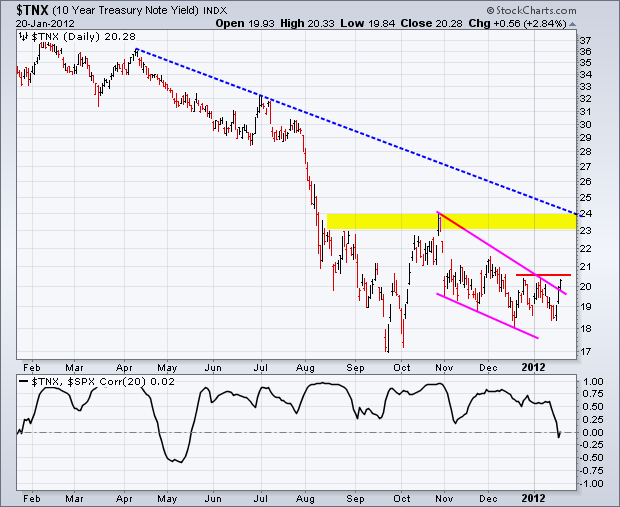
Treasury Yields Surge ahead of Fed Meeting
by Arthur Hill,
Chief Technical Strategist, TrendInvestorPro.com
The FOMC meets next Tuesday-Wednesday and will make its policy statement Wednesday afternoon. With stocks surging and recent economic reports buoyant, the bond market may be looking ahead to this meeting with trepidation. The first chart shows the 10-year Treasury Yield ($TNX) rising sharply the last three day. Treasury bonds...
READ MORE
MEMBERS ONLY
DJ Ireland Index Breaks 2011 Highs
by Arthur Hill,
Chief Technical Strategist, TrendInvestorPro.com
While the German DAX Index ($DAX) and the French CAC Index ($CAC) languish well below their 2011 highs, the DJ Ireland Index ($IEDOW) shows strength with a break above its highs. Ireland was one of the first countries to get into trouble, but it appears that the tough medicine is...
READ MORE
MEMBERS ONLY
Indicator Summary Continues to Strengthen
by Arthur Hill,
Chief Technical Strategist, TrendInvestorPro.com
With two more upgrades, the indicator summary is now at plus nine. The only indicator not bullish is the $RUT:$OEX ratio because it has yet to convincingly break resistance. Small-caps are lagging a bit, but this could also be due to above-average strength in financial large-caps the last few...
READ MORE
MEMBERS ONLY
Stocks Forge New Highs for 2012 as Treasuries Fall
by Arthur Hill,
Chief Technical Strategist, TrendInvestorPro.com
Bank and tech earnings were largely positive on Thursday and stocks moved higher. Today we will hear from Schlumberger and General Electric, which will impact oil services and industrials. Stocks extended their gains on Thursday as the major index ETFs notched new highs for this short-term uptrend. The absolute gains...
READ MORE
MEMBERS ONLY
Medical Devices iShares Challenges Late Summer High
by Arthur Hill,
Chief Technical Strategist, TrendInvestorPro.com
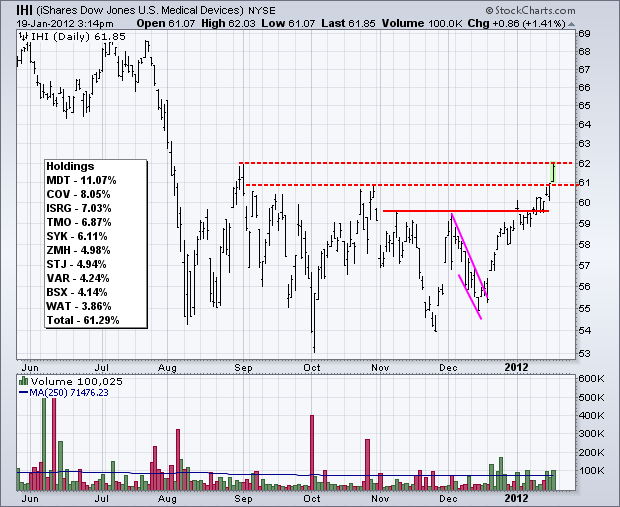
The Medical Devices iShares (IHI) has been moving higher since mid December and is now challenging its late summer high. Also notice that upside volume picked up over the last 4-5 weeks. While a breakout would be bullish, the ETF is getting overbought after a 13+ percent advance off its...
READ MORE
MEMBERS ONLY
Oil Underperforms Stock Market as Techs Surge
by Arthur Hill,
Chief Technical Strategist, TrendInvestorPro.com
It is a big day on the earnings front. Judging from the rally over the last 4-5 weeks, it looks like most reports will be better than expected. Financials dominate the premarket reports with Bank of America, BB&T and Morgan Stanley reporting earnings before the open on Thursday....
READ MORE
MEMBERS ONLY
Charts of Interest: ATML, COV, GFI, HES, SLB, TIBX
by Arthur Hill,
Chief Technical Strategist, TrendInvestorPro.com
Careful out there. It is earnigns season.
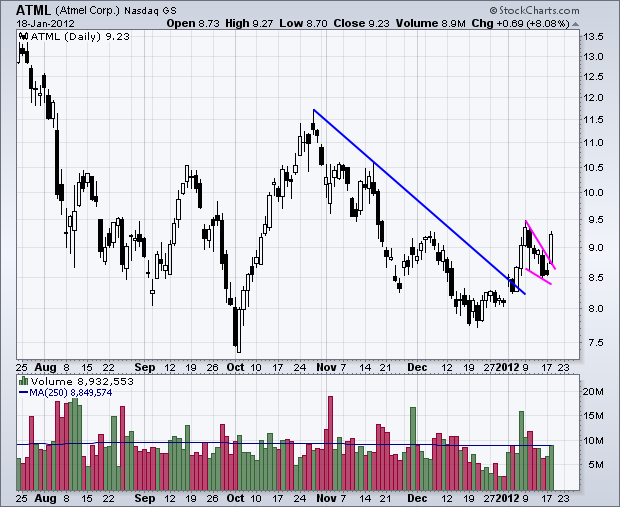
ATML Surges above Wedge Resistance.
GFI Gaps above late December High.
SLB Forges Outside Reversal Day on Big Volume.
This commentary and charts-of-interest are designed to stimulate thinking. This analysis is not a recommendation to buy, sell, hold or sell short any security...
READ MORE
MEMBERS ONLY
Semis Perk Up to Lead Technology Sector
by Arthur Hill,
Chief Technical Strategist, TrendInvestorPro.com
Stocks were largely higher on Wednesday with the technology sector leading the way. As the Sector Market Carpet shows, three of the top five performers in the technology sector come semiconductor group: Linear Tech (LLTC), Altera (ALTR) and Texas Instruments (TXN).
Click this chart for a live image...
READ MORE
MEMBERS ONLY
QQQ Gaps Up and Holds its Gains
by Arthur Hill,
Chief Technical Strategist, TrendInvestorPro.com
The short-term uptrend for the S&P 500 ETF (SPY) began with the breakout on December 20th and is now entering its 19th day, which is pretty long for a short-term uptrend. Also note that the ETF is up around 8% from its December 19th low. For now, the...
READ MORE
MEMBERS ONLY
Banks and Biotechs Lead Industry Group PerfChart in 2012
by Arthur Hill,
Chief Technical Strategist, TrendInvestorPro.com
John Murphy's industry group PerfChart shows the Banking Index ($BKX) and the Biotech Index ($BTK) leading the market higher with the biggest gains. Also note that the Gold and Silver Index ($XAU) and the Broker Dealer Index ($XBD) are strong this year.
Click this chart for a live...
READ MORE
MEMBERS ONLY
SPY Holds Uptrend as TLT Surges to Resistance
by Arthur Hill,
Chief Technical Strategist, TrendInvestorPro.com
Rumors that Standard & Poor's was going to downgrade the debt rating for several EU countries sent stocks sharply lower on the open Friday morning. Stocks remained down as rumors swirled, but did not add to their losses. The news finally hit at 3PM ET and stocks edged...
READ MORE
MEMBERS ONLY
Charts: ADM, ADSK, AMZN, ASEI, EQR, NE, PCLN, TKC, VLO
by Arthur Hill,
Chief Technical Strategist, TrendInvestorPro.com
ASEI Recovers on Strong Volume.
EQR Forms Bullish Engulfing on High Volume.
NE Surges off Consolidation Support. |
Plus ADM, ADSK, AMZN, EQR, PCLN, TKC, VLO
This commentary and charts-of-interest are designed to stimulate thinking. This analysis is not a recommendation to buy, sell, hold or sell short any security (stock...
READ MORE
MEMBERS ONLY
Gasoline Stalls after Breakout
by Arthur Hill,
Chief Technical Strategist, TrendInvestorPro.com
Spot Unleaded Gasoline ($GASO) found support in the 2.45-2.50 area from September to December and then broke resistance with a surge the last three weeks. The breakout is holding, but $GASO stalled this week and fell rather sharply on Thursday. A move back below 2.62 would negate...
READ MORE