MEMBERS ONLY
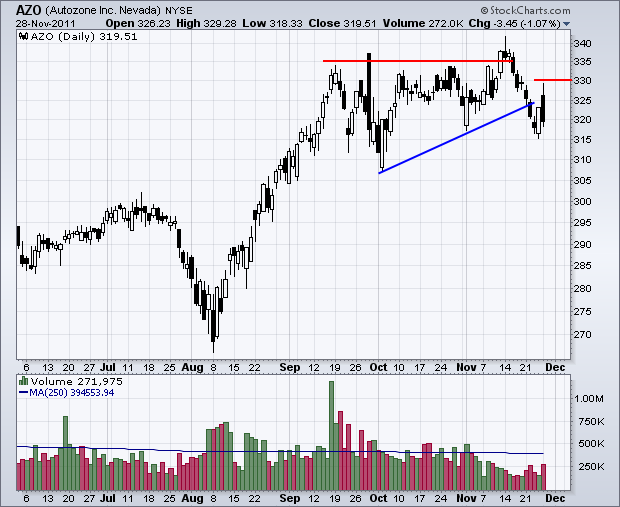
Charts of Interest: AZO, DDS, LH, SUN, TGT
by Arthur Hill,
Chief Technical Strategist, TrendInvestorPro.com
DDS Forms Pennant after Sharp Decline.
LH Challenges Flag Resistance.
SUN Gaps above Wedge Resistance.
Plus AZO and TGT.
This commentary and charts-of-interest are designed to stimulate thinking. This analysis is not a recommendation to buy, sell, hold or sell short any security (stock ETF or otherwise). We all need...
READ MORE
MEMBERS ONLY
Oil and Gasoline ETFs Diverge
by Arthur Hill,
Chief Technical Strategist, TrendInvestorPro.com
The indicator window shows the US Gasoline Fund (UGA) peaking in mid October (blue) and moving lower the last six weeks, while the US Oil Fund (USO) continued moving higher (red). Something needs to give here. Notice that UGA formed a large descending triangle the last 5-6 months and a...
READ MORE
MEMBERS ONLY
Stocks and Euro Poised for Oversold Bounce
by Arthur Hill,
Chief Technical Strategist, TrendInvestorPro.com
Stock futures are trading sharply higher on news (rumors) of an Italian bailout. Also note that it is a big week on the economic front. See the listing of economic reports further down in this commentary. Market moving rumors and innuendo are all part of the game these days. Traders...
READ MORE
MEMBERS ONLY
Wal-Mart Moves into Narrow Range as Black Friday Hits
by Arthur Hill,
Chief Technical Strategist, TrendInvestorPro.com
Wal-Mart (WMT) remains in an uptrend overall, but may be poised for a correction as Black Friday comes and goes. The stock declined sharply in mid November and then consolidated the last 6-7 days. Watch for a break from this consolidation to trigger the next signal.
Click this chart for...
READ MORE
MEMBERS ONLY
Broken Support Turns First Resistance for German DAX
by Arthur Hill,
Chief Technical Strategist, TrendInvestorPro.com
After forming a rising wedge in October, the German DAX reversed in the key retracement zone and broke support with a sharp decline below 5700 the last few days. These are clearly bearish developments. Broken support in the 5800 area turns first resistance, which is confirmed by the trendline extending...
READ MORE
MEMBERS ONLY
Indicator Summary Turns Negative as Breakouts Fail
by Arthur Hill,
Chief Technical Strategist, TrendInvestorPro.com
Monday's sharp decline was enough to trigger a slew of downgrades in the indicator summary. I noted on Friday that the indicator was already looking vulnerable and it would not take much to tilt the balance back to the bears. Monday's big decline marked the fifth...
READ MORE
MEMBERS ONLY
Stocks Consolidate as Treasuries Stay Strong
by Arthur Hill,
Chief Technical Strategist, TrendInvestorPro.com
The stock market can fall simply from a lack of buying pressure. In other words, it does not always take an increase in selling pressure to produce a decline. It is pretty easy to come up with reasons not to buy. The major index ETFs broke support levels with sharp...
READ MORE
MEMBERS ONLY
Only a Handful of Stocks are Up the last Five Days
by Arthur Hill,
Chief Technical Strategist, TrendInvestorPro.com
There have been few hiding places over the last five trading days. The major indices are down sharply and all sectors are also down. As the Sector Market Carpet shows, stocks in the utilities and consumer staples sectors were down the least, while technology and energy stocks were down the...
READ MORE
MEMBERS ONLY
SPY Becomes Oversold as TLT Becomes Overbought
by Arthur Hill,
Chief Technical Strategist, TrendInvestorPro.com
With the major index ETFs down 5-6% in the last six trading days, the market is short-term oversold and this could pave the way for a consolidation or oversold bounce. Trading could also get real tricky as volume dries up for the Thanksgiving holiday and the potential news flow rattles...
READ MORE
MEMBERS ONLY
Charts of Interest: ALTR, IR, M, NVDA, URBN, WDC
by Arthur Hill,
Chief Technical Strategist, TrendInvestorPro.com
NVDA Buck the Market with Big Surge.
URBN Firms with Falling Wedge.
WDC Forms Harami with two Inside Days.
Plus ALTR, IR and M.
This commentary and charts-of-interest are designed to stimulate thinking. This analysis is not a recommendation to buy, sell, hold or sell short any security (stock ETF...
READ MORE
MEMBERS ONLY
All 30 Dow Stocks Moving Lower
by Arthur Hill,
Chief Technical Strategist, TrendInvestorPro.com
The CandleGlance chart for the 30 Dow stocks provides snapshot of the current day's action. As of 12:30ET on Monday, all 30 components were down with most down over 2%. This is clearly a broad-based decline that is affecting all sectors. The screenshot below shows the four...
READ MORE
MEMBERS ONLY
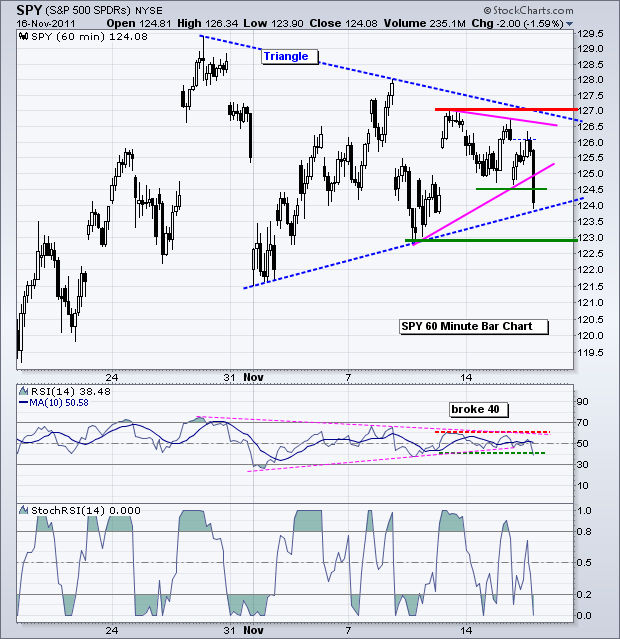
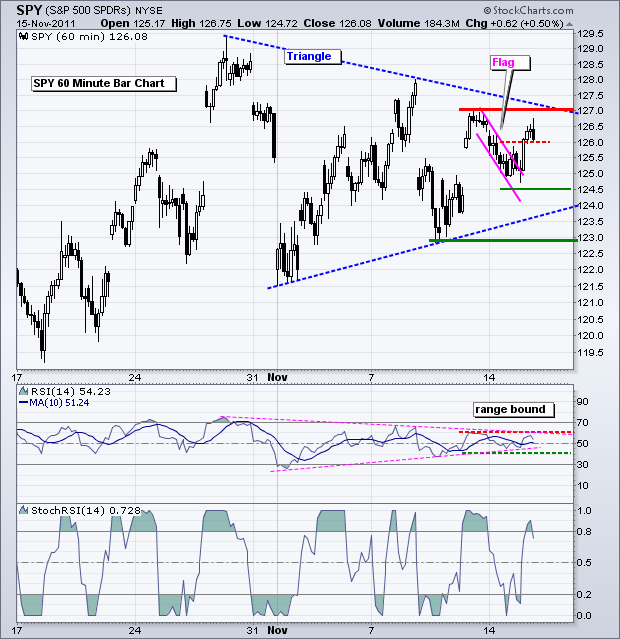
SPY Forms Pennant as TLT Holds Breakout
by Arthur Hill,
Chief Technical Strategist, TrendInvestorPro.com
The risk-off trade remains the flavor of the month. Stocks broke down last week as the Dollar and Treasuries moved to their highest levels for November. The S&P 500 ETF (SPY) broke triangle support with a sharp decline on Wednesday-Thursday and then consolidated on Friday with a pennant...
READ MORE
MEMBERS ONLY
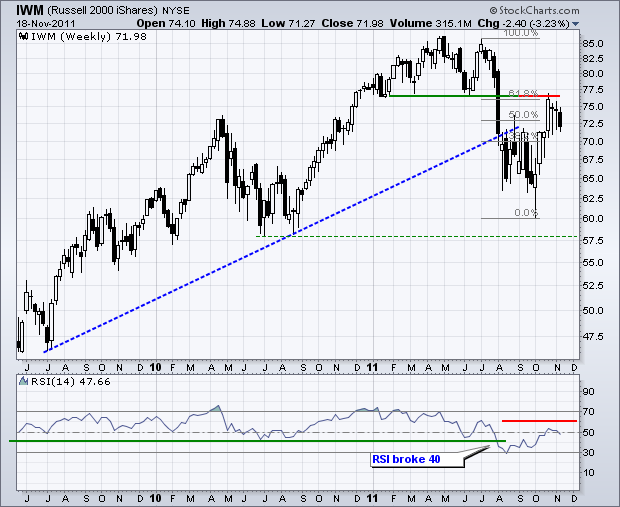
Russell 2000 ETF Hits Big Resistance
by Arthur Hill,
Chief Technical Strategist, TrendInvestorPro.com
A number of bearish developments have emerged on the weekly chart for the Russell 2000 ETF (IWM). This weekly chart extends two and a half years to cover the long-term situation. First, the ETF broke support with a sharp decline in August and then exceeded the July 2009 trendline. Second,...
READ MORE
MEMBERS ONLY
Bollinger Bands Narrow for Procter & Gamble
by Arthur Hill,
Chief Technical Strategist, TrendInvestorPro.com
After a sharp decline and gap down, Procter & Gamble (PG) moved into a tight trading range the last three weeks. The pink lines show a pennant or small triangle taking shape. The blue lines show Bollinger Bands (10,2) narrowing as well. A break below the lower band would...
READ MORE
MEMBERS ONLY
Indicator Summary is Still Positive, but Looks Vulnerable
by Arthur Hill,
Chief Technical Strategist, TrendInvestorPro.com
Even though there is no change in the indicator summary, it would not take much to tilt the balance back to the bears. With this week's sharp decline, the major index ETFs are on the verge of support breaks that would question the October breakouts. Support breaks in...
READ MORE
MEMBERS ONLY
Breakouts in TLT and UUP Show a Return to Risk-off
by Arthur Hill,
Chief Technical Strategist, TrendInvestorPro.com
The risk-off trade took center stage on Thursday. Treasuries and the Dollar were higher, while stocks, commodities and the Euro were lower. Gold followed the stock market again. The S&P 500 ETF (SPY) broke triangle support with a sharp decline over the last two days. After a sharp...
READ MORE
MEMBERS ONLY
Techs and Finance Lead Lower in Market Carpet
by Arthur Hill,
Chief Technical Strategist, TrendInvestorPro.com
The Market Carpet is a sea of red on Thursday with the technology and finance sectors leading the way lower. Notice the numbers in the top box of each sector. The average tech stock is down 2.8% and the average finance stock is down 2.2% (just before the...
READ MORE
MEMBERS ONLY
SPY Breaks Support with Triangle as TLT Challenges Resistance
by Arthur Hill,
Chief Technical Strategist, TrendInvestorPro.com
With the US Dollar Fund (UUP) hitting its highest level of the month and the 20+ year Bond ETF (TLT) on the verge of a breakout, it is little wonder stocks finally succumbed to some selling pressure. Also note that $LIBOR continues to rise and the Finance SPDR (XLF) continues...
READ MORE
MEMBERS ONLY
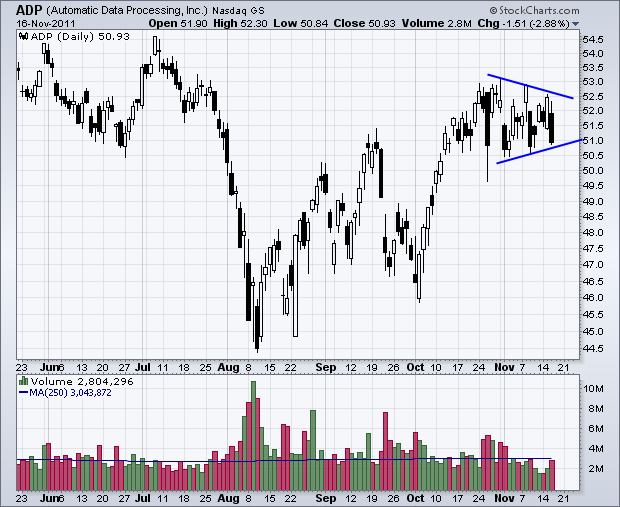
Charts of Interest: ADP, AMZN, CTAS, INTU, JDSU, MON, SYMC
by Arthur Hill,
Chief Technical Strategist, TrendInvestorPro.com
AMZN Forms Rising Wedge in Gap Zone.
The Triangle Noose Tightens for CTAS.
SYMC Consolidates after Sharp Decline.
Plus ADP, INTU, JDSU, MON
This commentary and charts-of-interest are designed to stimulate thinking. This analysis is not a recommendation to buy, sell, hold or sell short any security (stock ETF or...
READ MORE
MEMBERS ONLY
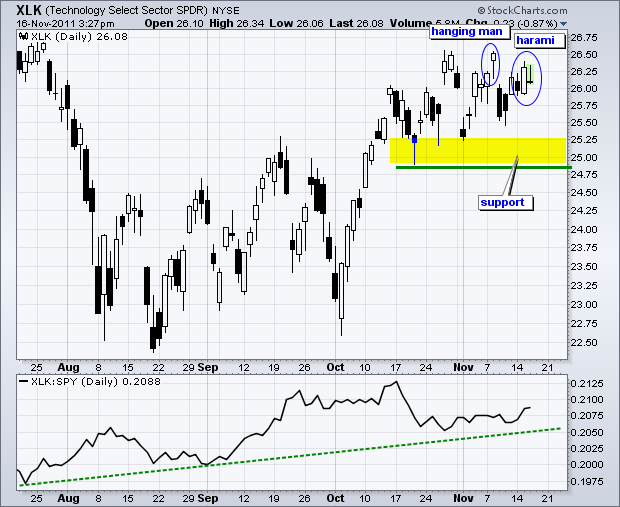
A Hanging Man and a Harami for XLK
by Arthur Hill,
Chief Technical Strategist, TrendInvestorPro.com
The Technology SPDR (XLK) is hitting resistance from the late October high with a Hanging Man last week and a Harami this week. Both candlesticks are bearish reversal patterns. The Hanging Man was confirmed with a gap down and long black candlestick, but the ETF quickly bounced back above 26....
READ MORE
MEMBERS ONLY
SPY Remains Rangebound as UUP and TLT Strengthen
by Arthur Hill,
Chief Technical Strategist, TrendInvestorPro.com
Even though the Euro and Treasuries surged off support over the last two days, stocks are holding up and oil remains near $100. It is a paradox and something needs to give here. Strength in Treasuries and the Dollar is tied to the risk-off trade, while strength in stocks and...
READ MORE
MEMBERS ONLY
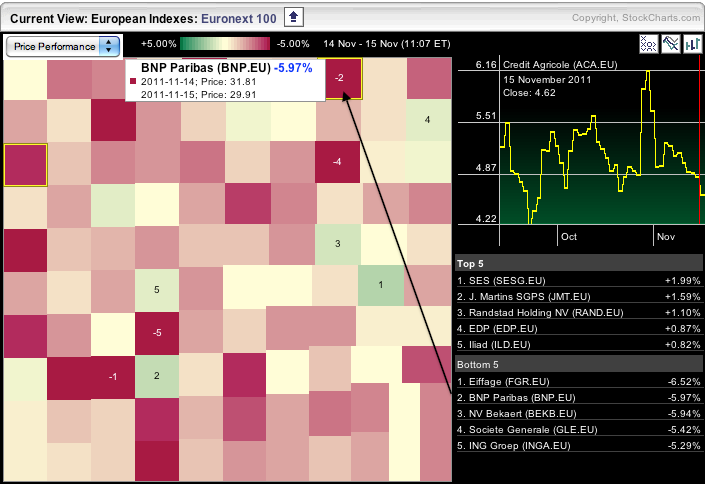
Lots of Red in the European Market Carpet
by Arthur Hill,
Chief Technical Strategist, TrendInvestorPro.com
StockCharts.com offers a Market Carpet covering component stocks for seven European Indices. Chartists can look at all seven or click the title bar to focus on one. The image below focuses on the Euronext 100. There is a lot of red today with banks representing three of the five...
READ MORE
MEMBERS ONLY
SPY Falls Short of Prior High as TLT and UUP Bounce off Support
by Arthur Hill,
Chief Technical Strategist, TrendInvestorPro.com
The price swings are getting shorter as the triangle tightens in the S&P 500 ETF (SPY). While it is hard to act on every swing within the triangle, this is the only way to anticipate the triangle breakout. Those not acting on the internal swings, would simply wait...
READ MORE
MEMBERS ONLY
Charts of Interest: ADBE, APOL, FISV, GCI, ISIL, PG, SCHL
by Arthur Hill,
Chief Technical Strategist, TrendInvestorPro.com
ADBE forms Rising Wedge after Big Gap Down.
GCI Hits Resistance at Key Retracement.
PG Consolidates at Trendline Support.
Plus APOL, FISV, ISIL, SCHL
This commentary and charts-of-interest are designed to stimulate thinking. This analysis is not a recommendation to buy, sell, hold or sell short any security (stock ETF...
READ MORE
MEMBERS ONLY
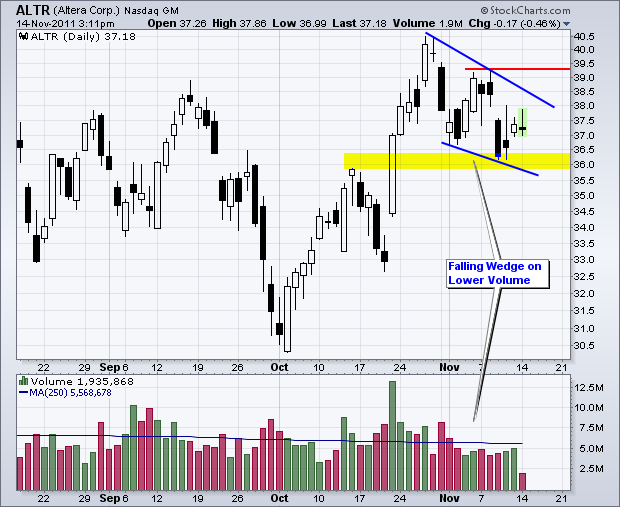
Altera Forms Falling Wedge on Lower Volume
by Arthur Hill,
Chief Technical Strategist, TrendInvestorPro.com
After a surge with good volume in October, Altera (ALTR) corrected with a falling wedge the last 2-3 weeks. Also notice that the stock exceeded its September high with the October surge. The falling wedge looks corrective and a break above last week's high would signal a continuation...
READ MORE
MEMBERS ONLY
SPY Holds Support at a Triangle Takes Shape
by Arthur Hill,
Chief Technical Strategist, TrendInvestorPro.com
As noted on Friday, the S&P 500 ETF (SPY) is in a medium-term uptrend after the October breakout in the 122-124 area. Broken resistance turns into support and the ETF tested this support zone with sharp declines in November. Both declines were punctuated by down gaps, but the...
READ MORE
MEMBERS ONLY
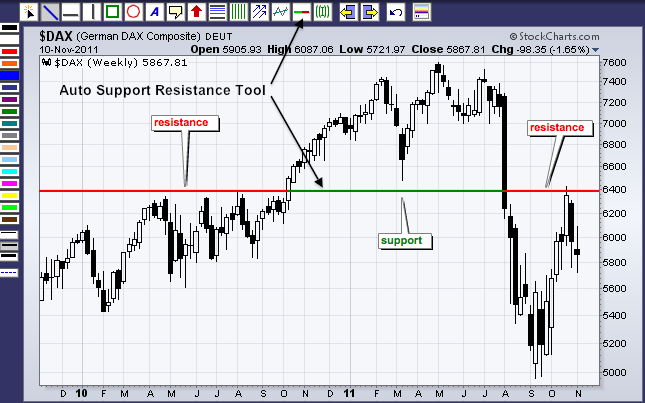
Resistance Turns Support Turns Resistance Again for the German DAX
by Arthur Hill,
Chief Technical Strategist, TrendInvestorPro.com
Traditional technical analysis teaches us that broken resistance turns support and broken support turns resistance. This concept is alive and well on the German DAX Index ($DAX) chart. Using the Auto Support-Resistance Tool on Sharpcharts, a horizontal line at 6400 goes from red to green to red again as this...
READ MORE
MEMBERS ONLY
ADI Hits Support on Point & Figure Chart
by Arthur Hill,
Chief Technical Strategist, TrendInvestorPro.com
After plunging along with the market early this week, Analog Devices (ADI is trading at support from the early November lows. On this P&F chart, each box represents a quarter percent price change (.25%) and price data is based on the close every 30 minutes. Yes, this is...
READ MORE
MEMBERS ONLY
Stocks Consolidate as Surging Oil Prices Weigh on Treasuries
by Arthur Hill,
Chief Technical Strategist, TrendInvestorPro.com
Technically, SPY is in a medium-term uptrend after the October breakout in the 122-124 area. This breakout can be seen on the daily chart below. Broken resistance turns into support and the ETF is currently testing this support zone with two declines into the 122-124 area. After a sharp advance...
READ MORE
MEMBERS ONLY
Indicator Summary Remains Bullish as Breakouts Hold
by Arthur Hill,
Chief Technical Strategist, TrendInvestorPro.com
There is no change in the indicator summary as the October breakouts continue to hold. Even though the stock market got shook pretty hard last week and this week, these breakouts are still holding. We cannot question a breakout unless there is a move back below broken resistance. For example,...
READ MORE
MEMBERS ONLY
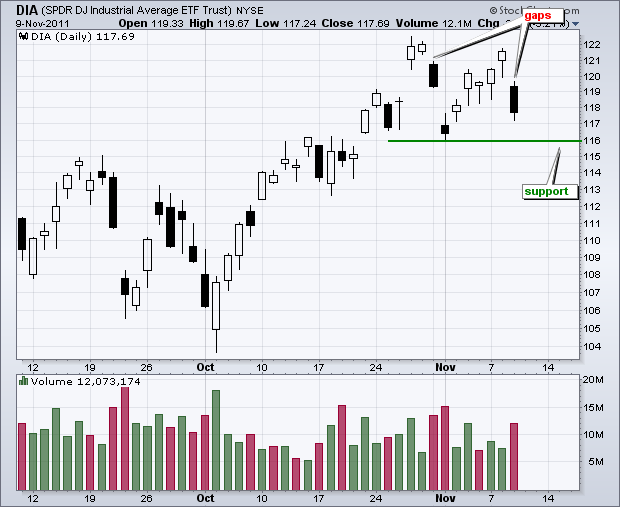
DIA Solidifies Resistance with Two Gaps
by Arthur Hill,
Chief Technical Strategist, TrendInvestorPro.com
For the second time in three weeks, the Dow Industrials SPDR (DIA) moved above 121 and then gapped down. These two gaps indicate that DIA has stiff resistance in the 122 area. Key support is based on the prior trough at 116. Follow through below this level would reverse the...
READ MORE
MEMBERS ONLY
SPY Gaps Down Big as UUP Breaks Flag Resistance
by Arthur Hill,
Chief Technical Strategist, TrendInvestorPro.com
Global equities remain tethered to the Euro and the outlook for the European debt dilemma. Even though a big ocean separates the US from Europe, US traders and investors should keep an eye on the spread between German bond yields and other bond yields, namely Italian and Spanish. This is...
READ MORE
MEMBERS ONLY
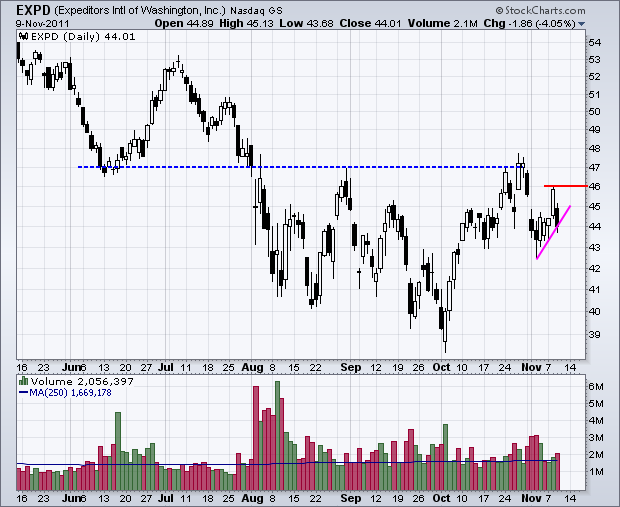
Charts of Interest: EXPD, GE, JBHT, IGT, PLCE
by Arthur Hill,
Chief Technical Strategist, TrendInvestorPro.com
IGT Forms Large Shooting Star.
JBHT Hits Resistance at 61.80% Retracement.
PLCE Declines from Resistance on High Volume.
Plus EXPD and GE
This commentary and charts-of-interest are designed to stimulate thinking. This analysis is not a recommendation to buy, sell, hold or sell short any security (stock ETF or...
READ MORE
MEMBERS ONLY
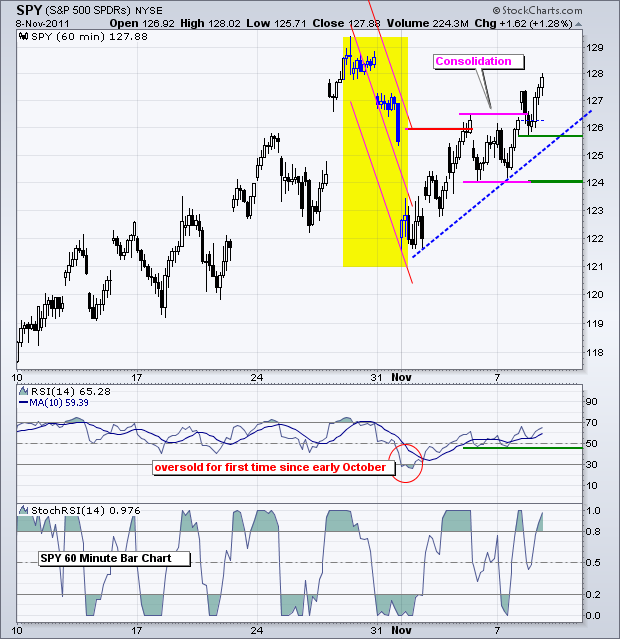
SPY Breaks Consolidation as UUP Remains in Bull Flag
by Arthur Hill,
Chief Technical Strategist, TrendInvestorPro.com
As noted yesterday, the medium-term trend was up because of the resistance breakout in October. This breakout can be seen on a daily chart. Broken resistance in the 122-124 area turned into support and held after the Throwback. The yellow area marks this Throwback on the 60-minute chart. Even though...
READ MORE
MEMBERS ONLY
Regional Bank SPDR and Homebuilder SPDR Advance Step-for-Step
by Arthur Hill,
Chief Technical Strategist, TrendInvestorPro.com
The Regional Bank SPDR (KRE) and the Homebuilders SPDR (XHB) have been leading the market higher since early October. Both bottomed with the October 3rd close and surged over 20% the last five weeks. Also notice how these two are moving step-for-step. KRE is red and XHB is black. Strength...
READ MORE
MEMBERS ONLY
QQQ and USO Break Flag Resistance
by Arthur Hill,
Chief Technical Strategist, TrendInvestorPro.com
Even though SPY formed a bearish rising flag after the plunge to 122, the ETF has yet to break support as a flat consolidation formed the last few days. The ETF broke below the lower trendline of the rising flag on Friday, but quickly rebounded to establish support at 124....
READ MORE
MEMBERS ONLY
Charts: AMKR, BSX, COST, KGC, MDT, NVDA, SWKS, WNR
by Arthur Hill,
Chief Technical Strategist, TrendInvestorPro.com
AMKR Forms Ascending Triangle.
COST Consolidates Near Resistance.
SWKS Breaks Flag Trendline with high Volume.
Plus BSX, KGC, MDT, NVDA, WNR
This commentary and charts-of-interest are designed to stimulate thinking. This analysis is not a recommendation to buy, sell, hold or sell short any security (stock ETF or otherwise). We...
READ MORE
MEMBERS ONLY
Randgold Leads Gold with a 52-week High
by Arthur Hill,
Chief Technical Strategist, TrendInvestorPro.com
Randgold Resources (GOLD) is leading the gold miners and gold with a new 52-week high the last few days. Also note that Randgold broke resistance with a move above 115. The indicator window shows Randgold relative to gold with a ratio plot (GOLD:$GOLD). The Price Relative is trending up...
READ MORE
MEMBERS ONLY
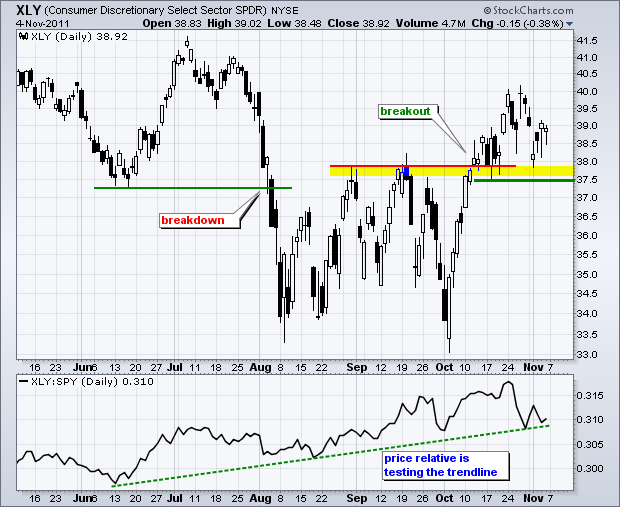
WATCHING THE RESISTANCE BREAKOUTS IN XLK AND XLY
by Arthur Hill,
Chief Technical Strategist, TrendInvestorPro.com
Earlier this week I noted that the Nasdaq 100 ETF, the Russell 2000 ETF and the S&P 500 ETF were testing broken resistance. The October surges produced breakouts and it is important that these resistance breakouts hold. Basic technical analysis teaches us that broken resistance levels turn into...
READ MORE
MEMBERS ONLY
Apple Consolidates after a Gap Down
by Arthur Hill,
Chief Technical Strategist, TrendInvestorPro.com
Apple Corp (AAPL), which accounts for around 14% of the Nasdaq 100 ETF (QQQ), gapped down in mid October and then consolidated. This low volume consolidation now looks like a flat flag. Watch the boundaries for the next directional clue. Any move Apple will affect QQQ.
Click this chart for...
READ MORE