MEMBERS ONLY
Nasdaq Composite. Down for the Count?
by Bruce Fraser,
Industry-leading "Wyckoffian"
The current decline was accompanied by a large increase in volatility and volume. Can the Wyckoff Method help guide our thinking and improve our tactics? A recent parallel is the decline in January and February of this year and the market action that followed in its aftermath.
Wyckoff provides a...
READ MORE
MEMBERS ONLY
Headwinds
by Bruce Fraser,
Industry-leading "Wyckoffian"
Headwinds have been forming for the stock market. Point and Figure counts (PnF) have been signaling where these opposing forces to higher stock prices were likely to emerge. Stocks have reacted downward with authority after hitting these PnF targets. Let’s review, and bring current, some of these prior chart...
READ MORE
MEMBERS ONLY
Health Care Plan
by Bruce Fraser,
Industry-leading "Wyckoffian"
In March of 2017 the Health Care Sector (XLV) emerged from a large Reaccumulation structure into a fresh new uptrend. Much has happened since then. Let’s update the status of this uptrend.
After a sustained advance from 2009 to 2015 the trend stopped and a Reaccumulation formed. This trend...
READ MORE
MEMBERS ONLY
Campaigning Crude Oil
by Bruce Fraser,
Industry-leading "Wyckoffian"
It is time to update the blog post, 'Crude Oil Runs with the Bulls', of November 11, 2017 (click here). Our Crude Oil ($WTIC) odyssey began in December of 2015 with a study of the Distributional Top touching $112. A Distribution Point and Figure (PnF) count produced an...
READ MORE
MEMBERS ONLY
deFANG'd?
by Bruce Fraser,
Industry-leading "Wyckoffian"
In June we studied the First Trust Dow Jones Internet Index Fund (FDN). This ETF is our proxy index for the FANG stocks. At that time FDN had accelerated into an overbought condition by throwing over its trend channel. Almost immediately weakness set in and FDN tumbled to the lower...
READ MORE
MEMBERS ONLY
Semi-Tough
by Bruce Fraser,
Industry-leading "Wyckoffian"
Back in December of 2017 we asked ‘Do Semiconductors Still Compute?’. An epic rally that began in 2016 had Climactic qualities as SMH accelerated into year-end 2017. Two different PnF counts were fulfilled on that rally surge. After a sharp break on high volume it appeared the rally had run...
READ MORE
MEMBERS ONLY
Prospecting for a Low in Gold
by Bruce Fraser,
Industry-leading "Wyckoffian"
Gold began an uptrend in 2001 which persisted for more than 10 years. At the conclusion of that trend, gold had a classic Buying Climax (BCLX) which led to a Change of Character. For the last 5 years gold has made no upward progress. Is gold getting ready to resume...
READ MORE
MEMBERS ONLY
Residential Deconstruction
by Bruce Fraser,
Industry-leading "Wyckoffian"
Charts are sometimes a mish-mash of contrary messages. As a general rule Wyckoffians will attempt to avoid these situations. But they can be valuable case studies. Residential Construction has been a Relative Strength (RS) laggard during all of this year after a surging climactic run in 2017. See the classic...
READ MORE
MEMBERS ONLY
Homework Assignment
by Bruce Fraser,
Industry-leading "Wyckoffian"
ChartCon 2018 is fast approaching and preparations are being made. Let’s take a few minutes during this busy week to study some charts. For contrast we will compare the NASDAQ Composite, which is one of the leadership indexes, to the Dow Jones Industrials, which is a laggard.
A big...
READ MORE
MEMBERS ONLY
Russell Revisited
by Bruce Fraser,
Industry-leading "Wyckoffian"
One year ago, we analyzed the Russell 2000 Small Cap Index ($RUT) in a Wyckoff Power Charting blog post. An evaluation of the vertical bar chart and the Point and Figure objectives pointed to higher prices (click here to read the ‘Hustling Russell’). Please review this prior post before proceeding....
READ MORE
MEMBERS ONLY
Is Your Money Safe in Banks?
by Bruce Fraser,
Industry-leading "Wyckoffian"
July is a busy month. Preparations are taking place for the upcoming ChartCon. And Roman Bogomazov and I are launching our new StockCharts TV program ‘Power Charting’. Power Charting will be broadcast weekly on Friday at 3pm EDT with repeats thereafter. Our emphasis will be on Wyckoff Method basics using...
READ MORE
MEMBERS ONLY
Tactical Dilemma
by Bruce Fraser,
Industry-leading "Wyckoffian"
While some major indexes have pushed to new high ground recently, the Dow Jones Industrial Average ($INDU) has remained a notable laggard. This creates a tactical dilemma for Wyckoffians. Is the weaker Dow Jones Industrial Average offering a ‘tell’ by lagging the broad market? Or is the industrial (thirty) stock...
READ MORE
MEMBERS ONLY
Wyckoff Intraday Workshop
by Bruce Fraser,
Industry-leading "Wyckoffian"
During my most recent guest appearance on MarketWatchers LIVE (7/5/18) I introduced a case study of intraday trading with the Wyckoff Method. Intraday trading is not every traders cup of tea, but even if you are not a short term trader there are benefits to studying the intraday...
READ MORE
MEMBERS ONLY
A Mid-Year Look at FANG Stocks
by Bruce Fraser,
Industry-leading "Wyckoffian"
Remember to tune in this coming Thursday, July 5th, when I will be a guest on MarketWatchers Live. I recently promised to drill down into intraday charting using the Wyckoff Method. The Wyckoff technique works very well on smaller timeframes and it is fun to do. On Thursday I will...
READ MORE
MEMBERS ONLY
Retail Roll-Reversal
by Bruce Fraser,
Industry-leading "Wyckoffian"
Internet retailers have not been required to charge sales tax for many online transactions. This has created a major advantage over the brick-and-mortar retailers. A recent court ruling could require internet retailers to include state sales tax on all purchases. Will this breathe new life into the traditional retailing stocks...
READ MORE
MEMBERS ONLY
Solar Stocks Go Dark
by Bruce Fraser,
Industry-leading "Wyckoffian"
Since mid-May the renewable energy stocks have tumbled. This may have come as an unexpected surprise to many. Let’s do a mini-blog case study of the Dow Jones Renewable Energy Equipment Index ($DWCREE) to determine if there was advance warning of trouble brewing.
As Wyckoffians we are really in...
READ MORE
MEMBERS ONLY
Tale of the Tape
by Bruce Fraser,
Industry-leading "Wyckoffian"
As Wyckoffians we often generate a hypothesis regarding the forces that propel stocks and industry groups higher (or lower). Homebuilders enjoyed a major uptrend in 2016-17.
In this case study from 2016; interest rates were near historically low levels, thus we could conclude that home purchases would be stimulated. And...
READ MORE
MEMBERS ONLY
BankRoll
by Bruce Fraser,
Industry-leading "Wyckoffian"
Bank stocks are telling an interesting tale. As Wyckoffians we interpret the story the market is telling through the action of the tape. Banks are at the hub of the wheel of the economy. These financial institutions continually inject or remove liquidity from the economy through their operations. It has...
READ MORE
MEMBERS ONLY
Ship in a Bottle
by Bruce Fraser,
Industry-leading "Wyckoffian"
A model ship in a bottle reminds me of the intricate detail, on a minature scale, available with the Wyckoff Method. Wyckoff analysis scales up, into very large timeframes, and down into the shortest of timeframes. Those who study and trade on an intra-day basis should consider adding these Wyckoff...
READ MORE
MEMBERS ONLY
Two Way Markets
by Bruce Fraser,
Industry-leading "Wyckoffian"
Since 2016 the broad stock market has been in a robust uptrend. Corporations have enjoyed an environment of stable and low interest rates with moderate rates of inflation. Such a backdrop of business conditions allows companies to efficiently manage their costs and grow earnings. Investors are willing to pay higher...
READ MORE
MEMBERS ONLY
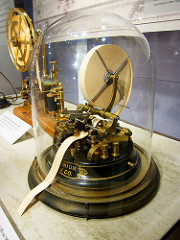
Richard W. Arms Jr., Wyckoffian
by Bruce Fraser,
Industry-leading "Wyckoffian"
Richard (Dick) Arms was a very creative market technician. He tackled one of the most elusive concepts in technical analysis: Volume. He became famous for creating the ‘ARMS Index’ (previously known as the TRIN Index). Dick created the ARMS Index in 1967 and published it in Barron’s Magazine. It...
READ MORE
MEMBERS ONLY
Does This Market Have Bad Breadth?
by Bruce Fraser,
Industry-leading "Wyckoffian"
The percentage of stocks above their 200 day moving average (200dma) is a breadth indicator that I have depended on for many years. It theoretically oscillates from zero to 100 percent. During bull markets this oscillator spends most of its time between 40% and 85%. During bear markets between 60%...
READ MORE
MEMBERS ONLY
A Wyckoff Week
by Bruce Fraser,
Industry-leading "Wyckoffian"
Two events happened this week that captured the attention of Wall Street. There was much buzz about both and they seem to be related. On Tuesday the stock market took a big tumble, with the Dow Jones Industrials falling 424 points. The next day the Ten-Year US Treasury Yield ($TNX)...
READ MORE
MEMBERS ONLY
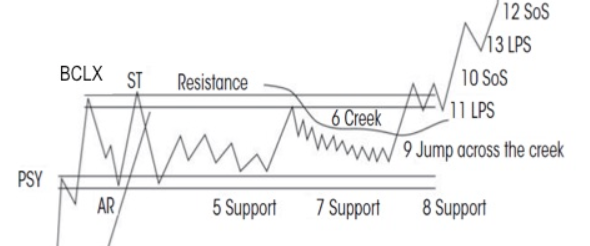
Jumping the Creek. A Review.
by Bruce Fraser,
Industry-leading "Wyckoffian"
Let’s review the concept of the ‘Creek’. This is a nuanced Wyckoff principle, but once understood, it becomes a very powerful trading edge. Support and Resistance zones are typically understood to exert their influence at linear price levels. Horizontal lines are drawn on charts to represent these important levels....
READ MORE
MEMBERS ONLY
Win the Race with Relative Strength
by Bruce Fraser,
Industry-leading "Wyckoffian"
Fellow Wyckoffian, Dan, emailed a very good question this week. Dan is seeing the energy stocks move up and he observes that being a cyclical industry, these stocks typically move in unison. Dan is observing that some of the stocks are completing Accumulation phases while others are already in uptrends....
READ MORE
MEMBERS ONLY
S&P 500. Zooming In.
by Bruce Fraser,
Industry-leading "Wyckoffian"
Wyckoff Method tools can be used in multiple time frames. We can often gain clarity by evaluating larger or smaller chunks of time. We recently studied the daily bars of the S&P 500 as it approached important Support. So far, this Support has been respected. Let’s review...
READ MORE
MEMBERS ONLY
Detect Rotation with PnF Charts
by Bruce Fraser,
Industry-leading "Wyckoffian"
The winds are shifting in the financial markets. Often Point and Figure charts offer a perspective that other chart types might obscure. Point and Figure chart construction is minimalistic. It keeps the important price swings and discards the rest. PnF charting lends itself to techniques for estimating price objectives from...
READ MORE
MEMBERS ONLY
S&P 500 Notebook
by Bruce Fraser,
Industry-leading "Wyckoffian"
I make lots of notes on my charts. As conditions unfold I have a sense for what my thinking was and whether adjustments need to be made in tactics. In the ‘good old days’ stock charts were plotted by hand and notes were jotted onto charts; now we have wonderful...
READ MORE
MEMBERS ONLY
Interest Rates. How High?
by Bruce Fraser,
Industry-leading "Wyckoffian"
The Federal Reserve Bank (Fed) has indicated their intention to raise interest rates during 2018 and 2019. In fact, US Treasury interest rates have been rising for quite some time. We have been following the movement of bond prices with a Wyckoffian eye during this downtrend of prices (click here...
READ MORE
MEMBERS ONLY
Combining Wyckoff and Relative Strength to Find Big Trends
by Bruce Fraser,
Industry-leading "Wyckoffian"
In stock chart analysis the closest thing to X-Ray vision is Relative Strength. Often Relative Strength provides us with early price direction clues. Generally, when Relative Strength (RS) is in a rising trend and price is in a rising trend, this trend will persist. We define a trend as higher...
READ MORE
MEMBERS ONLY
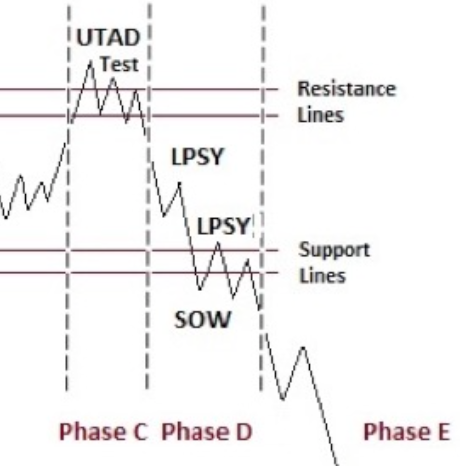
Divining Distribution
by Bruce Fraser,
Industry-leading "Wyckoffian"
In last Thursday’s MarketWatchers LIVE (recording available here) we discussed the Wyckoff Distribution concept of the Upthrust After Distribution (UTAD). Distribution and Accumulation adhere to a logical path or sequence of price and volume. During Distribution the Composite Operator (C.O.) has determined the area of price where they...
READ MORE
MEMBERS ONLY
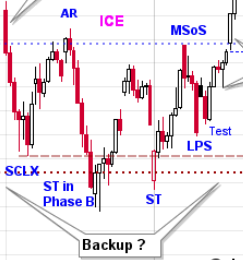
Distribution Review
by Bruce Fraser,
Industry-leading "Wyckoffian"
It has been a long time since we have explored the intricacies of the Wyckoff Distribution structure. But since 2018 has opened with a Bang, by going straight up in January and then early February’s retracement of the prior month’s advance, it is time to review. The year...
READ MORE
MEMBERS ONLY
The Law of Cause and Effect in Action
by Bruce Fraser,
Industry-leading "Wyckoffian"
The Law of Cause and Effect is a cornerstone principle of the Wyckoff Method. Cause building on the chart precedes the Effect of a Markup or a Markdown. Wyckoffians meticulously study trading ranges on the charts for Accumulation or Distribution characteristics. Analysis of Phases (Phases A thru E) track the...
READ MORE
MEMBERS ONLY
Bonds Get Clipped
by Bruce Fraser,
Industry-leading "Wyckoffian"
As stocks have been getting roiled over the last two weeks, bonds have been somewhat overlooked. Bond prices began dropping in December 2017, and possibly contributed to the weakness in stock prices weeks later. It has been about a year since we have looked at treasury bonds. What are they...
READ MORE
MEMBERS ONLY
AAPL Pie
by Bruce Fraser,
Industry-leading "Wyckoffian"
Apple, Inc. has been an endlessly illuminating Wyckoff Method case study during this bull market advance. The ascension of AAPL demonstrates the power of large institutional sponsorship. The top echelon of this sponsorship is what Wyckoffians call the ‘Composite Operator’ (C.O.). The footprints of the C.O. can be...
READ MORE
MEMBERS ONLY
Inflation Incubation
by Bruce Fraser,
Industry-leading "Wyckoffian"
Our resident Intermarket and Business Cycle experts, John Murphy and Martin Pring, have done a masterful job of evaluating the recent emergence of commodity prices. One proxy for commodity prices, the Commodity Research Bureau Index ($CRB), has come to life after a decade long downtrend. Is this evidence of an...
READ MORE
MEMBERS ONLY
Swing Trading Case Study
by Bruce Fraser,
Industry-leading "Wyckoffian"
2017 was the year of the ‘Uni-Market’ where leading stocks, industry groups and indexes marched higher from start to finish. Many important stocks got into a lockstep trend beginning in 2016. Two-Way markets are more common and we should see more of this in 2018. Markets are typically a cacophony...
READ MORE
MEMBERS ONLY
Reaccumulation Review
by Bruce Fraser,
Industry-leading "Wyckoffian"
A big thank you to Erin Swenlin and Tom Bowley for hosting me on MarketWatchers LIVE this past Wednesday. I had a blast being on their excellent (and Live) market program. The Wyckoff topic we covered was Reaccumulation structures. There were a few interesting intra-day charts that we did not...
READ MORE
MEMBERS ONLY
Schlumberger Rising
by Bruce Fraser,
Industry-leading "Wyckoffian"
The Energy Sector lit up the final month of 2017. There are a number of dynamic stocks amongst this theme we can profile. Let’s choose one (and circle back to study others later on). This case study is a good way to begin our posts in the new year....
READ MORE
MEMBERS ONLY
Year-End Cleanup
by Bruce Fraser,
Industry-leading "Wyckoffian"
Two favorite tools of Wyckoffians are Relative Strength analysis and Point and Figure (PnF) charting (Horizontal Method). As the year comes to a conclusion let’s reflect back on some case studies and bring them up to date.
‘In Gear with Relative Strength’ (click here for a link) profiled two...
READ MORE