MEMBERS ONLY
S&P 500 Earnings In for 2025 Q3; Overvaluation Persists

S&P 500 P/E in Q3 2025 is above normal and projected to rise in 2026. These charts will help you keep track of quarterly earnings.... READ MORE
S&P 500 P/E in Q3 2025 is above normal and projected to rise in 2026. These charts will help you keep track of quarterly earnings.... READ MORE

Discover why the S&P 500 is at its most overvalued level in history. See earnings trends, valuation ranges, and what rising P/E ratios mean for investors heading into 2026.... READ MORE

S&P 500 earnings are in for 2025 Q1, and here is our valuation analysis. The following chart shows the normal value range of the S&P 500 Index, indicating where the S&P 500 would have to be in order to have an overvalued P/E... READ MORE

S&P 500 earnings are in for 2024 Q4, and here is our valuation analysis. The following chart shows the normal value range of the S&P 500 index ($SPX), indicating where the S&P 500 would have to be to have an overvalued P/E of... READ MORE

The trouble with bonds is best portrayed by this long-term chart. Bonds were in a rising trend for about forty years, but the trend line was broken in 2022. This breakdown and subsequent price activity implies that bonds are going to be in a long-term falling trend for years to... READ MORE
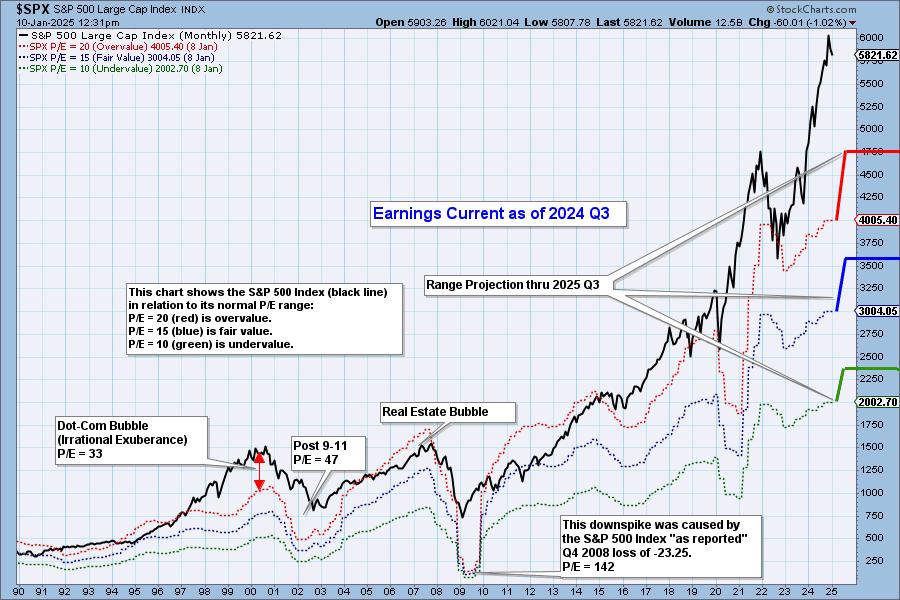
S&P 500 earnings are in for 2024 Q3, and here is our valuation analysis. The following chart shows the normal value range of the S&P 500 Index, indicating where the S&P 500 would have to be in order to have an overvalued P/E... READ MORE
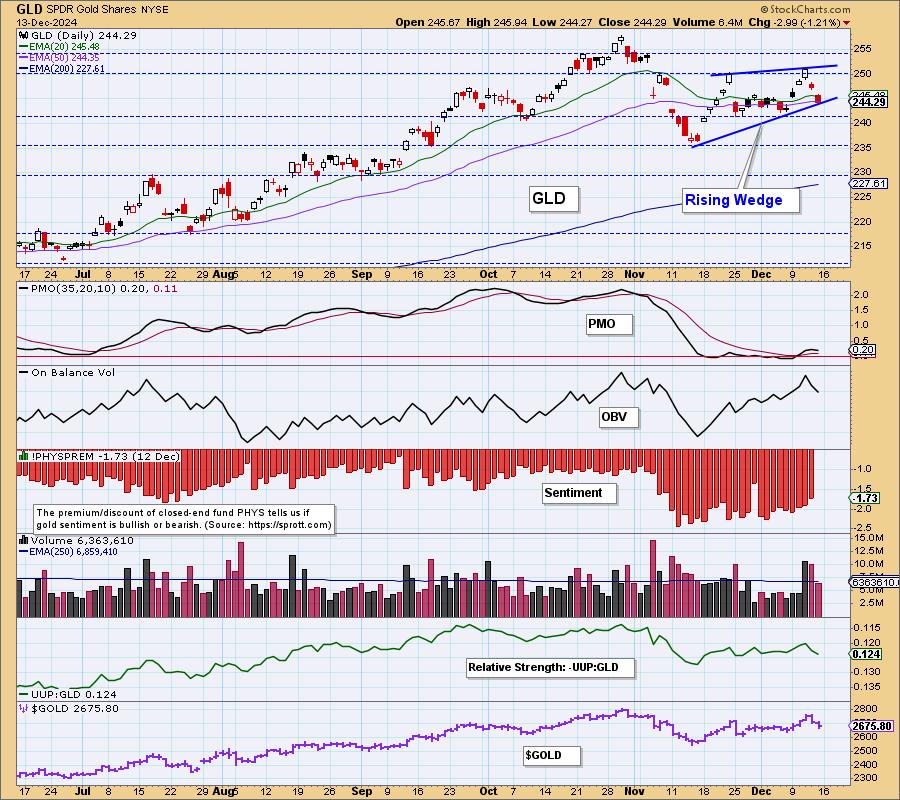
After the November pullback, GLD began to rally again. This week, on Wednesday, price exceeded the nearest November top, which made official the new rising trend from the November low. Brief celebration ends the following day as GLD tops, setting the top boundary for a bearish rising wedge formation. Rising... READ MORE
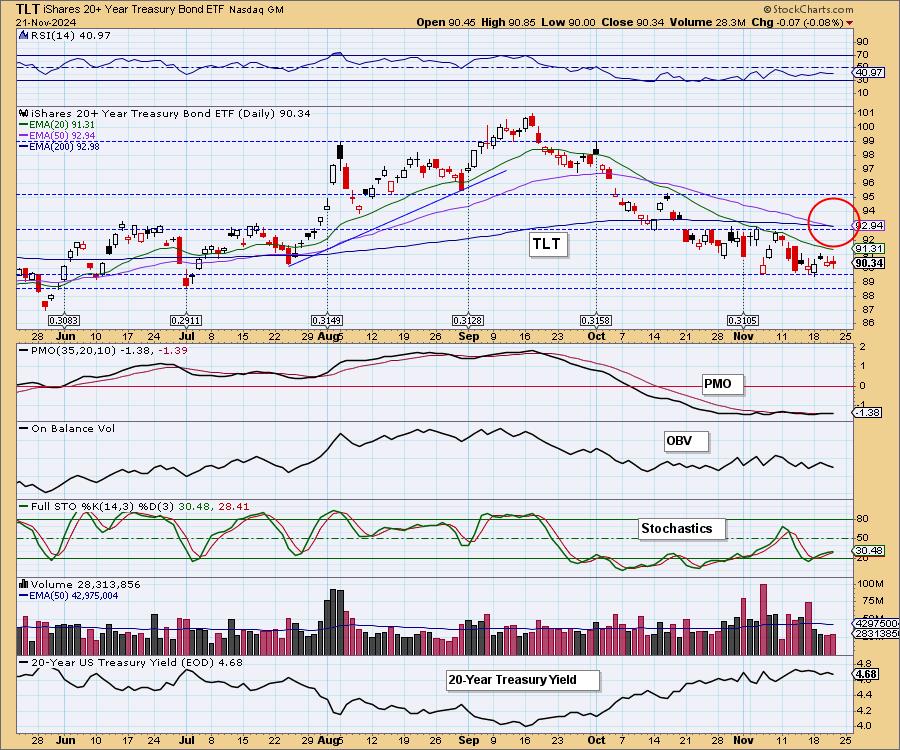
Today, the 20-Year Bond ETF (TLT) 50-day EMA crossed down through the 200-day EMA (Death Cross), generating an LT Trend Model SELL Signal. This was the result of a downtrend lasting over two months. We note that the PMO has been running flat below the zero line for a month,... READ MORE
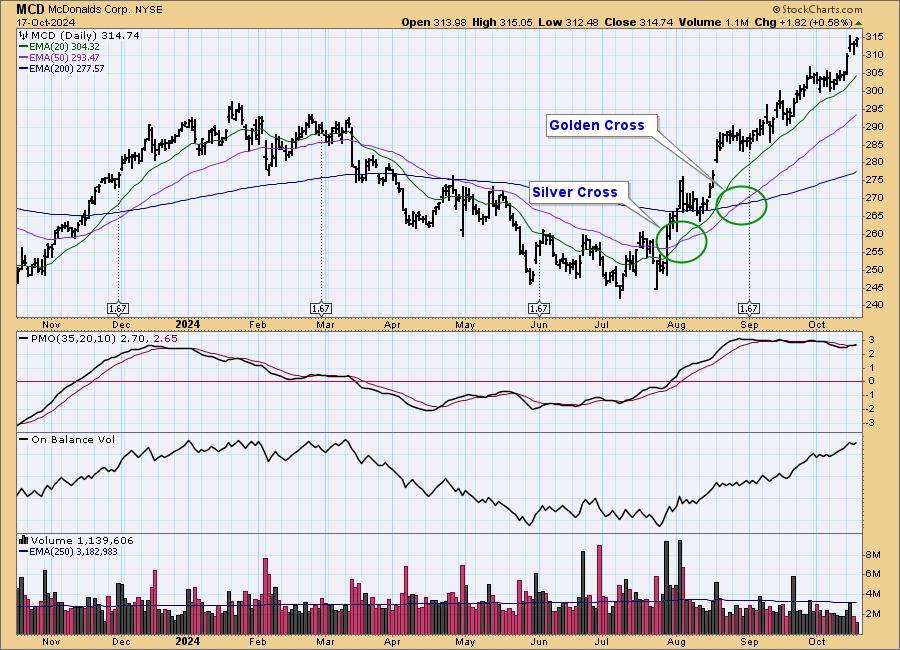
At DecisionPoint, we track intermediate-term and long-term BUY/SELL signals on twenty-six market, sector, and industry group indexes. The long-term BUY signals are based upon the famous Golden Cross, which is when the 50-day moving average crosses up through the 200-day moving average. (We use exponential moving averages -- EMAs.... READ MORE

S&P 500 earnings are in for 2024 Q2, and here is our valuation analysis. The following chart shows the normal value range of the S&P 500 Index, indicating where the S&P 500 would have to be in order to have an overvalued P/E... READ MORE

Sentiment indicators are contrarian, meaning that when the majority of investors are bullish on a market, it is bearish for that market. Most investors are aware of several sentiment indicators that relate to the stock market, but they may not be aware that there is a sentiment indicator for gold... READ MORE
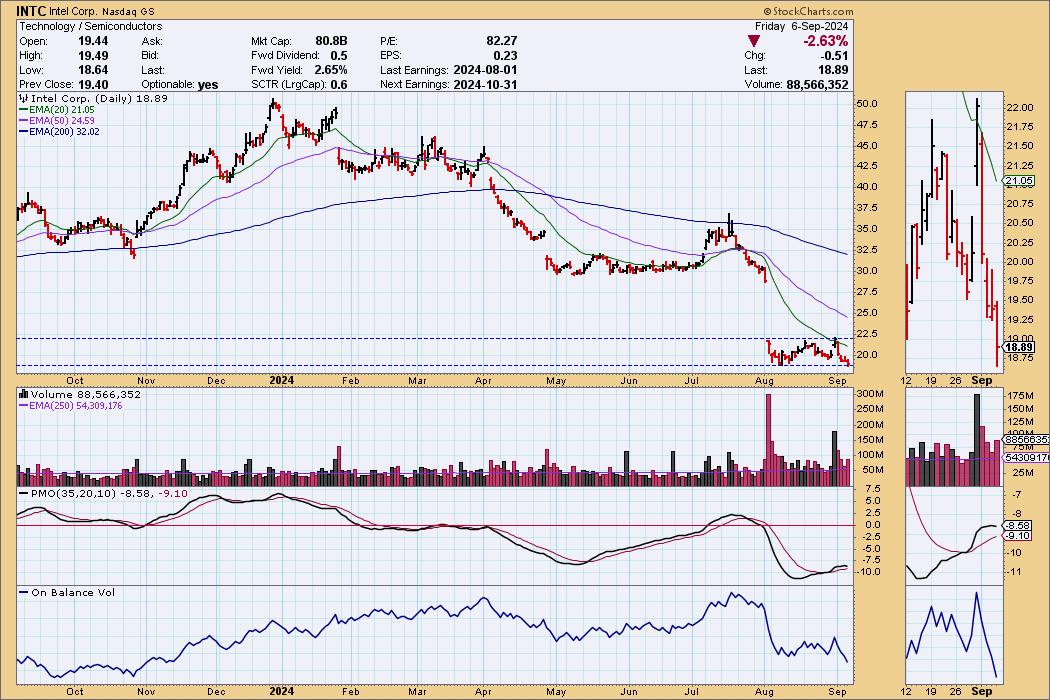
I've been around long enough to remember when Intel (INTC) was the NVIDIA of the day. Now, INTC is under severe pressure, having suspended its dividend, and is currently being considered for removal from the Dow 30 Industrial Average. Oh, how the mighty have fallen! With INTC having... READ MORE
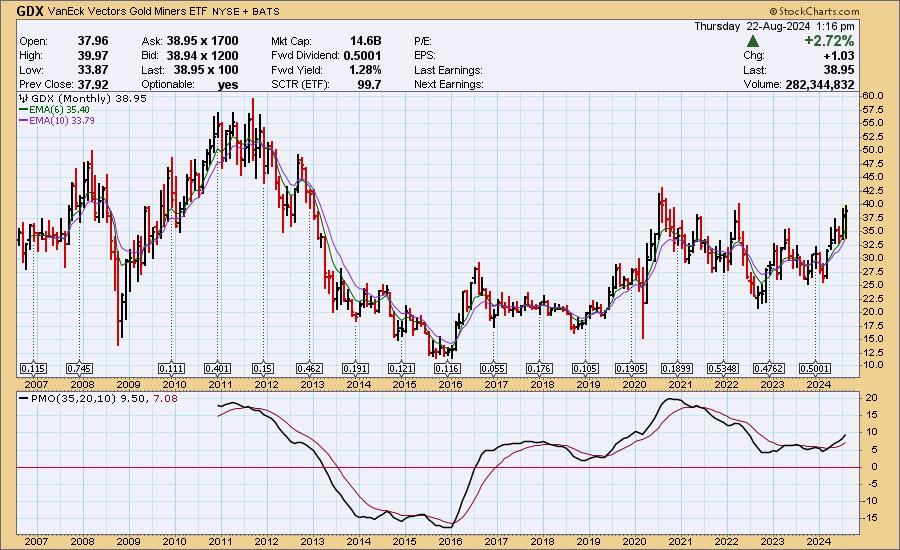
In Monday's DecisionPoint Trading Room video, we were asked why we cover Gold Miners (GDX) as well as Gold (GLD). There are two reasons: 1. Some people prefer to own the commodity, Gold, and others prefer to own an operating company that benefits from the price of Gold,... READ MORE

DecisionPoint tracks 26 market, sector, and industry group indexes, and we monitor moving average crossovers for those indexes to assess the bullish or bearish condition of those indexes. A Silver Cross BUY Signal is generated when the 20-day exponential moving average (EMA) of a price index crosses up through the... READ MORE
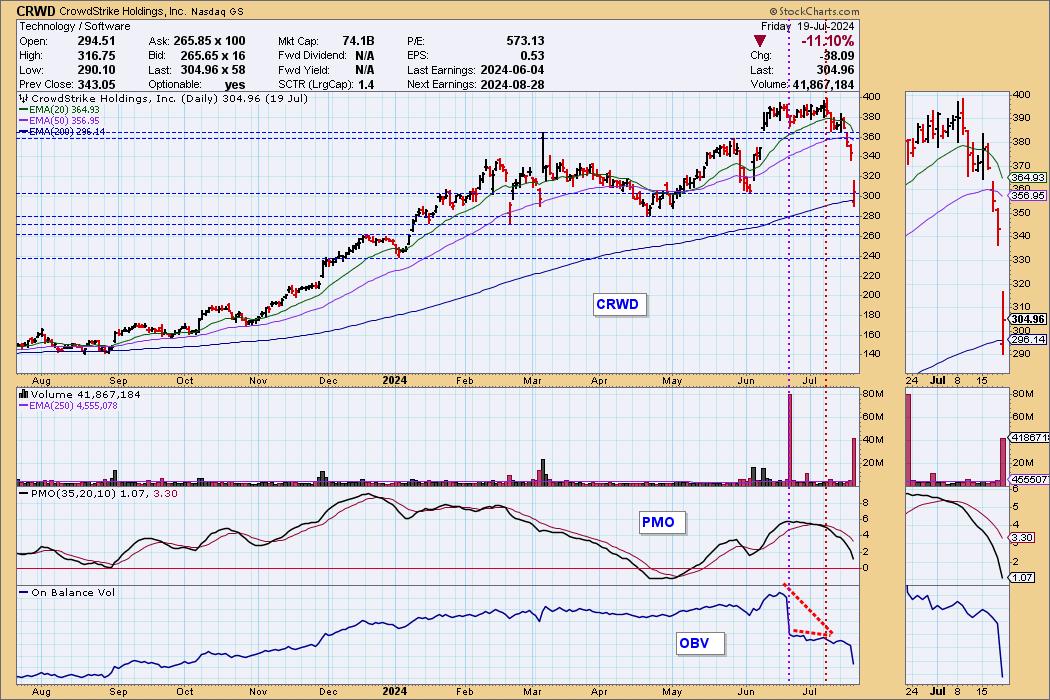
Friday's CrowdStrike software disaster has been described as "the largest IT outage in history," and it brought home just how vulnerable the planet is to itty-bitty coding errors. We were busy publishing the DecisionPoint ALERT Weekly Wrap, so I didn't have a chance to... READ MORE


KEY TAKEAWAYS * NVIDIA (NVDA) breaks down with Magnificent Seven * Russell 2000 (IWM) gets IT Trend Model "Silver Cross" BUY Signal This is a complimentary excerpt from the subscriber-only DecisionPoint Alert. NVIDIA (NVDA) broke down today in what looks like an echo of last month's pullback. There... READ MORE

S&P 500 earnings are in for 2024 Q1, and here is our valuation analysis. The following chart shows the normal value range of the S&P 500 Index, indicating where the S&P 500 would have to be in order to have an overvalued P/E... READ MORE

Today on Fox Business' Varney & Company, David Bahnsen (The Bahnsen Group) was asked if the current market reminded him of the Dot.com Bubble. He said it did, but not the part about all those worthless dot.com companies that went bust. Big companies like Cisco, Microsoft, and... READ MORE

When Nvidia (NVDA) opens on Monday, it will have experienced a 10:1 split, and we should remember that one of the purposes of stock splits is to facilitate distribution. That is to say that the lower price after the split attracts investors who avoided the stock at the higher... READ MORE

The Technology Sector (XLK) continues to dominate and drive the rally, but fewer and fewer stocks within the sector are participating in the rally. We know this because our Silver Cross Index (SCI), which shows the percent of stocks in the Technology Sector with Silver Cross BUY Signals (20-day EMA... READ MORE

In spite of the massive celebration of Nvidia's earnings report, we are seeing troublesome signs that the market is in the process of putting in a top. There are double top formations on six of the nine major indexes we follow, but the three indexes that haven'... READ MORE

While we don't typically begin with a monthly chart, it seems like a good place to start, as most of the good news is present there. Beginning on the left side, we can see how gold made a parabolic advance into an all-time high in 2011. Parabolic advances... READ MORE
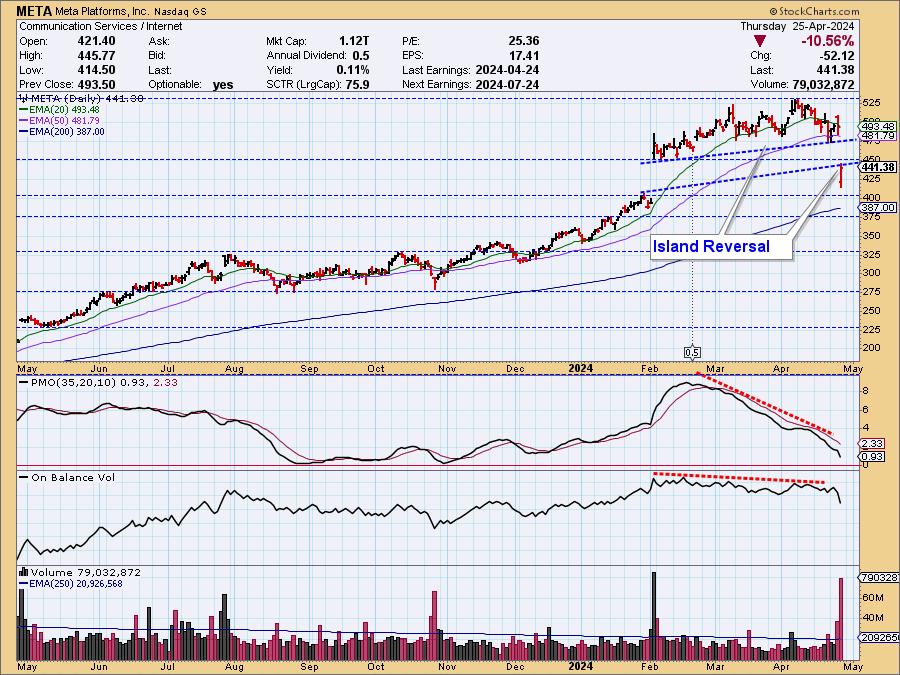
Whenever we see price gapping up or down, as happened with META in February, we prepare for the possibility of an island reversal. After the gap up, price forms a cluster, the island, and we ponder the possibility of a gap down to complete the reversal. During the formation of... READ MORE
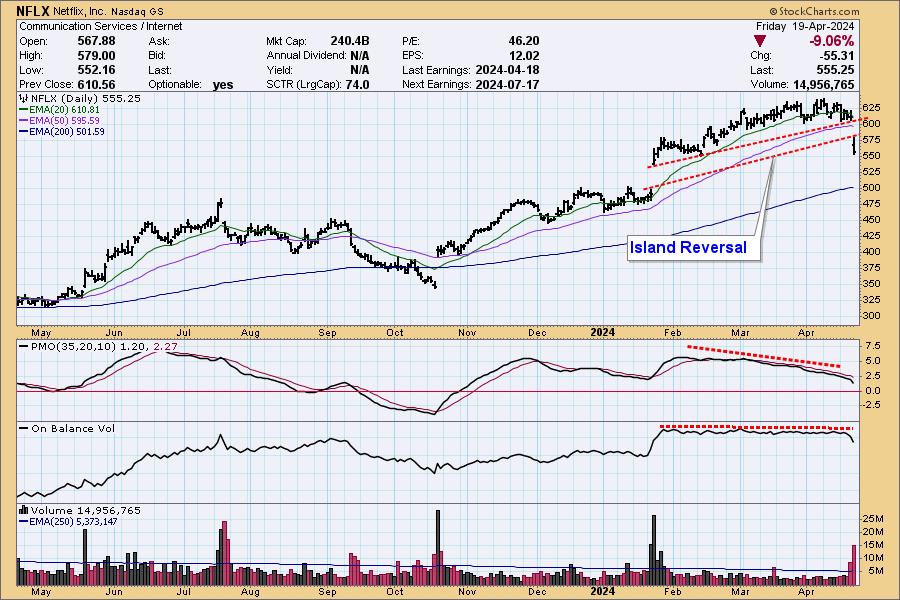
Netflix (NFLX) earnings were released today, and the news was good. . . except for one little thing. They also suspiciously announced that, starting next year, they would no longer be reporting subscriber metrics. That's like General Motors saying that they will no longer report how many cars and trucks... READ MORE
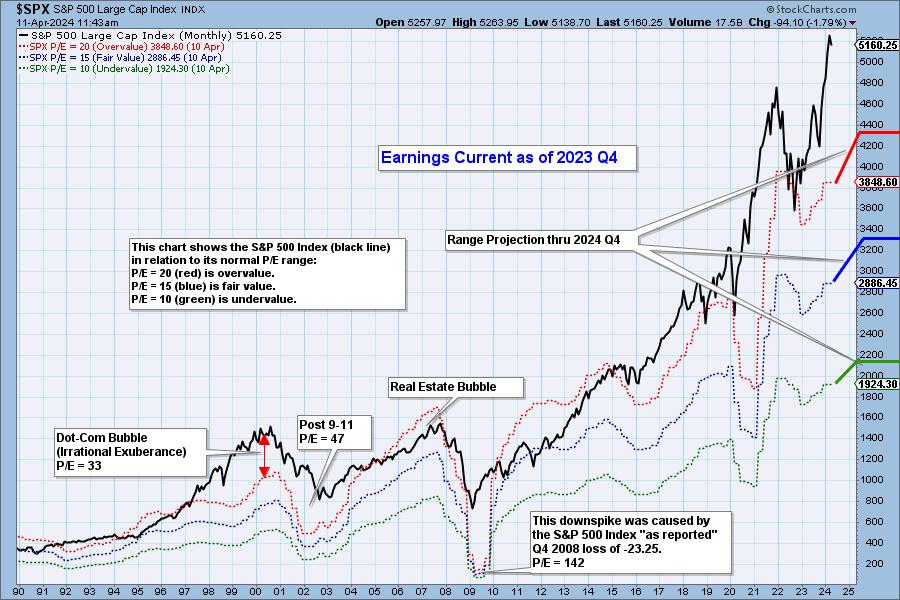
S&P 500 earnings are in for 2023 Q4, and here is our valuation analysis. The following chart shows the normal value range of the S&P 500 Index, indicating where the S&P 500 would have to be in order to have an overvalued P/E... READ MORE
The late Yale Hirsch (Stock Trader's Almanac) has long been known for identifying the six-month periods of positive and negative seasonality in the stock market. The positive period is November through April, and the negative period is May through October. We are currently in a positive period, which... READ MORE
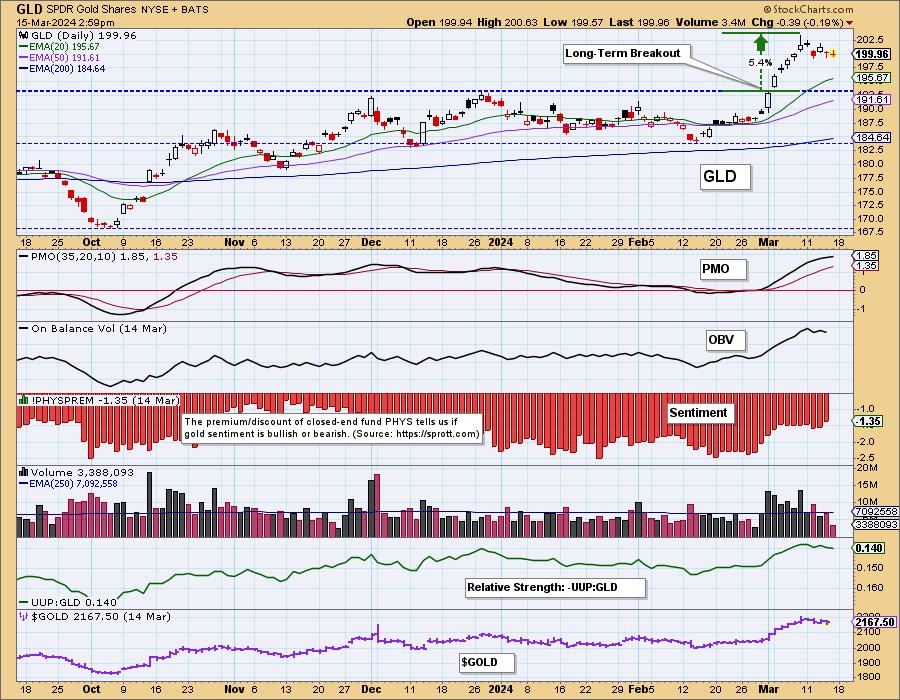
This month, the SPDR Gold Shares (GLD) broke out to new, all-time highs. That was a significant long-term move, which we will discuss when we get to the monthly chart. Of more immediate interest is the fact that sentiment is still bearish, which bodes well for a continued advance. We... READ MORE
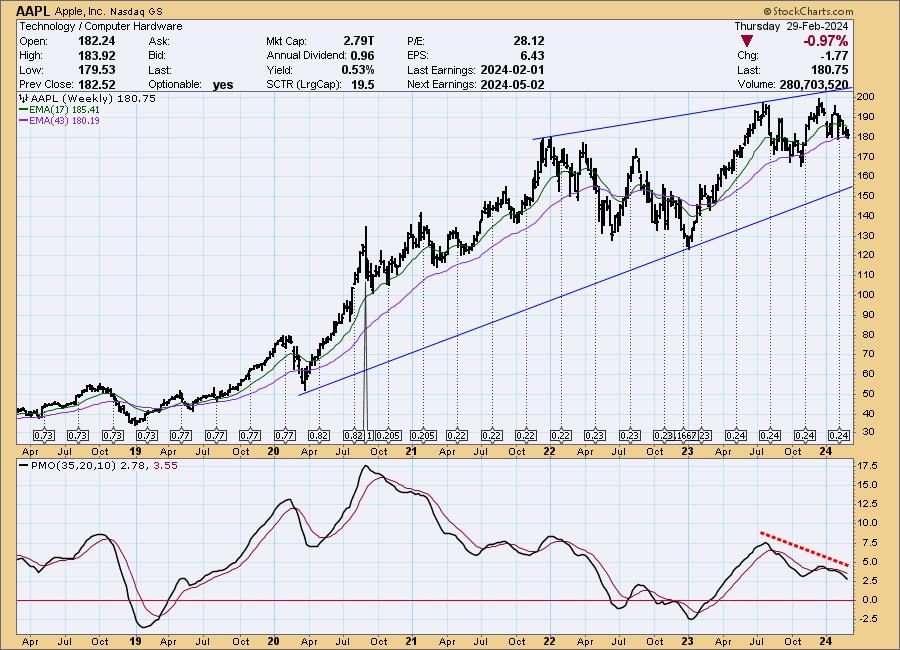
I have been hearing comments that some of the Magnificent Seven no longer qualify for membership, so I thought a quick look at them might be helpful. For this analysis, I'll be using weekly charts. Apple (AAPL): AAPL is dealing with trying to move production out of China,... READ MORE
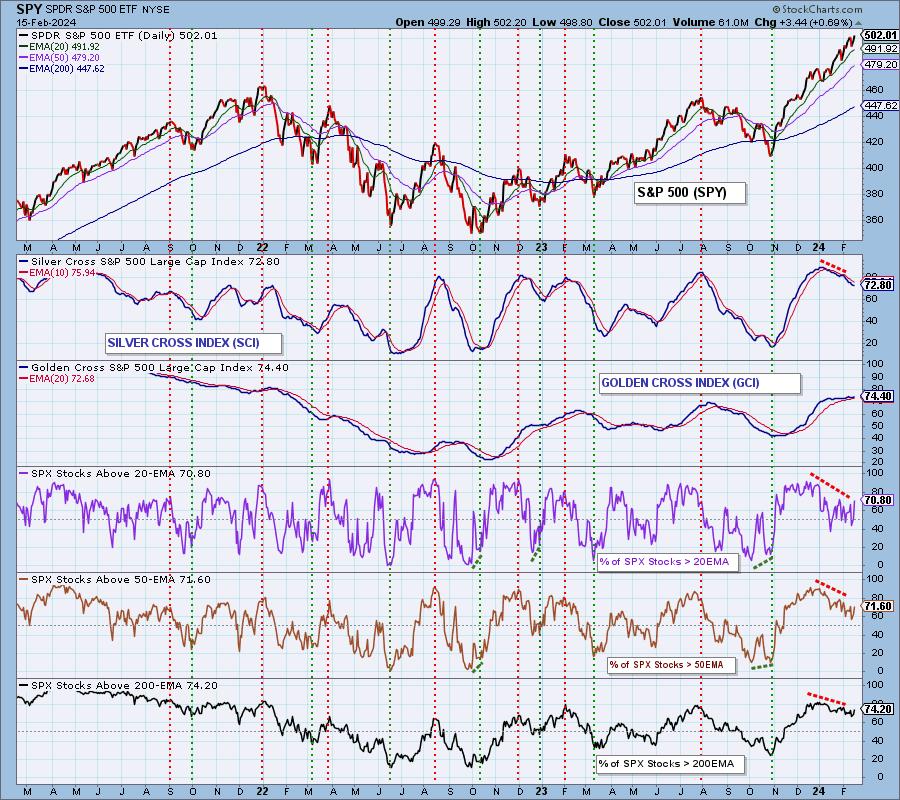
A Golden Cross BUY Signal is generated when the 50-day EMA of a price index crosses up through its 200-day EMA. DecisionPoint's Golden Cross Index (GCI) shows the percentage of stocks in a price index that have a Golden Cross BUY Signal, and is an expression of long-term... READ MORE

The Fed stopped raising rates in July, and, by mid-October, yields had peaked. Since then, yields have begun to decline in anticipation of the Fed beginning rate cuts this year. At this point, it appears that yields have found support and may possibly bounce, or begin moving sideways. This chart... READ MORE
(This is an excerpt from the subscriber-only DecisionPoint Alert on DecisionPoint.com) This week, the markets experienced a dramatic bias shift. We measure the Intermediate-Term Bias using our Silver Cross Index (SCI). The SCI measures how many stocks within an index, sector, or industry group hold "silver crosses"... READ MORE

S&P 500 earnings are in for 2023 Q3, and here is our valuation analysis. The following chart shows the normal value range of the S&P 500 Index, indicating where the S&P 500 would have to be in order to have an overvalued P/E... READ MORE

When we discuss participation, we are referring to the more specific and accurate assessment of breadth available with the Golden Cross and Silver Cross Indexes. The venerable and widely-known Golden Cross is when the 50-day moving average of a price index crosses up through the 200-day moving average, which signals... READ MORE

In this week's edition of The DecisionPoint Trading Room, with Energy (XLE) finally showing signs of life, Carl and Erin dive into the sector to learn more about participation and new momentum. Carl discusses Total Returns on SPX, which are showing new all-time highs before the actual index.... READ MORE

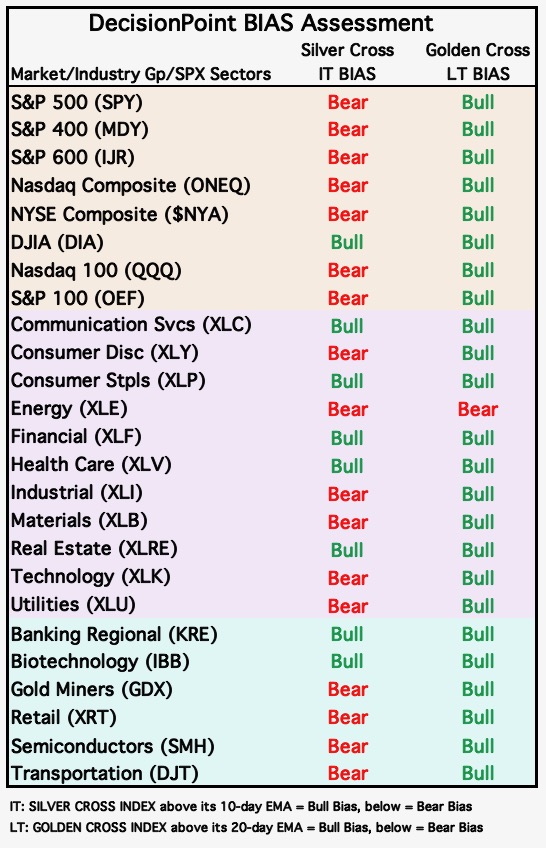
We publish this table daily to give an overview of the market, sector, and industry group indexes we follow. The Intermediate-Term Trend Model (ITTM) BUY Signals occur when the 20-day EMA crosses up through the 50-day EMA (Silver Cross). Long-Term Trend Model (LTTM) BUY Signals occur when the 50-day EMA... READ MORE
In this week's edition of The DecisionPoint Trading Room, Carl discusses his recent epiphany regarding data derived from major indexes. Bad data will lead to bad analysis, so it's important to understand this concept for analyzing major indexes. He and Erin discuss the implications of Magnificent... READ MORE

A recent article on the Business Insider site reported a set of Death Cross/Golden Cross signals on the Dow Jones Industrial Average ($INDU). Specifically, on November 13, the 50-day moving average crossed down through the 200-day moving average, commonly called a Death Cross. Two days later, the 50-day moving... READ MORE

Below is a reprint of an article written Thursday in the subscriber-only DecisionPoint Alert: One of the things we keep track of is the performance of the S&P 500 Index (SPY), which is cap-weighted, versus the S&P 500 Equal Weight Index (RSP). In a healthy bull... READ MORE

In this week's edition of The DecisionPoint Trading Room, Carl opens the show with a discussion about the typical 60/40 Portfolio (60% US Stocks/40% US Bonds) and whether it will continue to serve you well given the decline in Bonds. Is this portfolio blend obsolete? Both... READ MORE

After making a major low in 1981, bonds entered a rising trend that lasted nearly 40 years. During that period, new rules and expectations were constructed and acquired that still influence decision making today -- which is unfortunate, because the game has changed. In 2022, the long-term rising trend line... READ MORE