MEMBERS ONLY

A Tribute To John Murphy (1942-2026)
As you may have already heard, StockCharts' former Chief Technical Analyst, and a personal friend, passed away last month. It’s hard to put into words what John J. Murphy meant to me, to StockCharts, and to the entire technical analysis community.
John was one of the most influential...
READ MORE
MEMBERS ONLY

Smarter Options Trading Starts Here! StockCharts + OptionsPlay

by Tony Zhang,
Chief Strategist, OptionsPlay
In this video, Chip Anderson, President of StockCharts, sits down with Tony for a conversation in the StockCharts studio! During this in-depth Q&A session, Chip and Tony explore the powerful features that make the OptionsPlay add-on a must-have for options traders using the StockCharts platform. They discuss the...
READ MORE
MEMBERS ONLY
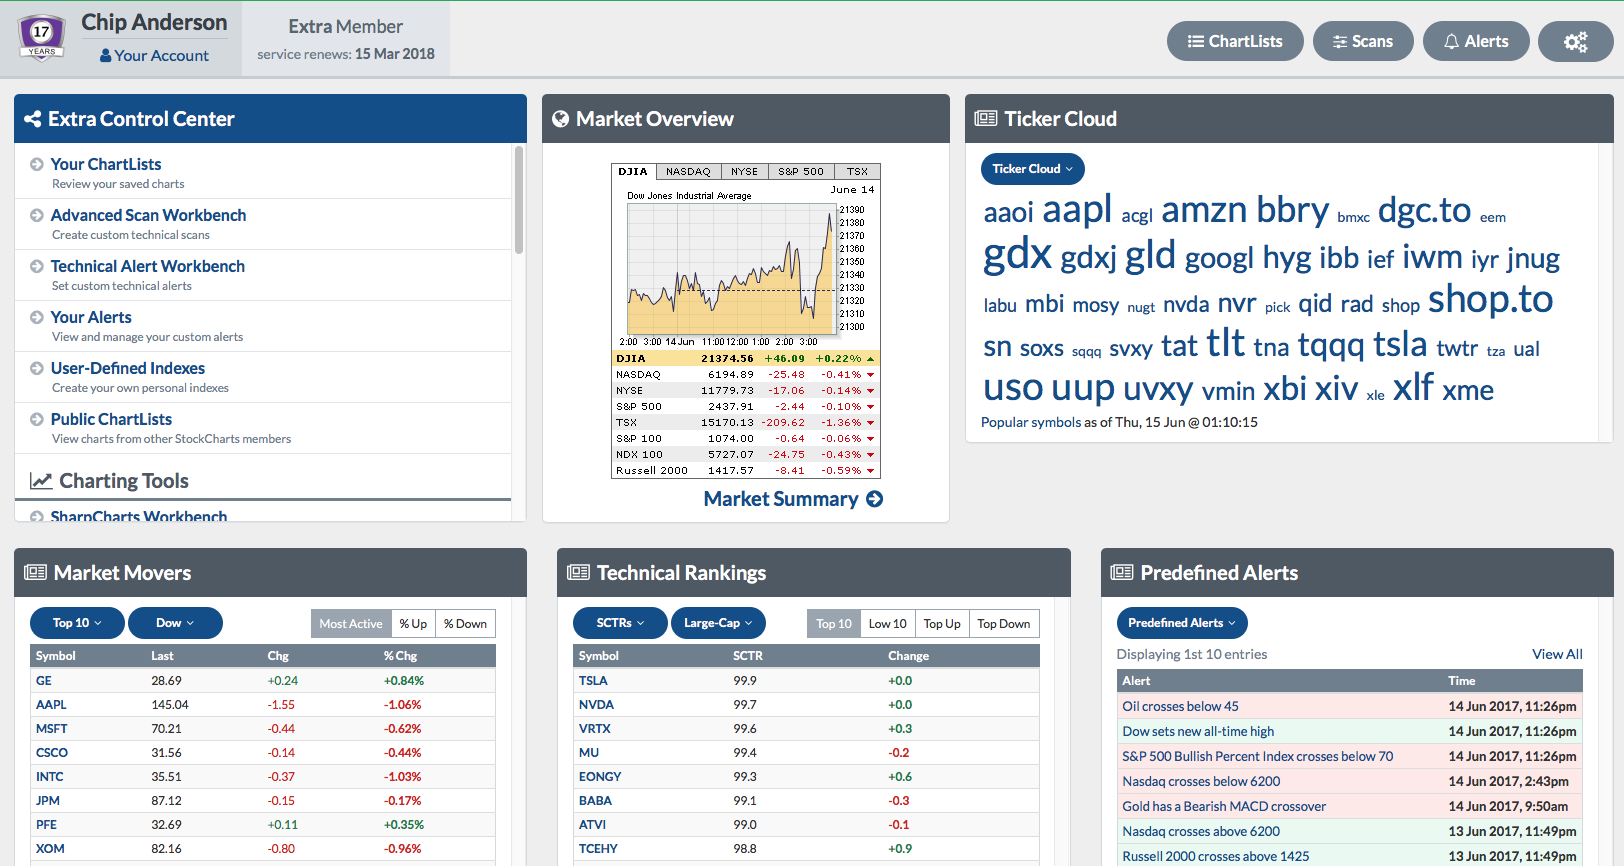
Latest Members Dashboard Update - #AWESOME!
Hello again, everyone! Just a quick note to tell you about an awesome new feature that we just rolled out. We've updated the Members' Dashboard so that it is now even more customizable and useful. The change is subtle - you would probably miss it if you...
READ MORE
MEMBERS ONLY
Passing the Torch
Hello Fellow ChartWatchers!
Well, after 18 years of writing these newsletters - and doing webinars and hosting conferences and writing educational articles - I am reliquishing those duties to others so that I can focus (re-focus?) on my real passion - making the technology behind StockCharts.com really great.
Last...
READ MORE
MEMBERS ONLY

How ChartCon 2016 Will Help You Make Better Investing Decisions
Hello Fellow ChartWatchers!
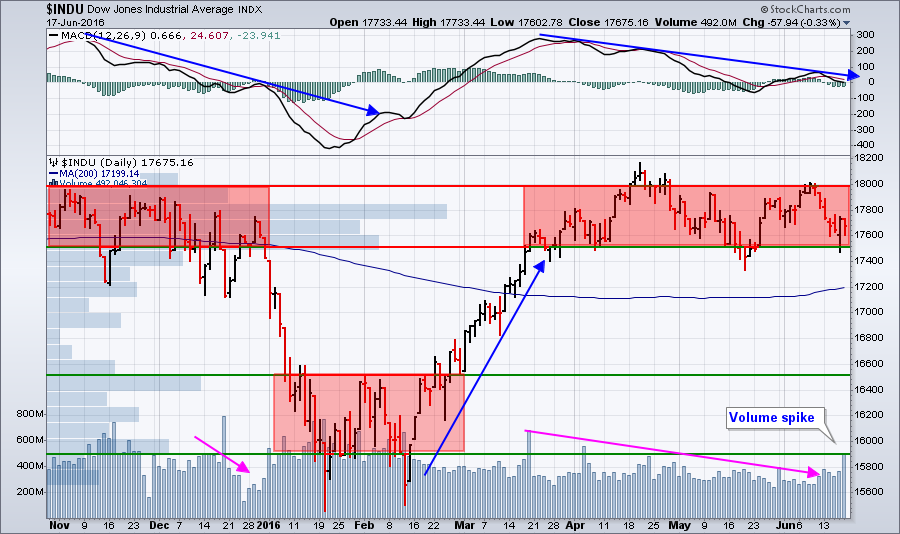
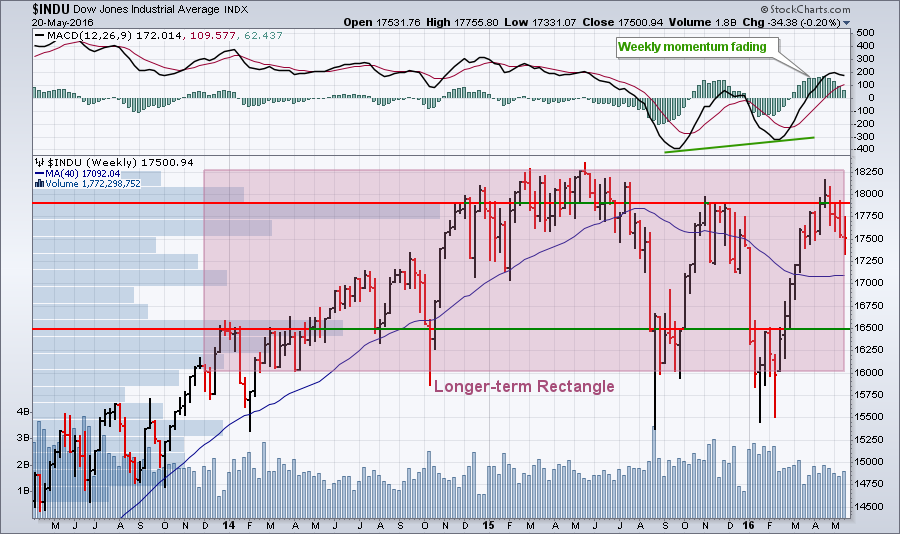
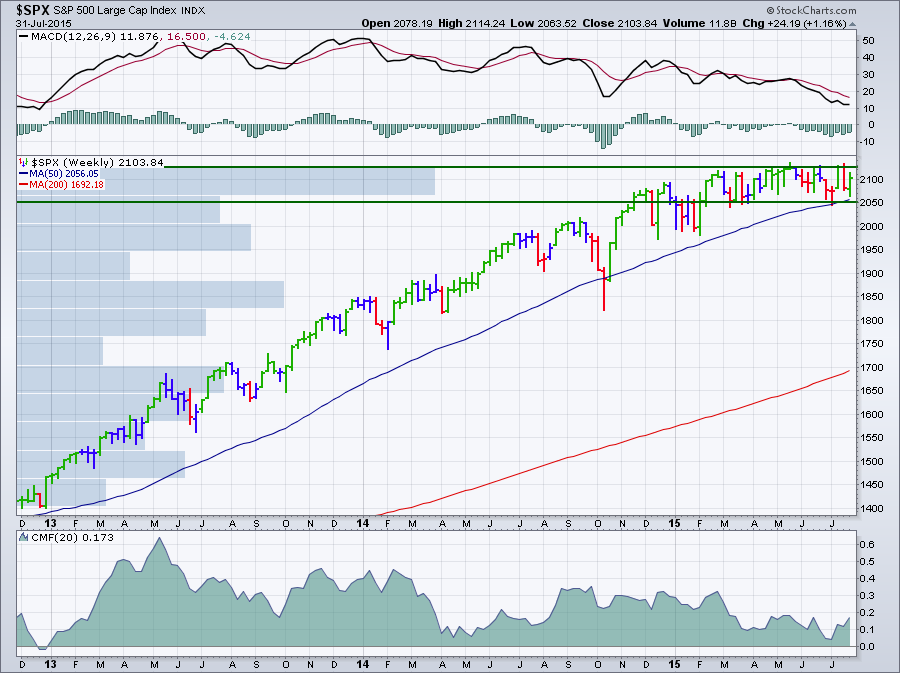
Markets are pulling back from their highs on increasing volume. You can see the weekly and daily charts with my annotations by clicking here. But even in this declining market environment, there are always possibilities. My "Strengthening Strength" scan (included at the bottom of the...
READ MORE
MEMBERS ONLY

ChartCon 2016 Preview
Hello Fellow ChartWatchers!
The markets continue to move sideways causing trend and momentum indicators to gradually lose their usefulness. The best way to see that is to look at the "2000 DJIA - Daily Analysis" chart on the new "ChartWatchers LIVE ChartList" (click on the link...
READ MORE
MEMBERS ONLY
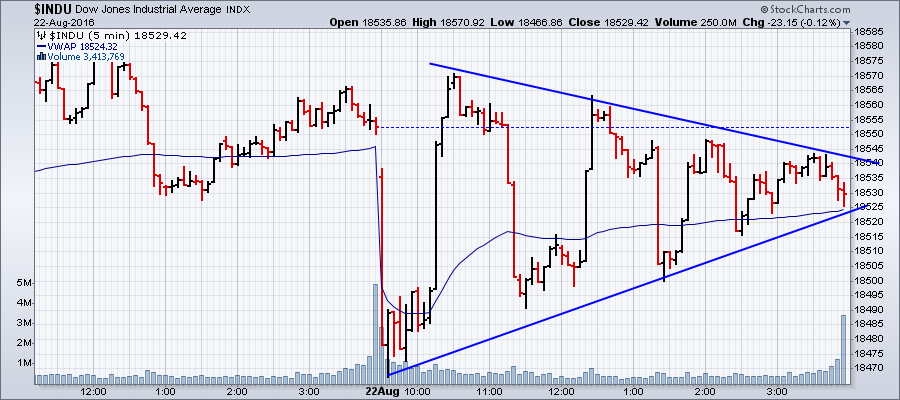
The Dow's Amazing Symmetric Triangle
The Dow did something strange and wonderful today on its intraday chart:
A perfect symmetric triangle pattern! But one with really strange jumps up and down throughout. Truly fascinating. Usually Symmetric Triangles are "Continuation" patterns, which typically break in the direction of the trend prior to their formation....
READ MORE
MEMBERS ONLY
Where is Everybody? Low Volume Continues to Plague the Markets
Hello Fellow ChartWatchers!
Where is everybody? Things look pretty darn good on the weekly index charts:
* Stocks are at or near new all-time highs.
* The Tech sector is showing signs of life.
* Energy stocks are roaring up the SCTR rankings
* The "New Highs-New Lows Line" is moving higher...
READ MORE
MEMBERS ONLY

On Conferences (and Why Ours is Better!)
Hello Fellow ChartWatchers!
So as I write this, I’m crammed into seat 18F on the red-eye back to Seattle. I can barely type on my laptop thanks to the wonderful people all around me. It’s not their fault, but I’m about to ask the flight attendant if...
READ MORE
MEMBERS ONLY
Are You A Chart Watcher?
Hello Fellow ChartWatchers!
Are you a watcher of charts? By that I mean how much do you trust what you see on price charts? Do you trust the charts more than the commentary/opinion of others? Do you trust stories in the financial press more than what you see on...
READ MORE
MEMBERS ONLY
Ch-ch-ch-ch-Changes
Hello Fellow ChartWatchers!
Lots of changes in the wind these days both in the stock market and at StockCharts.com. Here's my 2 minute review of everything coming up over the next couple of months:
Big Volume Spike on Friday
Fridays are typically slow days for the market...
READ MORE
MEMBERS ONLY
Summary of Recent Scanning Webinars
Hello Fellow ChartWatchers!
The markets continue to move sideways with declining volume - both in the long-term view and in the short-term view. Since April, the Dow has been content to drift aimlessly between 17,500 and 18,000. Similarly, the S&P 500 is vacillating between roughly 2050...
READ MORE
MEMBERS ONLY
Four Things All StockCharts Users Need to Know
Hello Fellow ChartWatchers!
Short Version: The Dow continues moving lower. The upcoming death of Flash means everyone is getting the new version of ChartNotes. You really need to sign up for ChartCon 2016 soon. We have 10 once-in-a-lifetime seats available if you want to see ChartCon 2016 in person.
1....
READ MORE
MEMBERS ONLY
My New Favorite Page on StockCharts.com
Hello Fellow ChartWatchers!
The market moved lower this week, retreating from its failed assault on the highs of last August. Optimists can conclude that more consolidation is needed before the market will be ready to put in new highs. Last week's earnings announcements certainly played a roll as...
READ MORE
MEMBERS ONLY
Taking Note of the New ChartNotes Annotation Tool
Hello Fellow ChartWatchers!
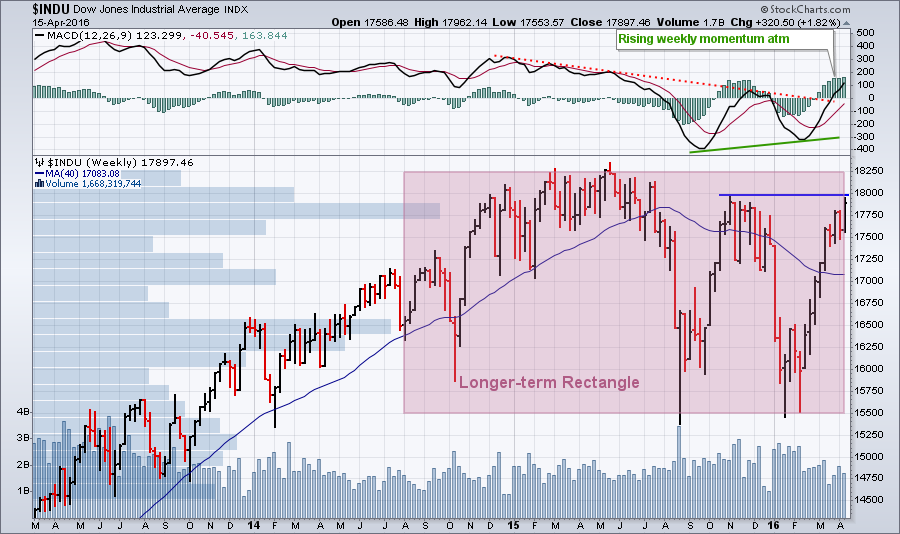
After pausing 5 days to catch its breath, the Dow powered higher this week and is close to breaking overhead resistance from the peak set last November. In addition, the Dow's 50-day Moving Average looks set to move back above its 200-day Moving Average -...
READ MORE
MEMBERS ONLY
ChartCon 2016 is Coming to a Computer Near You!
Hello Fellow ChartWatchers!
The markets continue to power higher with the S&P 500, Nasdaq and Wilshire 5000 all joining the Dow Jones Industrials in the "Above the 200-Day Moving Average" club. The Dow is now challenging its big overhead resistance area around 17,750. Last November,...
READ MORE
MEMBERS ONLY
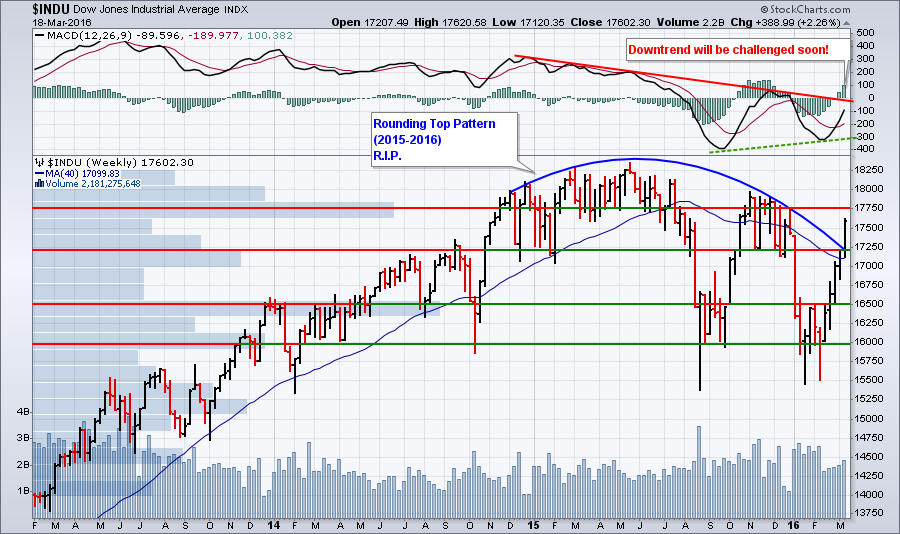
There's No Such Thing as "Overbought"
Hello Fellow ChartWatchers!
Well, I don't know about you, but I'm impressed. Last week, the current rally moved higher and gained more momentum. After briefly (very briefly) pausing at its 200-day moving average, the Dow surged higher and obliterated the rounding-top concept I've talked...
READ MORE
MEMBERS ONLY
Up Next: A Stock Market Showdown!
Hello Fellow ChartWatchers!
After an unexpectedly quick rise in stock prices this week, the markets are poised for a showdown. It's too bad we can't have the stock market be more like an athletic event...
In this corner, weighing in at 200-days in length, our long-term,...
READ MORE
MEMBERS ONLY
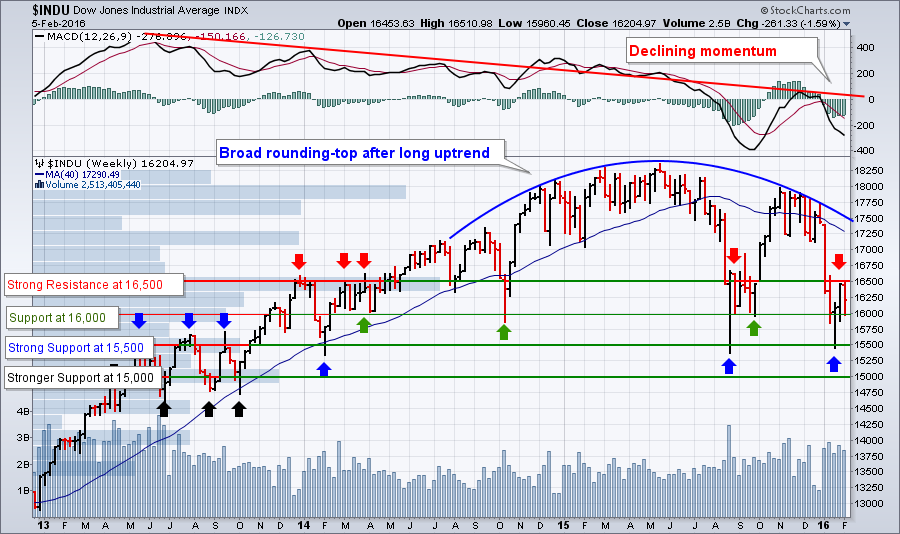
Two Weeks Later and Not Much Has Changed
Hello Fellow ChartWatchers!
I know, I know. I've shown the same chart again and again recently. Well, apologies in advance, but here it is one more time:
I'm showing it again because I really think it can keep you grounded in the face of emotional short-term...
READ MORE
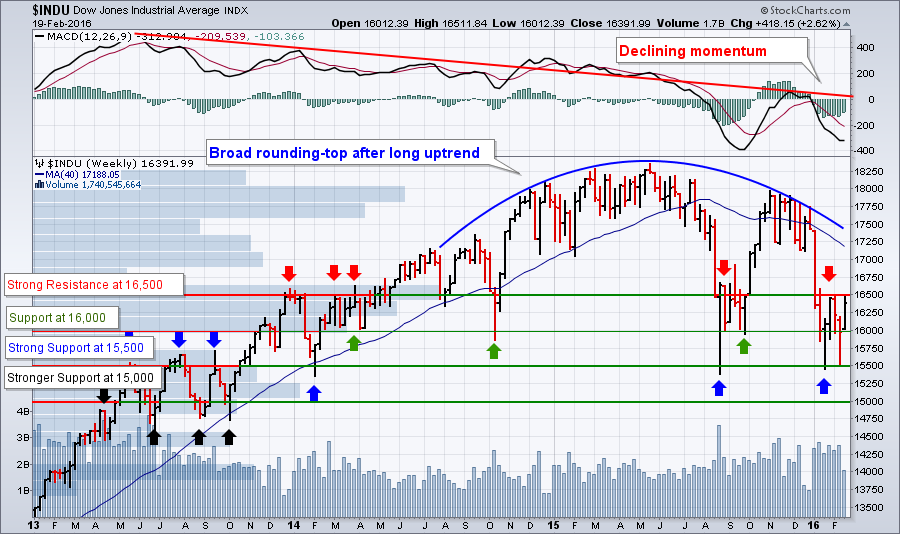
MEMBERS ONLY
The Market is in a Classic Bull/Bear Battle Right Now
Hello Fellow ChartWatchers!
Wow, people are all over the place with their emotions right now. "Devastating Recession on the Way!" "Strong Tech Earnings Lead to Rally Mode!" "The Fed is Out to Kill the Economy!" and my personal favorite "Head and Shoulders Top...
READ MORE
MEMBERS ONLY
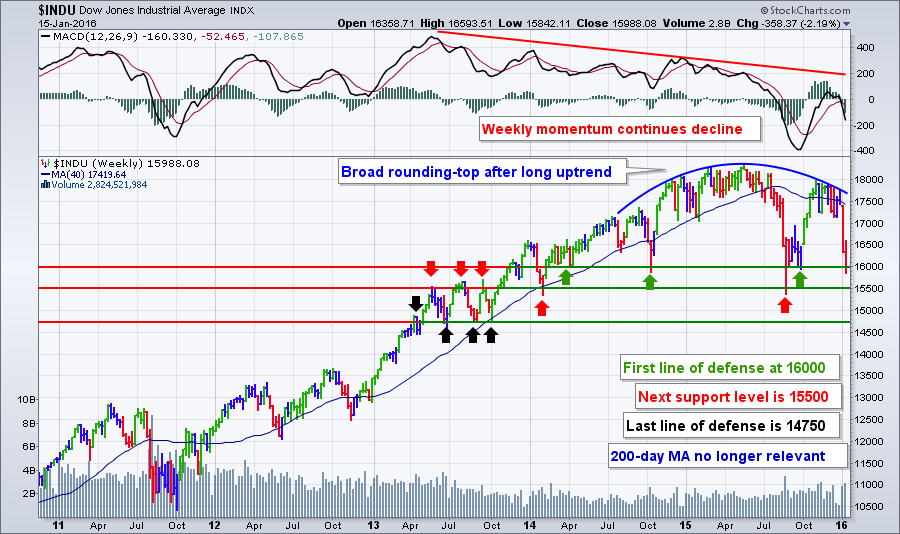
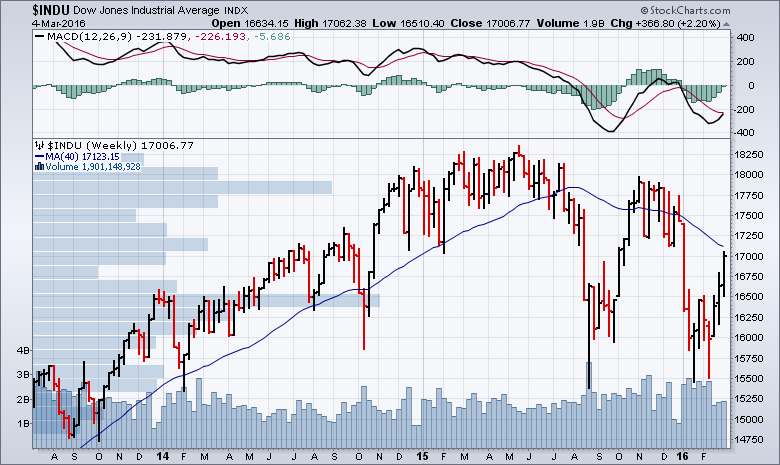
The One Where a 4-month Setback Freaks Everyone Out
Hello Fellow ChartWatchers!
It was "back to the future" time for the markets this week with the Dow falling over 350 points and ending up just below 16,000. This has caused lots of consternation and teeth-gnashing in the mainstream financial press, but let's back up...
READ MORE
MEMBERS ONLY
Looking Back and Looking Forwards into 2016!
Hello Fellow ChartWatchers!
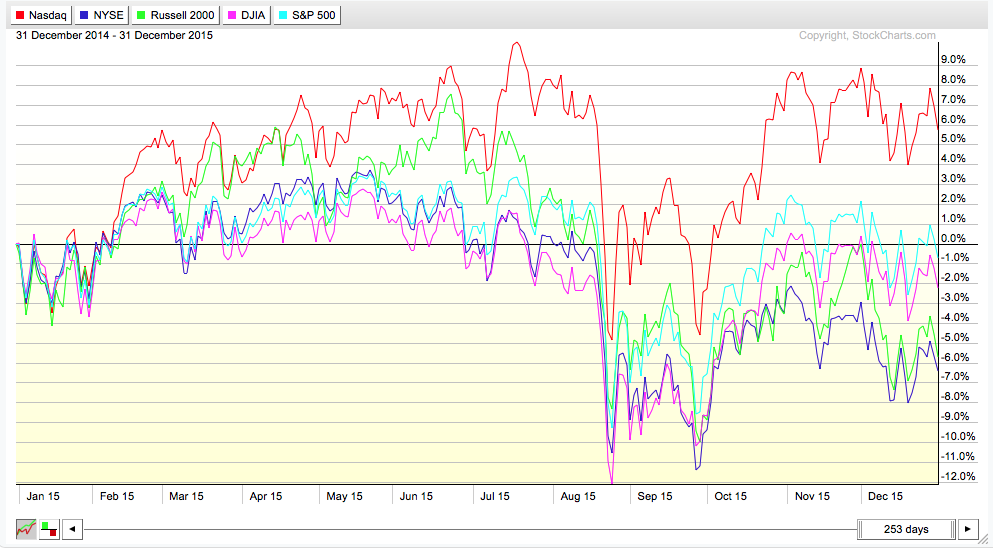
Happy New Year to you and yours. Here are the results for last year in PerfChart form:
All-in-all, bleh. The Nasdaq outperformed everyone else - mainly because of a spurt back in February. In reality, everything has been negative since the start of March. When both the...
READ MORE
MEMBERS ONLY
Don't Fight the Fed (or the MACD, or the Summation Index, or...)
Hello Fellow ChartWatchers!
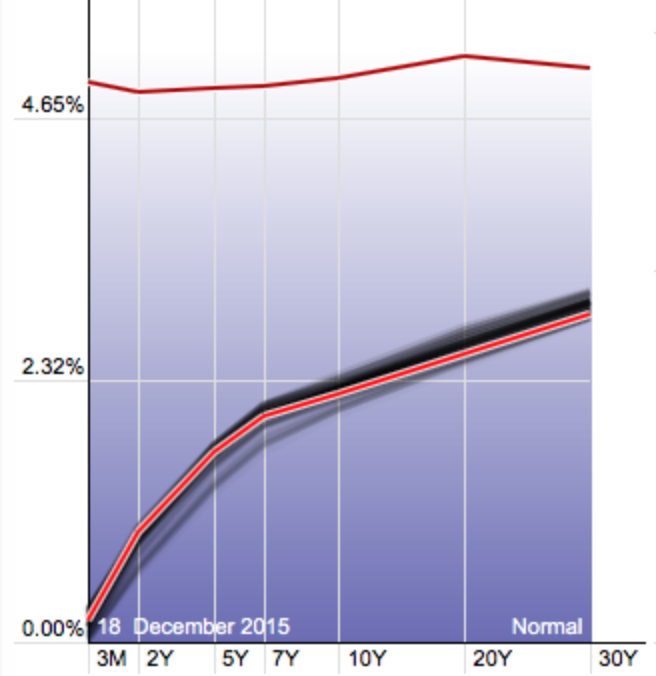
Welcome back to reality - just in time for Christmas! Reality is a place where interest rates are not stuck at zero. It's a place where the yield curve actually moves from time-to-time. It's a place we all know that we need to...
READ MORE
MEMBERS ONLY

Taking Full Advantage of StockCharts.com's Holiday Special
Hello Fellow ChartWatchers!
Well, it's that time of year again - time to save a bunch of money on your StockCharts membership! As long-time members know, we usually run our Holiday special during the month of December and that is usually a great time to take advantage of...
READ MORE
MEMBERS ONLY

Taking Full Advantage of ChartLists
Hello Fellow ChartWatchers!
The markets had a very good week last week and are trying to climb above lots of built-up resistance from earlier in the year. On the Dow chart, that means that the index struggles each time it nears 18,000 - something it is doing once again....
READ MORE
MEMBERS ONLY
The Stock Trader's Almanac for 2016 is Here!
Hello Fellow ChartWatchers!
We're pretty busy today re-vamping our network security systems so I only have time for a quick post with two important points:
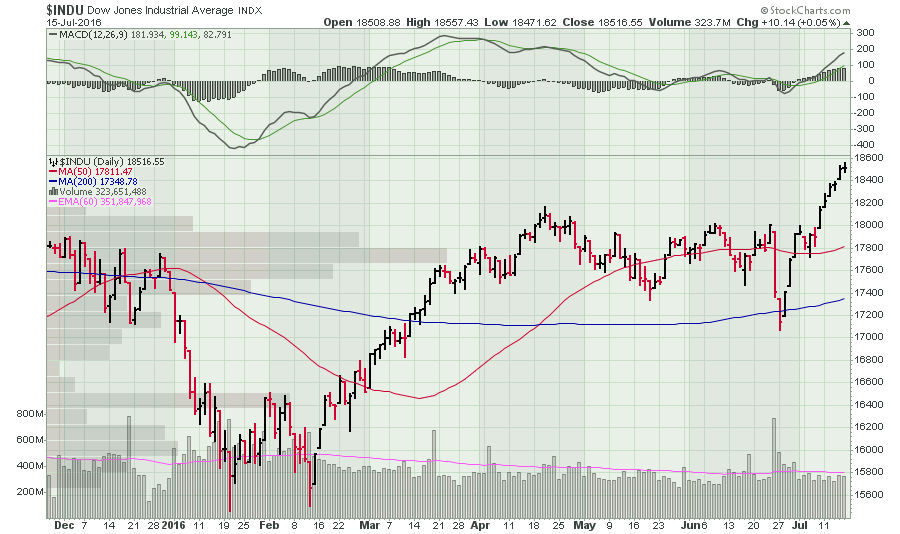
1.) The Dow has shot up a ton recently and is ready for a pull-back.
The MACD line shows faltering momentum - specifically,...
READ MORE
MEMBERS ONLY
I'm Not Convinced By Friday's Rally. Are You?
Hello Fellow ChartWatchers!
Friday's market action is causing quite a buzz in the financial analysis world. After the "meh" US jobs report came out Friday morning, stocks gapped down sharply at the open but then rallied throughout the day and finished up roughly 1.5% (depending...
READ MORE
MEMBERS ONLY
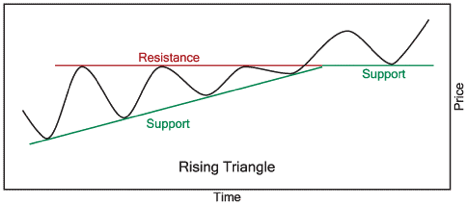
Ascending Triangle (Bullish) or Ascending Wedge (Very Not Bullish)?
Hello Fellow ChartWatchers!
The Fed's announcement on Thursday was the big news of the week both fundamentally and technically. Prior to the announcement, stocks had moved up nicely. After the announcement, those gains were all given back and then some. It was a pivotal moment. In a flash,...
READ MORE
MEMBERS ONLY
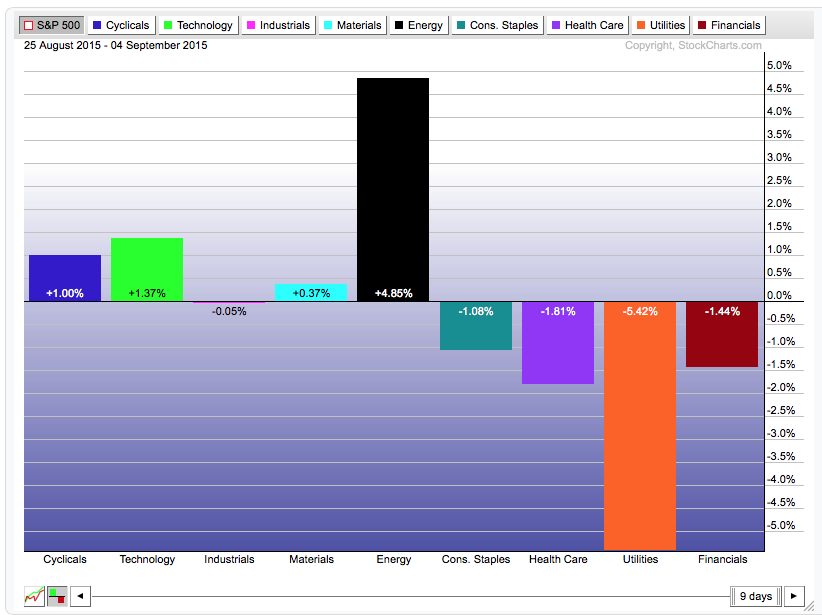
August 25th - the Birth of a New Market?
Hello Fellow ChartWatchers!
We have lots to talk about since our last newsletter! For those of you who have been watching the "ChartWatchers LIVE" webinar, you know that for almost three months prior to the recent market collapse on August 19th, we had been expressing concerns over the...
READ MORE
MEMBERS ONLY
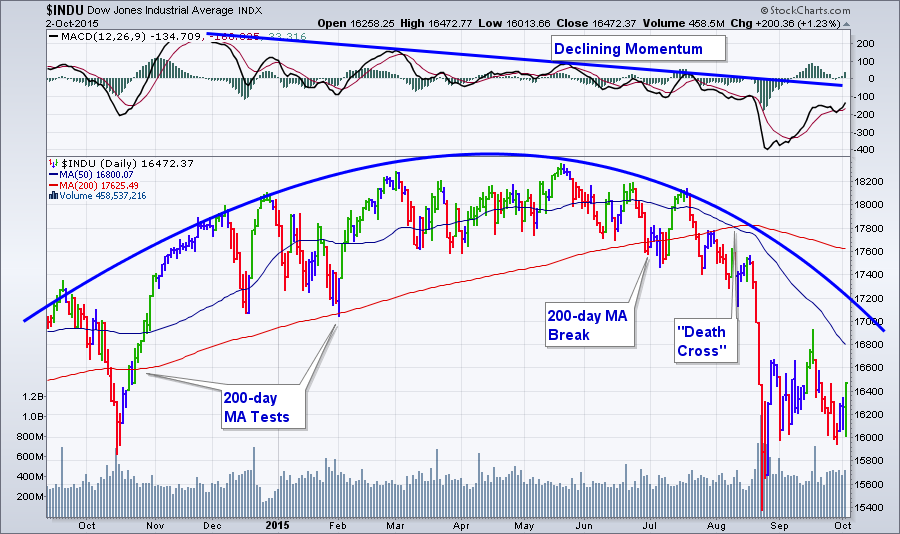
Text Book Rollover Continues in US Markets with Dow Industrials Leading the Way
Hello Fellow ChartWatchers!
The US markets continue to s-l-o-w-l-y roll over with the Dow Industrials leading the way. Despite the fact that $INDU moved 100 points higher this week, the intermediate to long-term trend is clearly down. Lots of people talked about the "Death Cross" that occurred on...
READ MORE
MEMBERS ONLY
Acting on Impulse with Elder Impulse Bars
Hello Fellow ChartWatchers!
It was a fairly positive week for the markets last week following a big down move during the week before. For the month of July, the Nasdaq was the big winner rising 2.3% and the Russell 2000 was the loser falling 1.4%.
(Click the chart...
READ MORE
MEMBERS ONLY
Why You Really Should Watch our Webinars
Hello Fellow ChartWatchers!
The stock market moved higher this week on good earnings news - but it is too early to conclude that the Bull are firmly back in charge. Why? One word - breadth. Breadth and momentum. OK, sorry, two, two words - breadth, momentum and seasonality. THREE! Three...
READ MORE
MEMBERS ONLY
Finding Strengthening Strength
Hello Fellow ChartWatchers!
You know, sometimes we overthink things. Actually, in the realm of Technical Analysis, overthinking things is an epidemic! People are constantly asking us for more indicators, more tools, more features more data - more, more, more! "If I just have this one additional thing, then I...
READ MORE
MEMBERS ONLY
Scanning with SCTRs for Fun and Profit!
Hello Fellow ChartWatchers!
The markets continue to lose momentum and carve out toppish type patterns on the main index charts. We, on the other hand, continue to crank out webinars with great commentary and content for chartists like yourself. Have you seen any of our recent ones? No? Good news!...
READ MORE
MEMBERS ONLY
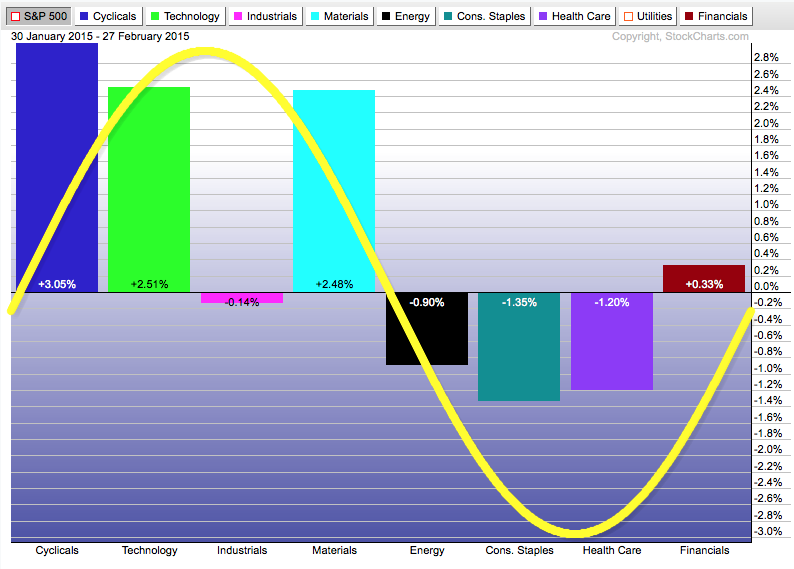
Sector P/E Ratios Fall Into Two Groups
Hello Fellow ChartWatchers!
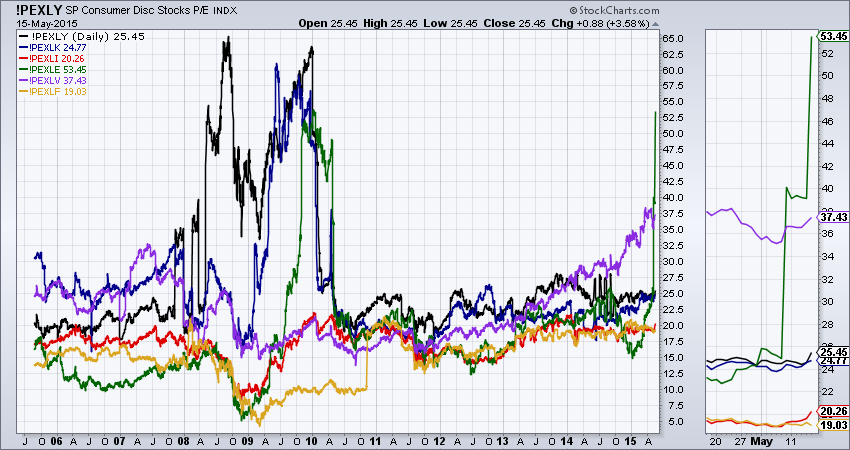
Last time I reviewed our PE Ratio symbols for several major indexes (!PEDOW,!PESPX, !PEOEX, and !PENDX) and promised that this time around I'd show you the PE Ratio symbols we have for the nine S&P Sectors. Promise fulfilled!
(click for live version)...
READ MORE
MEMBERS ONLY
Index P/E Charts Can Show You If the Market is Too Expensive Right Now
Hello Fellow ChartWatchers!
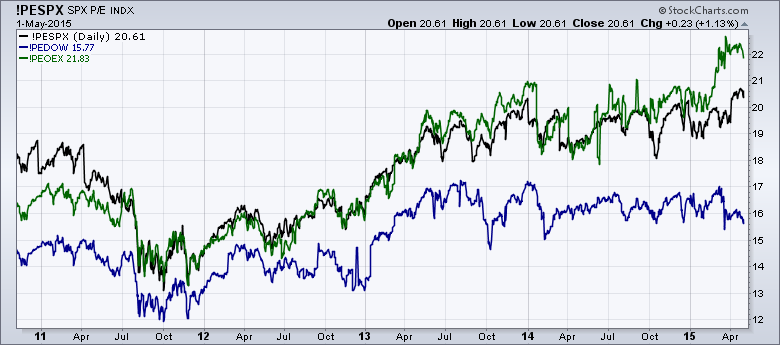
Is the market too expensive right now? Our P/E ratios for the various market indexes can show you the answer to that question. Currently, we have P/E values for the following indexes:
* The Dow (!PEDOW)
* The S&P 500 (!PESPX)
* The S&P...
READ MORE
MEMBERS ONLY

Welcome to "Wyckoff Power Charting with Bruce Fraser"!
Today I am very happy to announce the start of another great new blog on StockCharts.com - "Wyckoff Power Charting with Bruce Fraser."
For those of you that do not know Bruce, he has been teaching graduate level courses on Technical Analysis (and Wyckoff Analysis in particular)...
READ MORE
MEMBERS ONLY
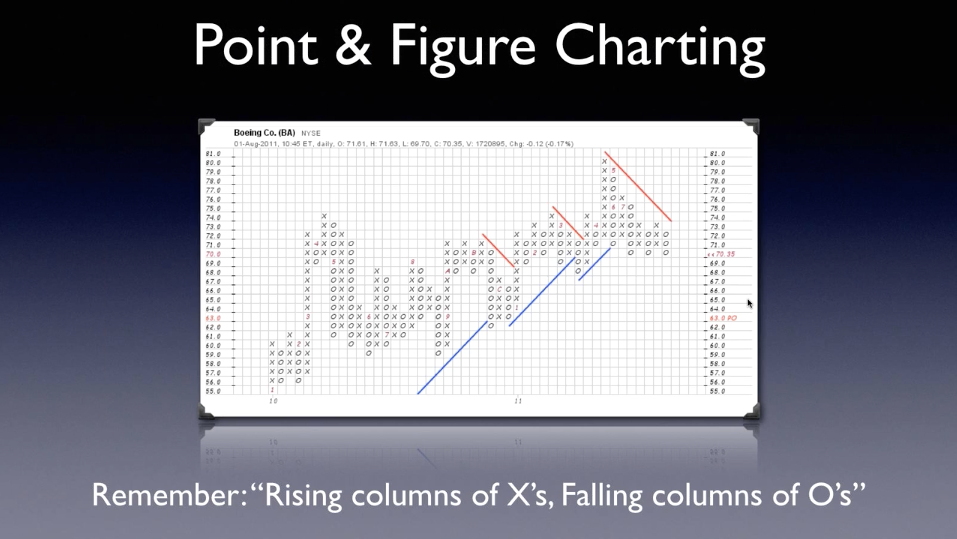
Getting the Point of Point & Figure Charts
Hello Fellow ChartWatchers!
Over the past couple of weeks, we been revamping our Point & Figure charting tool. The new version was released last week. It has several key improvements including:
* You can now add up to 6 chart overlays per chart
* You can save your settings as the "...
READ MORE
MEMBERS ONLY
Why Look At Other Stocks? Using SCTRs to Narrow Your Search for Winning Stocks
Hello Fellow ChartWatchers!
The other day I was out with my Dad and he said "Boy, the market has been really volatile recently hasn't it?" And I said "Umm, not really. Where did you hear that?" "All the cable news channels are talking...
READ MORE
MEMBERS ONLY
Free Market Analysis! Get your Free Market Analysis Right Here!
Hello Fellow ChartWatchers!
The market gave back ground this week, especially on Friday as a good Jobs report led to fears that the Federal Reserve would raise interest rates soon. It definitely seems like a turning point in the market just occurred as the Sector Rotation picture is now muddier....
READ MORE
