MEMBERS ONLY
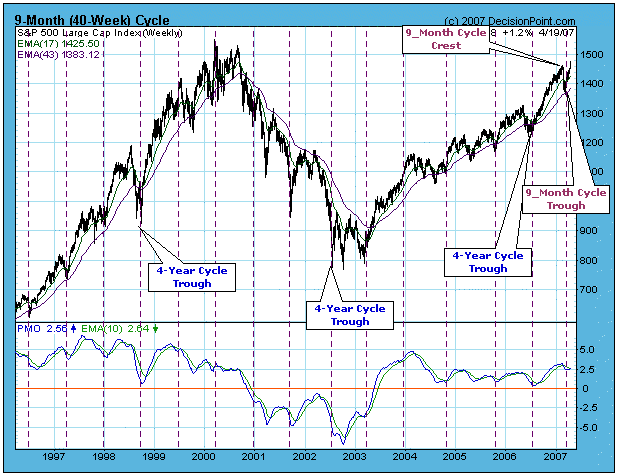
CYCLE ORIENTATION IS BULLISH
Back in November 2006 I speculated that the 4-Year Cycle trough had arrived in June/July 2006, and that the implication was bullish for stocks - bullish because we normally expect an extended rally out of those cycle lows. At this point, I think that assessment is proving to be...
READ MORE
MEMBERS ONLY
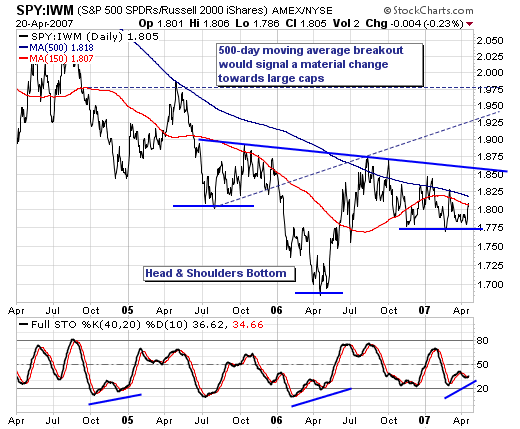
STOCK MARKET SEEING "ROTATION"
The positive stock market rally is undergoing significant "rotation" within various indices, which in our opinion is quite important from both an investment and trading perspective. First, when we invest or trade, we want to run with the "fastest horses" in order to outperform the markets...
READ MORE
MEMBERS ONLY
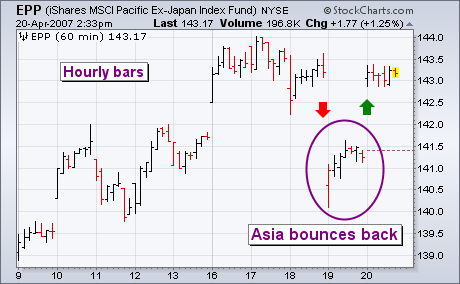
ASIA RECOVERS
Thursday's 4.5% drop in Chinese stocks caused nervous selling in other Asian markets. By the time the U.S. market opened, however, Europe had already started to recover and initial U.S. losses were modest. By day's end, the Dow had closed at a new...
READ MORE
MEMBERS ONLY

MORE SPEED LEADS TO HUGE SLOW DOWNS
The markets did great this week with the Dow hitting record highs and closing in on 13,000 however almost no one here at StockCharts.com was paying much attention. As most ChartWatchers know, we spent much of the week wrestling with technical glitches. I thought I'd take...
READ MORE
MEMBERS ONLY
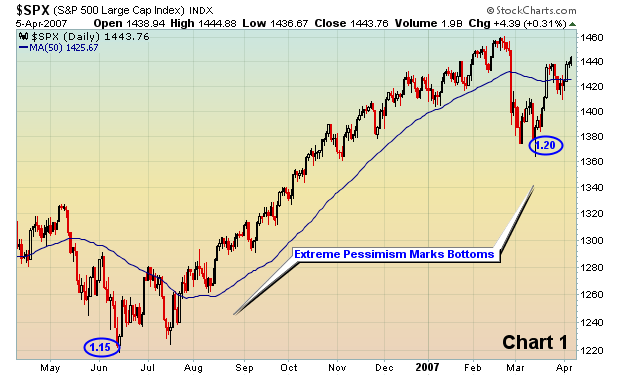
USING THE PUT CALL RATIO
The put call ratio ("PC") is quite simply the total number of put options divided by the total number of call options. These options include both individual equity options and index options. Every day you can monitor the relationship between put options and call options at www.cboe....
READ MORE
MEMBERS ONLY
UP SWING CONTINUES
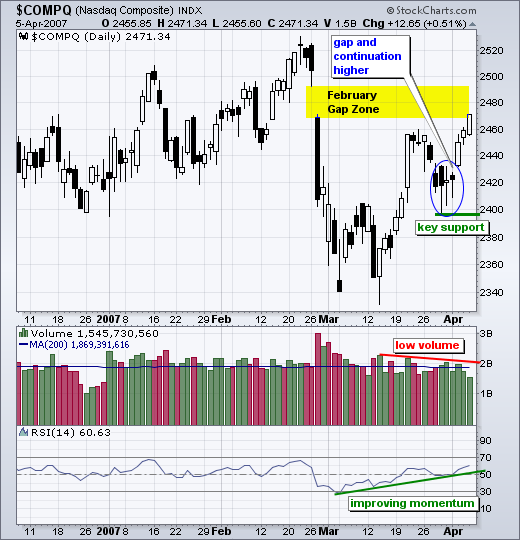
The Nasdaq rally continued into its fourth week with a gap up on Tuesday and move into the late February gap zone. This late February gap started a sharp decline to the March lows and the recovery back above 2460 is quite impressive. Even though volume is not so impressive,...
READ MORE
MEMBERS ONLY
THRUST/TREND MODEL NEARS BUY SIGNAL
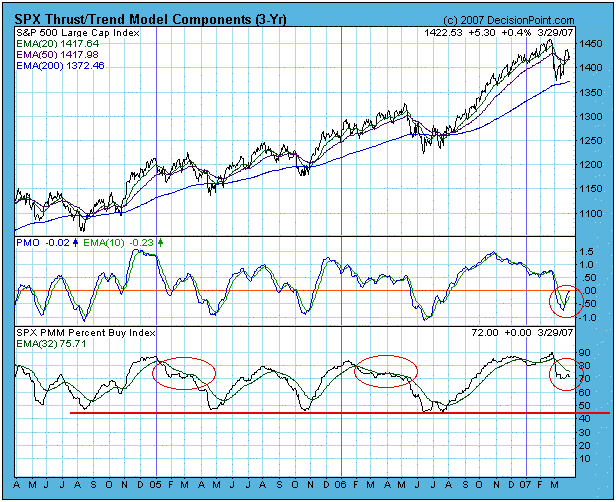
Our Thrust/Trend Model (T/TM) is so-named because it treats bottoms and tops differently - tops tend to be rounded trend changes, and bottoms tend to be formed by sharp changes in direction accompanied by internal up thrusts. At price tops, T/TM changes from a buy to neutral...
READ MORE
MEMBERS ONLY
LOOKING AT CRUDE OIL
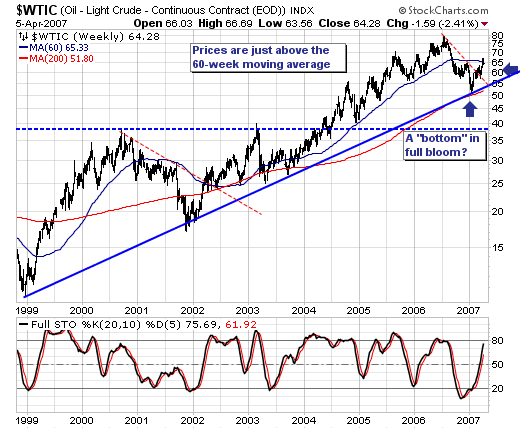
For the past couple of weeks, the markets have focused in upon crude oil prices and their attendant rise given the Iran hostage situation. The prevailing thought was that "geopolitical premium" was on the order of $4-to-$5 a barrel of the $67/barrel price; and that once...
READ MORE
MEMBERS ONLY
CHILLER INSTALLATION THIS WEEK!
Regular readers know that we've been trying to complete a big upgrade to our server room for almost a year now. It's been extremely frustrating dealing with the various powers-that-be about completing things, but we are on the verge of the last big step in the...
READ MORE
MEMBERS ONLY
EURO HITS TWO-YEAR HIGH AGAINST DOLLAR
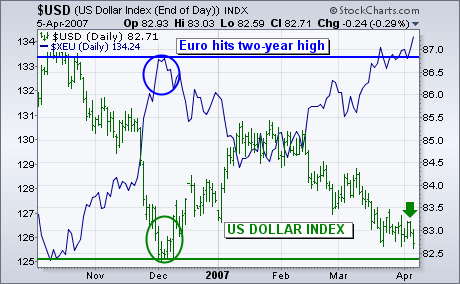
The U.S. Dollar Index fell during the week and is drawing dangerously close to last December's low (green circle). The foreign currency with the biggest influence on the USD is the Euro. Expectation for continuing economic strength in Europe - and the likelihood for further ECB rate...
READ MORE
MEMBERS ONLY
WHICH CHARTS DO I LOOK AT?
Hello Fellow ChartWatchers!
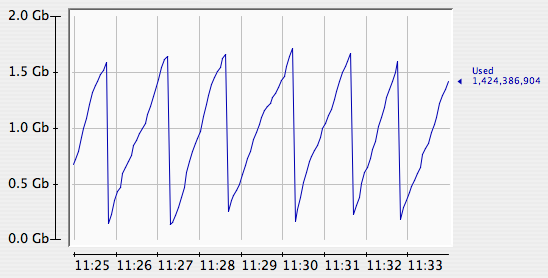
This week I thought we'd look at something different - the charts that matter the most to me personally. Now, brace yourself... these charts are not financial charts. Nope. These are the charts that tell us at an instant how well the StockCharts.com website...
READ MORE
MEMBERS ONLY
KEY SECTORS SHOW RELATIVE WEAKNESS
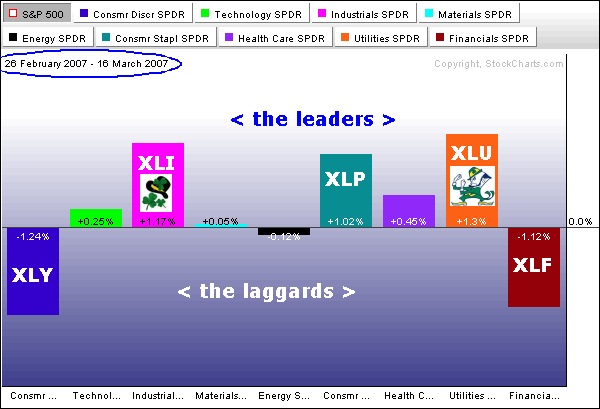
The sector rotations since 26-Feb reflect a defensive and nervous market. Things started changing on Wall Street with the sharp decline on 27-Feb and the PerfChart below shows sector performance since this decline. The Utility SPDR (XLU), the Industrials SPDR (XLI) and the Consumer Staples SPDR (XLP) are the strongest...
READ MORE
MEMBERS ONLY
ARE WE BEAR YET?
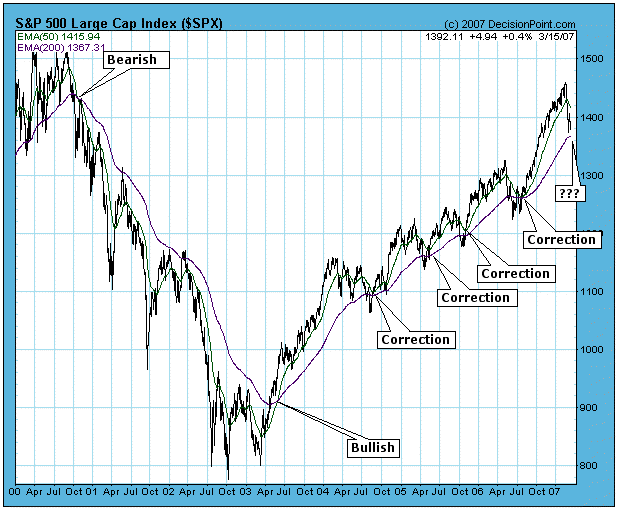
One of my colleagues has been harassing me (in a friendly way) for not yet having declared myself a bear. The truth is that top picking is a treacherous business, and I have given it up in favor of letting trend models make my declarations for me. For example, I...
READ MORE
MEMBERS ONLY
REVIEWING THE "YEN-CARRY TRADE"
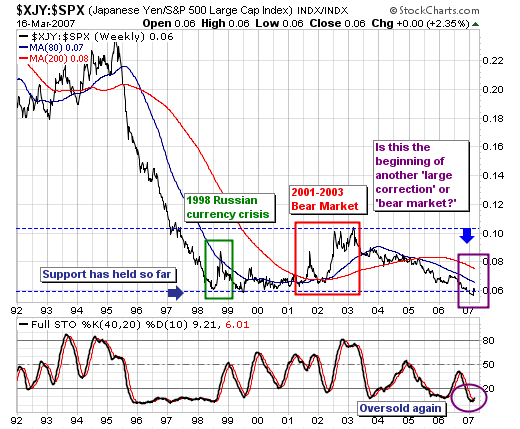
The recent focus of the equity markets is upon the "sub-prime" mortgage problem; and upon the "yen-carry trade". We think both are valid concerns; however, the question of the "yen-carry trade" is more important in our mind than the "sub-prime implosion." Perhaps...
READ MORE
MEMBERS ONLY
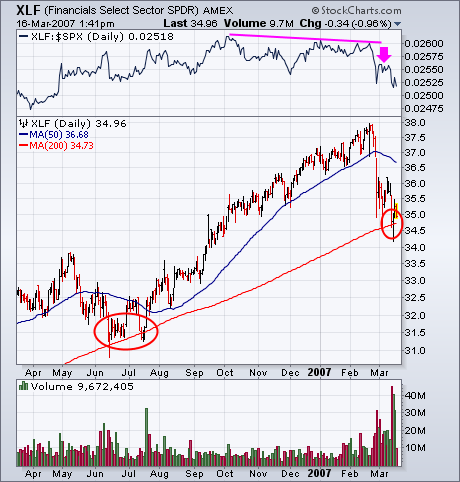
FINANCIALS HOLD THE KEY TO THE MARKET
It's no secret that one of the main problems pulling the market down over the last month has been the fallout from subprime mortages. It's also no surprise to read that financial stocks (mainly banks and brokers) have been the weakest part of the market over...
READ MORE
MEMBERS ONLY
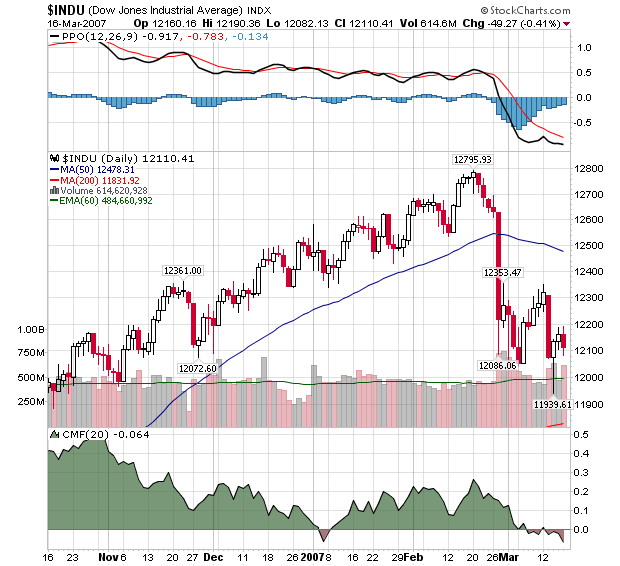
MARKET'S FIRST RECOVERY ATTEMPT FAILS
Hello Fellow Chartwatchers!
Last week's recovery rally was crushed by Tuesday's big decline and while the Dow quickly rose back above 12,000, the technical damage was done. The chart below shows the important technical developments for the Dow in recent days. See if you can...
READ MORE
MEMBERS ONLY
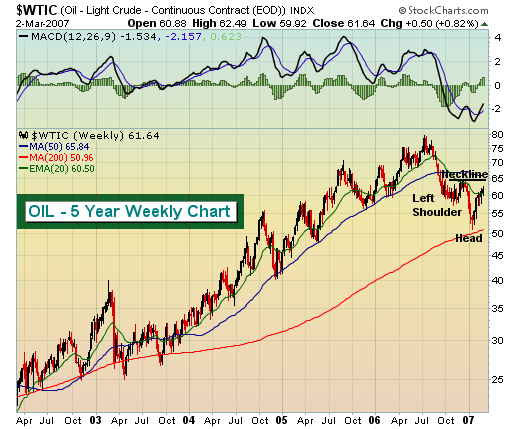
ENERGY - A BULLISH VIEW
We have been in the bearish camp on energy and over the past several months and for now remain on the bearish side. But anytime you take a position on the bullish or bearish side, you need to realize patterns that could change your view. The price of oil broke...
READ MORE
MEMBERS ONLY
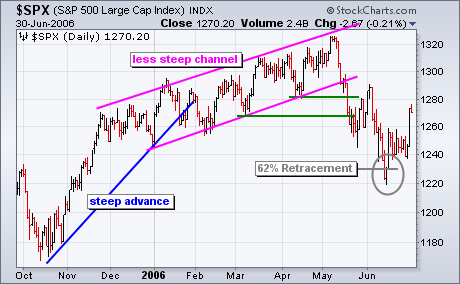
CORRECTION AHEAD FOR S&P 500?
The current breakdown in the S&P 500 looks quite similar to the May-June 2006 breakdown. Let's look at the May-June 2006 break down first. The S&P 500 surged from mid October to mid December (2005) and then began a slower zigzag higher until early...
READ MORE
MEMBERS ONLY
UPDATED CRASH ANALYSIS
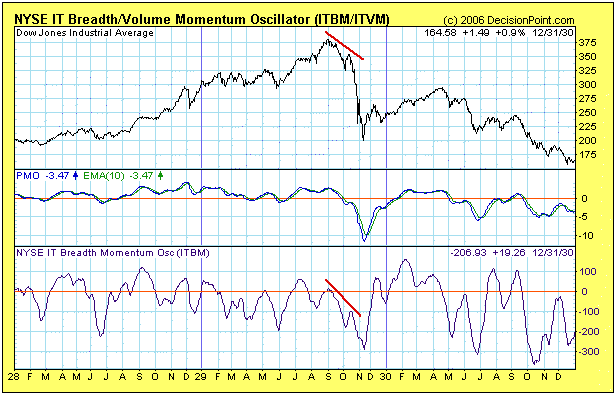
In light of this week's sharp decline (mini-crash?), the most obvious subject for discussion in this week's article is to question whether or not we are on the verge of another major crash. In my 12/8/2006 article, Crash Talk Is Premature, I stated:
"...
READ MORE
MEMBERS ONLY
RECENT DECLINE MORE THAN JUST A CORRECTION?
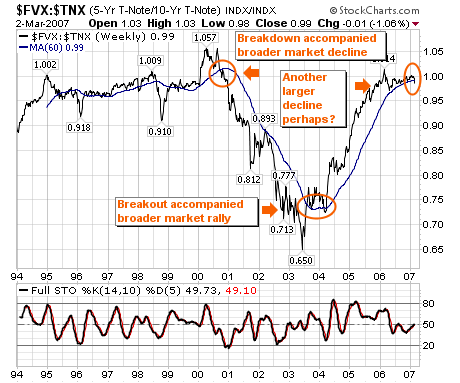
Last week's market decline was quite interesting from a number of perspectives. First, the decline clearly mirrors the movement in Japanese Yen as the "carry-trade" is unwound; if one watches these closely, one will see that stock traders are cleary focused on the yen. We will...
READ MORE
MEMBERS ONLY
YEN/EURO IS IN MAJOR SUPPORT AREA AND OVERSOLD
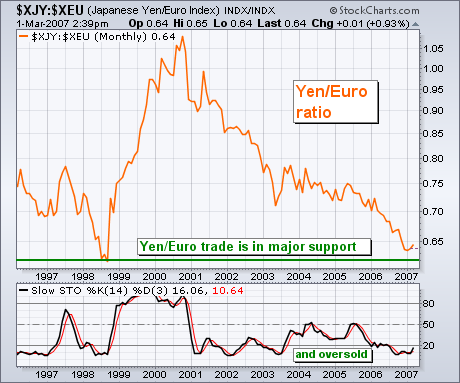
Our main concern here is the relationship between the world's strongest currencies and the Japanese yen. Since 2000, the world's strongest currency has been the Euro (followed by the Swiss Franc, Canadian and Aussie Dollars, and the British Pound. The yen has been the weakest global...
READ MORE
MEMBERS ONLY
P&F CHARTS PROVIDE PERSPECTIVE
Hello Fellow Chartwatchers!
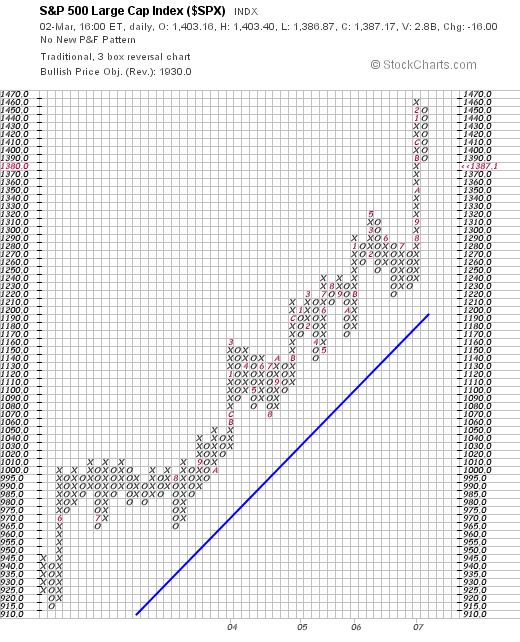
This week's market gyrations have caused many people to stop and question the market's current position - sometimes quite emotionally. In times like this I like to go back to basics and look at some of the most impartial charts out there -...
READ MORE
MEMBERS ONLY
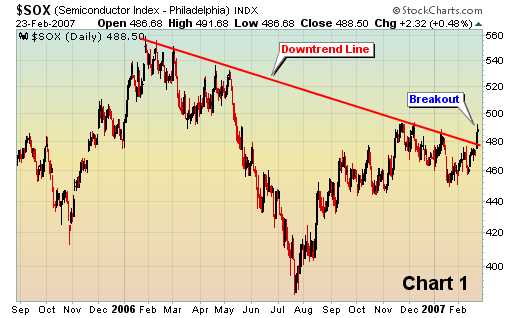
SEMICONDUCTORS FINALLY PROVIDING A LIFT
We have been very bullish the equity market for months and we continue to be. But one wild card has been the semiconductors. In order to truly sustain a nice market rally, we felt the semiconductors would need to participate. Well, we've been waiting...and waiting...and waiting....
READ MORE
MEMBERS ONLY
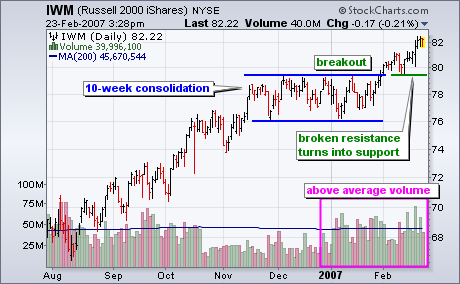
STRONG BUYING PRESSURE IN IWM
The Russell 2000 iShares (IWM) broke consolidation resistance this month and two key volume-based indicators point to strong buying pressure.
The first chart shows the Russell 2000 iShares (IWM) and volume. The ETF surged from mid August to mid November and then consolidated for 10 weeks. This consolidation represents a...
READ MORE
MEMBERS ONLY
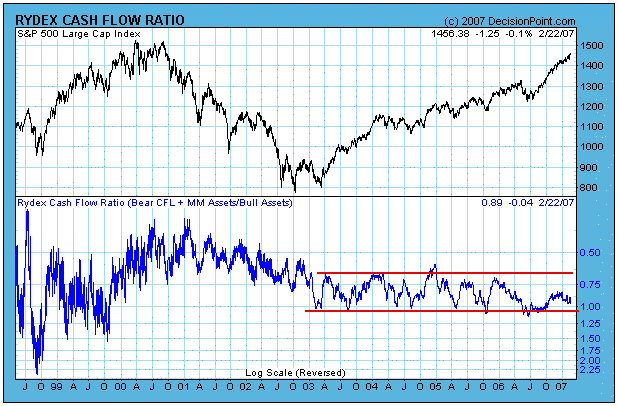
A NEW OPINION ON RYDEX CASH FLOW
In my 2/16/2007 article, Cash Flow Shows Wall of Worry, I asserted that the dearth of bullish Rydex cash flow was a sign that the rally would probably continue because the bulls were still not committing in a big way. For the sake of variety I try not...
READ MORE
MEMBERS ONLY
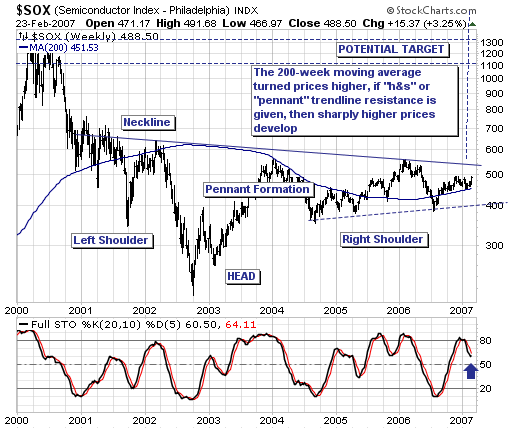
HAVE THE SEMICONDUCTORS BECOME "DEAD MONEY"?
The technology rally from July-to-present has occurred without the participation of the Semiconductor Index ($SOX). We find this rather "odd" to be sure, for one of the basic tenets of any broader market rally were that they were led in general by the technology sector, and more specifically...
READ MORE
MEMBERS ONLY
ONE OF THE NICEST KUDOS WE'VE SEEN!
Someone, we honestly don't know who exactly, sent us the following feedback earlier this week. It completely blew us away:
"I'm astonished at how customer friendly your service, website, and daily charts are. Thank you, thank you, thank you. This is my first day with...
READ MORE
MEMBERS ONLY
COMMODITY PRICES ARE RISING AGAIN
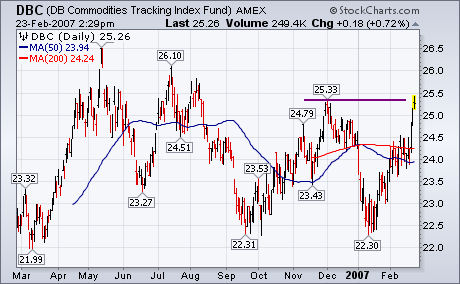
Just when it seemed like inflation was on the wane, another rally in commodity markets suggests just the opposite. [This week's unexpected jump in the core CPI also caught the market's attention]. Chart 1 shows the DB Commodities Tracking Fund (DBC) challenging its late November peak...
READ MORE
MEMBERS ONLY
PERCENTAGE ABOVE/BELOW THE EXPONENTIAL MOVING AVERAGE
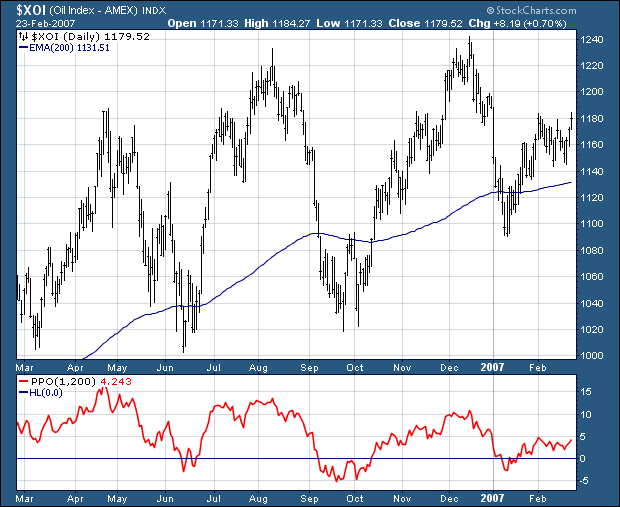
Mary W. writes "I'd like to see how much above or below the 200-day moving average a stock currently is. Does your charting system show that?"
While we don't have a specific indicator for "Percentage above/below the Moving Average", clever chartists...
READ MORE
MEMBERS ONLY
TRANSPORTS LOOKING SOLID
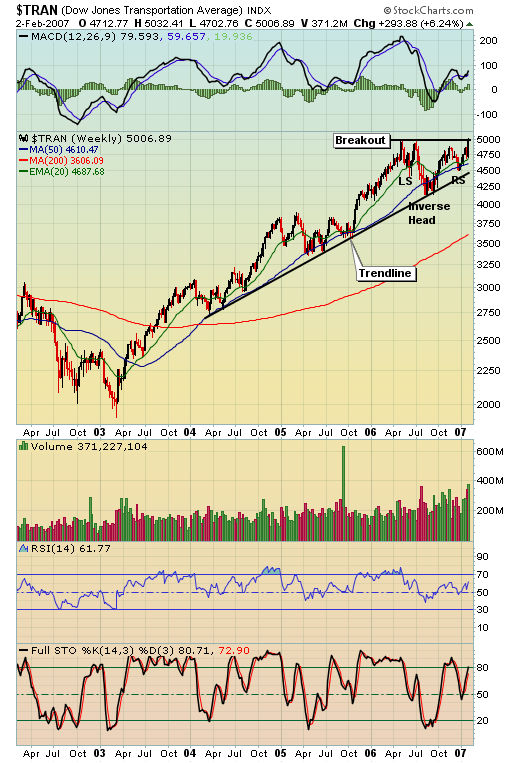
Money generally rotates from one sector to another. Identifying the rotation early in the cycle can make a big difference in trading successfully. If you look at a long-term chart of the Dow Jones Transportation Index (below), you'll see that the group has been trending higher for several...
READ MORE
MEMBERS ONLY
GETTING CHOOSY
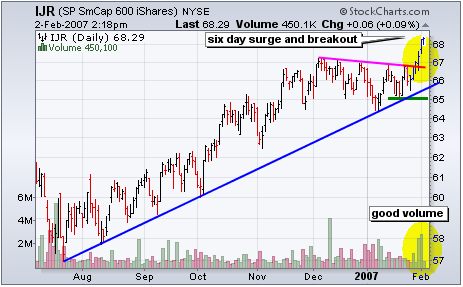
The S&P Small-Cap iShares (IJR) hit a new all time high this week and led the market higher over the last six days. Just a few weeks ago, this group was lagging and relative weakness hung over the market The ETF broke above its December high and this...
READ MORE
MEMBERS ONLY
BOND TIMING
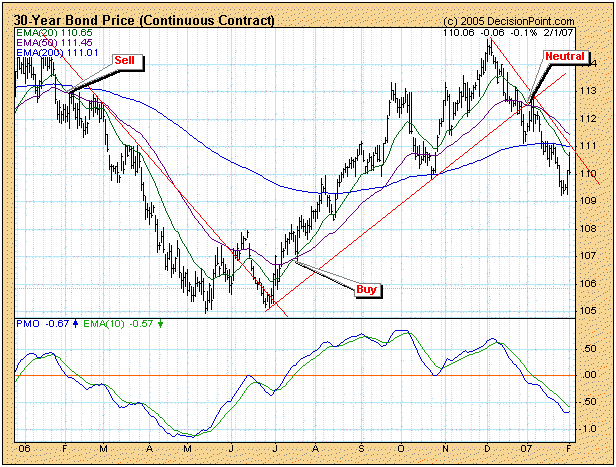
Timer Digest has ranked Decision Point #1 Bond Timer for the 52-week period ending 1/26/2007. We were also ranked #3 Bond Timer for the year 2006, and #5 Bond Timer for the last five years. Since past performance does not guarantee future results, this information is not particularly...
READ MORE
MEMBERS ONLY
SPY OUTPERFORMING XLY
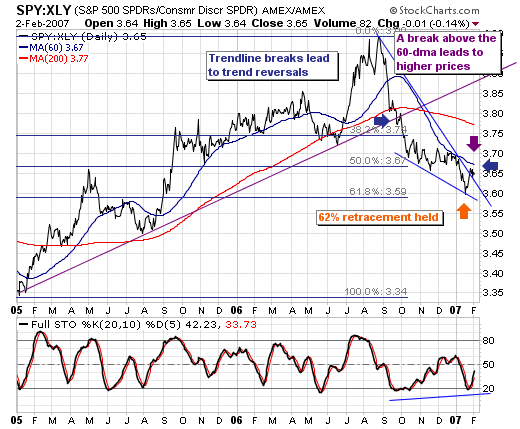
From our vantage point; the S&P 500 SPDR (SPY) is poised to outperform the Consumer Discrectionary SPDR (XLY) in all-time frames (short-intermediate-long), with a new highs expected to be reached in the late-2007 to 2008 time frame. Our reasoning is such:
* First, the fibonacci 62% retracement level was...
READ MORE
MEMBERS ONLY
SERVER ROOM, DATA FEED, CHARTSCHOOL
SERVER ROOM PROGRESS REPORT - We've had a bit of a set back on the construction front for our new server facilities. The building management team veto'd some of our construction plans at the last second (Chip was livid) and we are redesigning some things as...
READ MORE
MEMBERS ONLY
REVUE OF A SUCCESSFUL MOVING AVERAGE TECHNIQUE
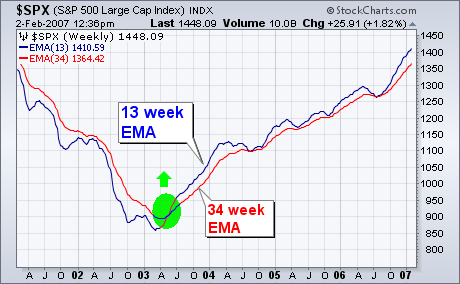
Last July, I reviewed a moving average technique that used weekly exponential moving averages. [I first described this system in October 2005]. I'm revisiting it today because it continues to do remarkably well. And I'd like to suggest expanding its usefulness. The technique is a moving...
READ MORE
MEMBERS ONLY
BULLISH ON BIOTECHS
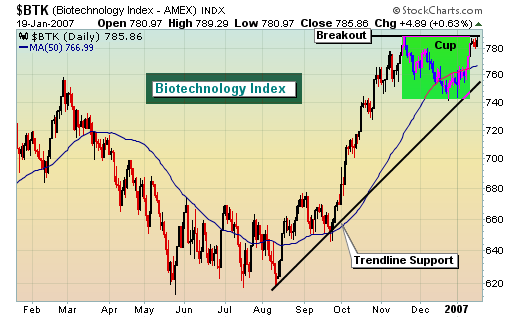
Healthcare stocks have been performing quite nicely over the past few weeks. Looking at the Biotech Index, it appears more bullishness is on the way for this sub-sector. After a nasty 20% selloff from March through May, biotechs stabilized during the summer months before beginning an uptrend that netted over...
READ MORE
MEMBERS ONLY

USO: OVERSOLD AND AT SUPPORT
The U.S. Oil Fund ETF (USO) remains in a clear downtrend on the daily chart, but became oversold and reached long-term support on the monthly chart. The combination of oversold conditions and support argue for at least a consolidation and quite possibly an oversold bounce back to broken support...
READ MORE
MEMBERS ONLY
ENERGY SECTOR CORRECTION ALMOST OVER
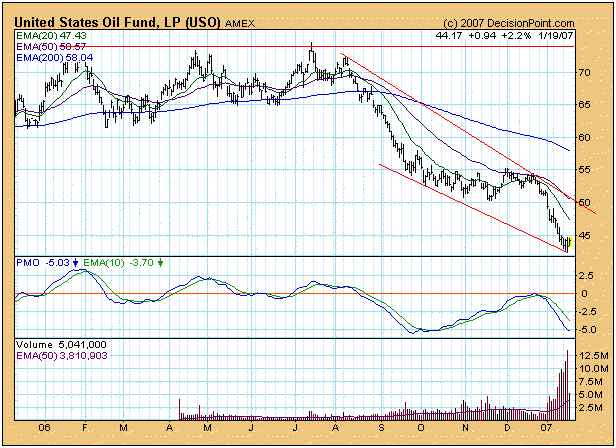
Energy stocks as represented by the Energy Spider (XLE) have been moving in a more or less sideways direction since crude oil topped out in July and entered a bear market. I find it peculiar that energy stocks have consolidated at the same time that crude oil was crashing, but...
READ MORE
MEMBERS ONLY
LOOKING AT A PAIRS TRADE
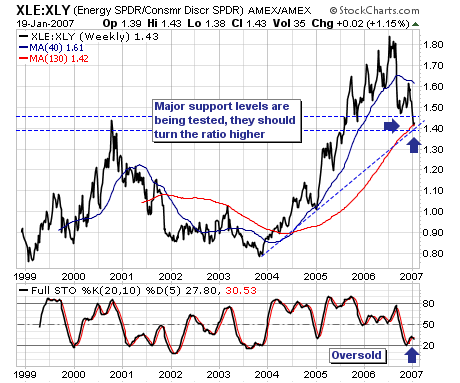
Today we want to look at a "pairs trade" theme we think has good fundamental and technical merit; it is a "long energy/short consumer discretionary shares" trade. Recently, we have begun to put this trade on in various ways; and one that we intend on...
READ MORE
MEMBERS ONLY
NASDAQ HOLDS 50-DAY LINE...NYSE NEARS HIGH
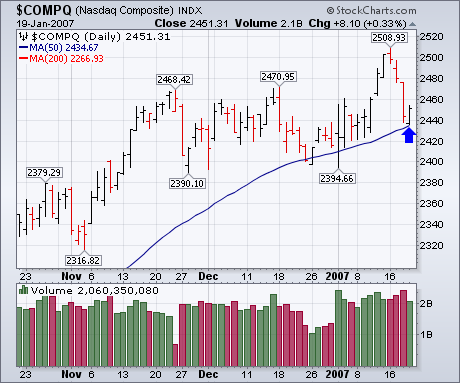
The market closed the week on an upnote. The most important action took place in the Nasdaq market which bounced off its 50-day moving average (Chart 1). Broader market measures have held up much better. Chart 2 shows the NYSE Composite Index ending the week just shy of its old...
READ MORE


