MEMBERS ONLY
WHAT HISTORY TEACHES US
Hello Fellow ChartWatchers!
Did you know that this is the most important time of the year for ChartWatchers that are looking to invest for the mid- to long-term? It is. Mention the month October to many investors and you will see them grow pale. "What about the 554 point...
READ MORE
MEMBERS ONLY
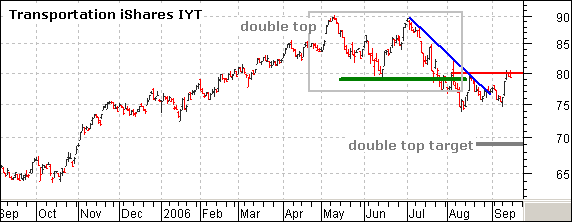
TRANSPORTS NOT OUT OF THE WOODS YET
The Dow Transportation iShares (IYT) recovered nicely this week, but the ETF is meeting resistance from broken support and a little more work is required for an upside breakout. On the daily chart, IYT formed a double top and confirmed this bearish reversal pattern with a break below the June...
READ MORE
MEMBERS ONLY
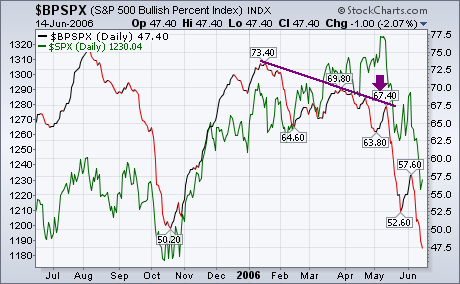
MARKET OVERBOUGHT BUT SENTIMENT STILL FAVORS BULLS
The S&P 500 Index is approaching new 52-week highs, but there is short-term overhead resistance immediately ahead, and our primary medium-term indicators are becoming modestly overbought. Does this spell trouble for the bulls? Probably not. Overbought conditions are not necessarily a problem in a bull market, and there...
READ MORE
MEMBERS ONLY
IS THE CORRECTION OVER?
Last week's commodity market decline was the most severe since 1980; which of course begs the question "is the correction over"? We don't believe that to be the case, as follow on selling will materialize taking prices far lower than one can believe.
In...
READ MORE
MEMBERS ONLY
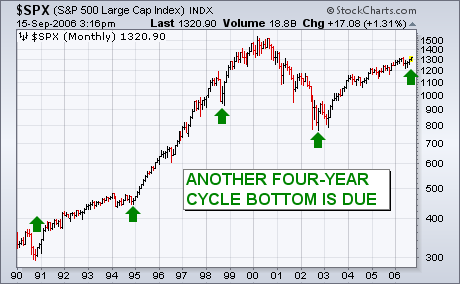
WHAT ABOUT THE FOUR-YEAR CYCLE
I've received a number of questions on the status of the four-year cycle. The stock market has shown a very consistent pattern of forming important bottoms every four years - usually during the fourth quarter. The last bottom took place in October 2002, which makes another one due...
READ MORE
MEMBERS ONLY
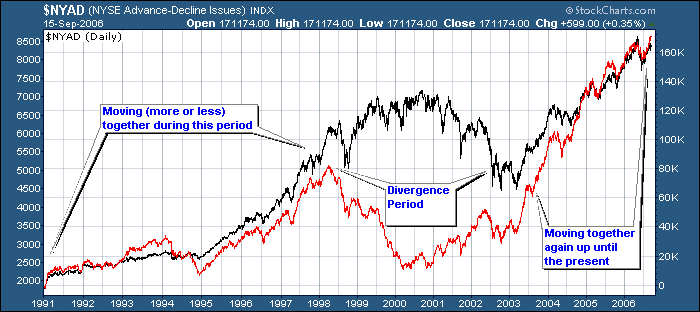
THE IMPORTANCE OF THE NY A-D LINE
Hello Fellow ChartWatchers!
OK, do I really need to write an article explaining this picture?
Seriously, there are more than the proverbial thousand words in the chart above. The NY Advance-Decline Line (the red one) is defined as the cumulative total of the daily NYSE advancers minus the daily NYSE...
READ MORE
MEMBERS ONLY
RYDEX RATIO IMPLIES PRICES WILL GO HIGHER
After the decline that lasted from the beginning of May to mid-June, a second bottom was made in July, from which the current rally emerged. Both the bottoming process and the rally have been rough and tedious, causing a lot of anxiety among market participants, and resulting in strong, persistent...
READ MORE
MEMBERS ONLY
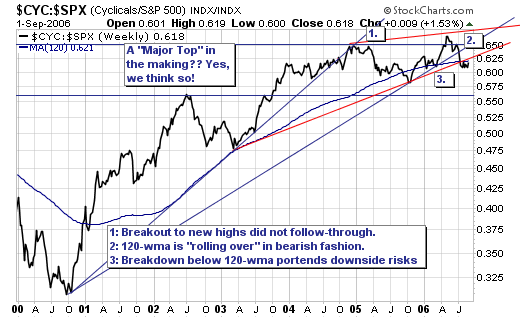
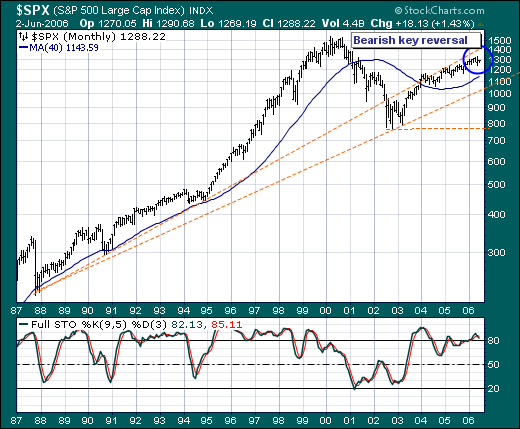
GOLDILOCKS AND THE BEARS
While many believe a "goldlilocks" soft-landing is forthcoming for the US economy; we think the probability of this occurring is rather small given the ongoing weakness in the housing market. That said, we are bearish on equities given our overbought indicators, and the fact this rally is becoming...
READ MORE
MEMBERS ONLY
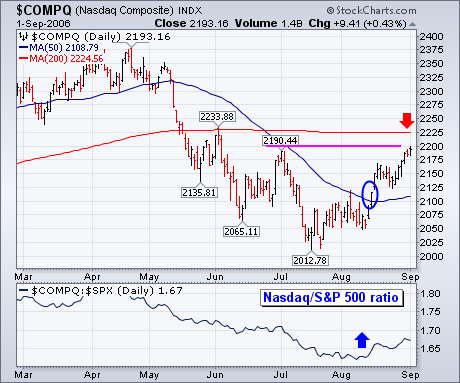
NASDAQ NEARS MOMENT OF TRUTH
It's very hard for the stock market to stage a major advance without help from the Nasdaq market. Fortunately, it's been getting some Nasdaq help since mid-July. The chart below shows the Nasdaq Composite gaining nearly 200 points (10%) since mid-July. The actual signal of the...
READ MORE
MEMBERS ONLY
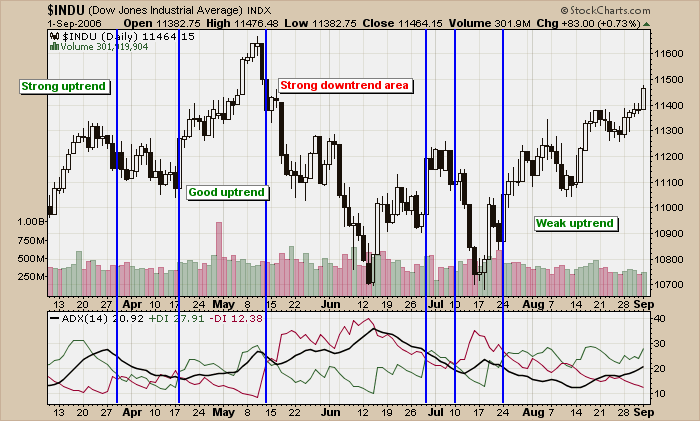
TRENDING UP, DOWN OR SIDEWAYS?
Trend analysis is one of the most important technical analysis skills anyone can have. Knowing if a stock is trending or oscillating can have a big impact on what kind of approach you take to trading it. Stocks that are in a strong uptrend should be bought and held until...
READ MORE
MEMBERS ONLY
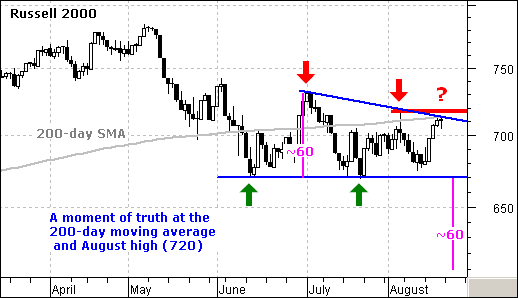
A MOMENT OF TRUTH FOR THE RUSSELL 2000
The Russell 2000 has been lagging the S&P 500 and Nasdaq 100 over the last few months. Even with the big bounce off support this past week, the Russell 2000 remains below its August high. In contrast, the S&P 500 and Dow broke above their June...
READ MORE
MEMBERS ONLY
NASDAQ 100: TURNING BULLISH, BUT SHORT-TERM OVERBOUGHT
The Nasdaq 100 Index has declined farther than the broader indexes, and it has been slower in turning around; however, this week the index has turned the corner, and appears ready for a continued advance. The only problem is that it has become short-term overbought.
To demonstrate, let's...
READ MORE
MEMBERS ONLY
STILL BEARISH IN TECHNOLOGY
Our recent comments stating we believe a bear market in technology stocks via the NASDAQ 100 has begun remains valid; however, our technical bearish must be tempered somewhat by last week's sharp rally. Quite simply, the rally has put monthly prices back above the 25-month moving average -...
READ MORE
MEMBERS ONLY
AUTO-REFRESH CHARTS AND COOLING PROJECT
AUTO-REFRESHING CHARTS - We're continuing to monitor and tune the performance of our new Auto-Refreshing charts feature and so far things are going very, very well. We've heard feedback from tons of people saying that they really love this new capability. Here's what one...
READ MORE
MEMBERS ONLY
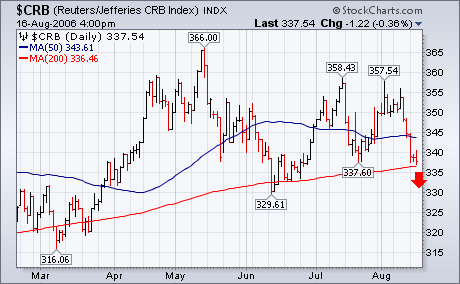
CRB BREAKS 200-DAY AVERAGE
I wrote yesterday about recent selling in commmodity pits pushing the Reuters/Jefferies CRB Index into a test of its 200-day average. Today's five point drop has pushed it below that long-term support line in pretty decisive fashion (see red arrow). Chart 1 shows the CRB peaking in...
READ MORE
MEMBERS ONLY
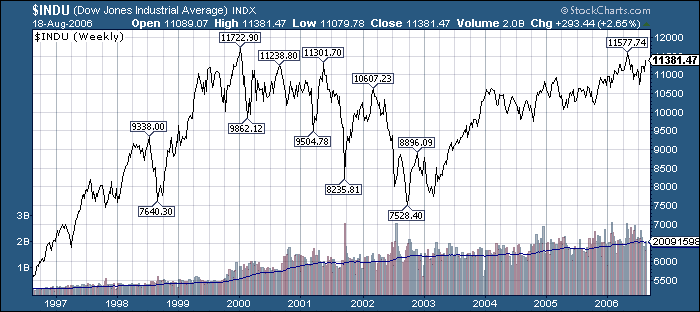
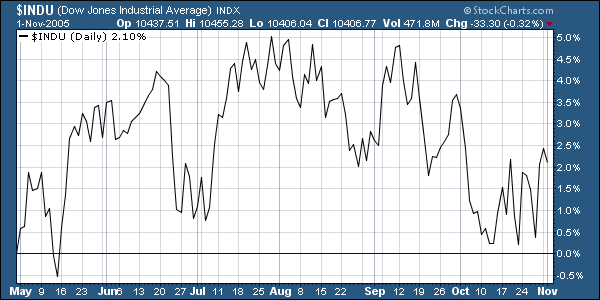
BUBBLING RIGHT ALONG
Hello Fellow ChartWatchers!
There hasn't been much talk about it in the press but the Dow Industrials has continued its slow rise to new heights. How high? On the follow chart you can see that there are only two labelled peaks that are higher than the Dow'...
READ MORE
MEMBERS ONLY
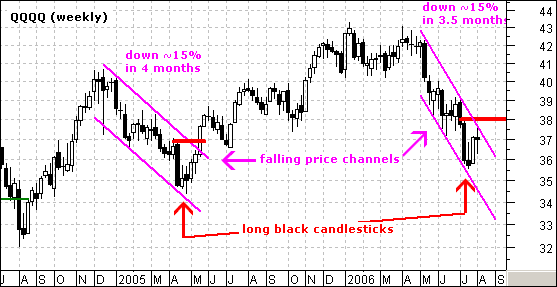
QQQQ REMAINS IN CLEAR DOWNTREND
On the weekly QQQQ chart, it is clear that the stock remains in a falling price channel and has yet to break key resistance at 38. There are two falling price channels on the chart (magenta trendlines) and lessons from the first can be applied to now to identify a...
READ MORE
MEMBERS ONLY
TECHNICAL PICTURE IS MOSTLY BULLISH
The decline from the May top, and the subsequent sideways chopping have been hard on investors' nerves as they try to decide how things will eventually resolve; however, even though the rising trend line has been challenged twice in the last few months, the technical picture has been steadily...
READ MORE
MEMBERS ONLY
AUTO-REFRESHING CHARTS ARE HERE!
See Chip's article at the top of this newsletter for more details....
READ MORE
MEMBERS ONLY
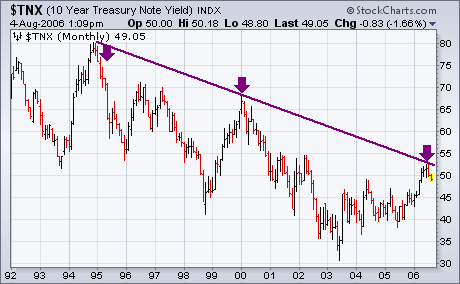
BOND YIELDS HIT FOUR-MONTH LOW
The U.S. economy added fewer jobs than expected during July and the unemployment report rose for the first time in five months to 4.8% from 4.6%. The weak job report is the latest in a string of signs that the economy is weakening. That's usually...
READ MORE
MEMBERS ONLY
A "REFRESHING" CHANGE
Hello Fellow ChartWatchers!
This week we are pleased to announce a brand new feature for StockCharts.com users - Automatically Updating Charts! Starting Monday when the market opens, members of our "Extra" service will have a new way to watch the market. On the SharpCharts Workbench page, Extra...
READ MORE
MEMBERS ONLY

SPLIT MARKET
While both the S&P 500 and Nasdaq 100 are showing the effects of the current correction, there are significant differences in the technical picture on both charts. With the S&P 500 we might ask, "Where's the bear?" The 50-EMA of price is...
READ MORE
MEMBERS ONLY
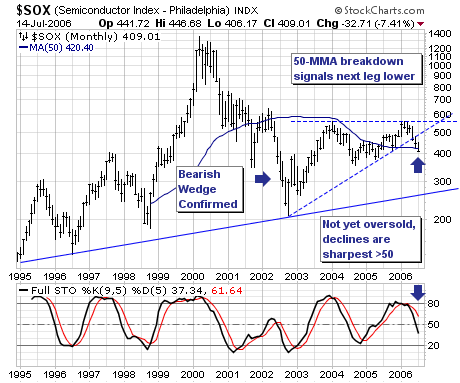
A MOVE DOWN FOR THE SOX?
We believe that the Semiconductor Index (SOX) is poised to move sharply lower in the months ahead into a tradable bottom. Our target is rising trendline support near 280, which presupposes a decline of -31% between now and then. Our reasoning is rather simple: First, the fundamental backdrop has been,...
READ MORE
MEMBERS ONLY
5 YEARS WITHOUT A PRICE INCREASE
FIVE YEARS WITHOUT A PRICE INCREASE! - StockCharts.com introduced our "Extra" service five years ago and our price then was the same as it is now. StockCharts is still a great value folks. And - for you cynics out there - we have absolutely no plans to...
READ MORE
MEMBERS ONLY
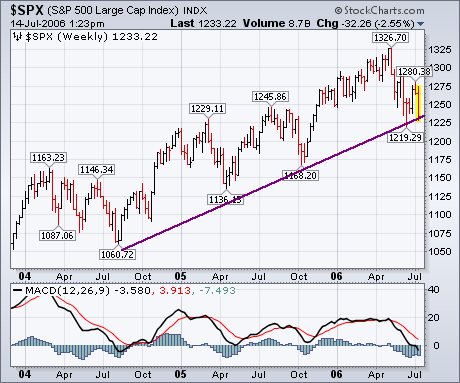
S&P 500 TESTS MAJOR UP TRENDLINE
Earlier in the week I showed a number of moving averages that appeared to be on the verge of giving major sell signals. Here's another long-term support line to watch. The S&P 500 is bearing down on a two-year support line that starts in the summer...
READ MORE
MEMBERS ONLY
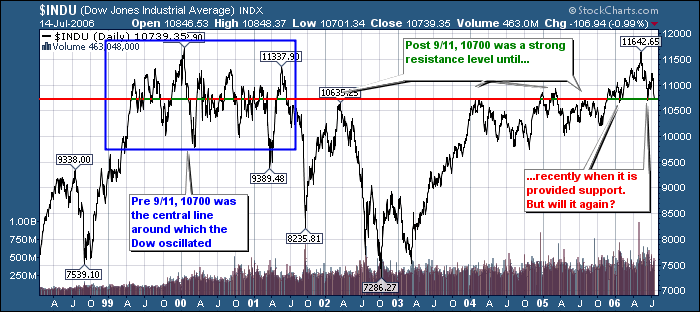
HELLO FELLOW CHARTWATCHERS!
Three big down days have sent the Dow back down to the 10,700 support level. What's that you say? 10,700 is just a number? Just a number like any other? Oh really? Check out this chart:
10,700 is a number that should make your ears...
READ MORE
MEMBERS ONLY
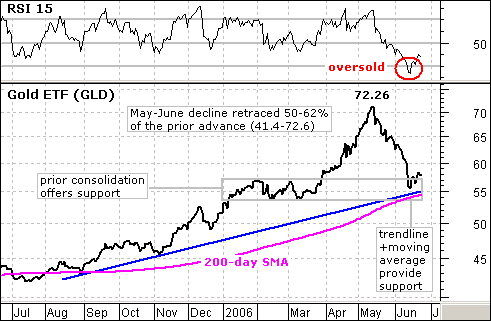
GOLD ETF ENTERS SUPPORT ZONE
After a harrowing decline the last 5-6 weeks, the StreetTracks Gold ETF (GLD) finally reached a support zone and RSI became oversold. This paves the way for a bounce and possibly a continuation of the long-term uptrend.
A number of technical items have come together to mark support around 55....
READ MORE
MEMBERS ONLY
BEARS HAVE HARDLY BUDGED
(Editor's Note: This article was written on June 16th - over a week ago. Given the market's sideways motion since then, the article's basic premise remains valid. It is also instructive to compare commentary from the past with current conditions to see how the...
READ MORE
MEMBERS ONLY
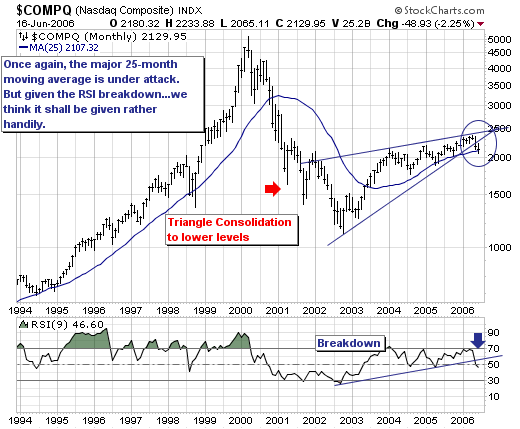
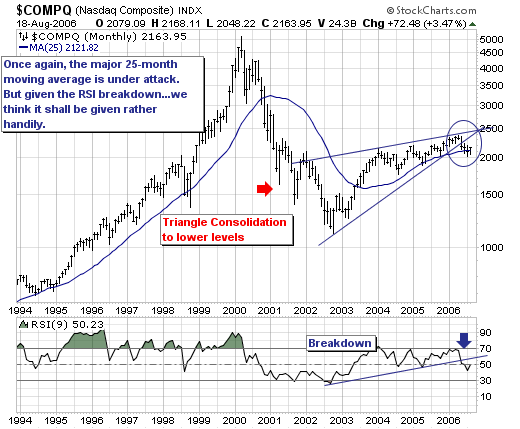
A LOOK AT THE NASDAQ COMPOSITE
The NASDAQ Composite is now in danger embarking on an extended move lower. Quite simply, we use the 25-month month moving average to demarcate the difference between bull and bear trends; and given the Composite is trading only 22 points above this level within the context of an RSI breakdown....
READ MORE
MEMBERS ONLY
READING MY LIPS AT THE NYBOT
READING MY LIPS ... On Tuesday June 13, I gave a speech to traders on the New York Board of Trade. I used that opportunity to review the major intermarket principles relating to the dollar, commodities, bonds, and stocks. I talked about the impact of the dollar on foreign ETFs, and...
READ MORE
MEMBERS ONLY
Hello Fellow ChartWatchers!
"Summer-time... and the trading's easy!" Sorry for the singing folks, but we are in a happy mood here at StockCharts right now. Summer time always cheers people in the Pacific Northwest up (I wonder why? ;-). We're so happy that we decided to roll...
READ MORE
MEMBERS ONLY
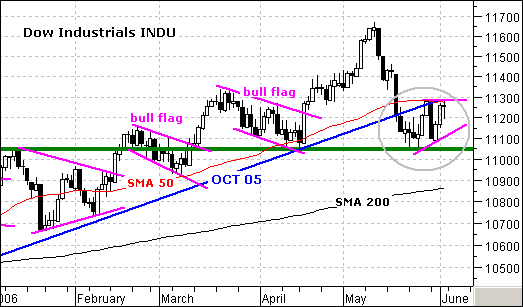
DOW CONSOLIDATES ABOVE KEY SUPPORT
The Dow came down hard in May, but found support at 11050. This support level stems from January resistance and the April low. A key tenet of technical analysis is that broken resistance turns into support. The Dow broke above 11050 in February and this level turned into support in...
READ MORE
MEMBERS ONLY
BOTTOM LOOK PRETTY SOLID
On Tuesday we saw the market successfully retest last week's lows, then on Thursday there was a climactic rally that broke above last week's highs. This was a lot more positive than many people (including me) were expecting.
The most significant short-term event was that the...
READ MORE
MEMBERS ONLY
THE DAMAGE FROM "THE MAY SWOON"
The May Swoon as we are apt to call weakness seen during the month had led to an increase in confusion amongst technical analysts. However, we would argue that is all about "time horizons", and we should confuse short-term movements with long-term time horizons as we are beginning...
READ MORE
MEMBERS ONLY
SERVER UPGRADES COMPLETED, MORE BANDWIDTH, FUTURE PLANS
SERVER UPGRADE COMPLETED - We hit another major milestone last week when we upgraded our final database server. In addition to the SharpCharts2 roll-out, we've been quietly upgrading our 8 database servers to the newest, fastest hardware from Dell with the newest, fastest software from Microsoft. Last Monday...
READ MORE
MEMBERS ONLY
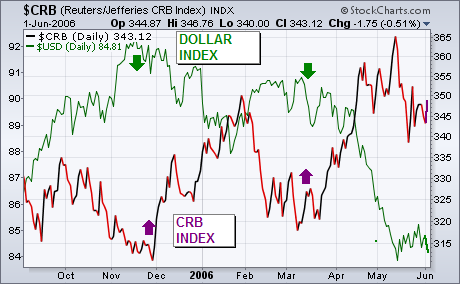
US DOLLAR AT CRUCIAL JUNCTURE
The chart below compares the Dollar Index (green line) to the CRB Index (purple line) since last September. The main message to be drawn from the chart is that the two markets have been trending in opposite directions which is their natural tendency. Dollar peaks last November and again in...
READ MORE
MEMBERS ONLY
Hello Fellow ChartWatchers!
The results are in! We have the five winners for our "Seeing Clearly with SharpCharts2" contest! Thanks again to everyone that entered. There were over one hundred entries and all of them were very well done. The judges' job was not easy at all.
The five winners...
READ MORE
MEMBERS ONLY

QQQQ BREAKS KEY SUPPORT
QQQQ established support at 40 with three bounces over the last six months and broke this key support level with a sharp decline over the last two weeks. The break below 40 signals a major victory for the bears and the first downside target is to around 37-38. The August...
READ MORE
MEMBERS ONLY
OVERSOLD BOUNCE IS DUE, BUT . . .
During the last two weeks the market has experienced a much needed (and long anticipated) decline, and now it is due a bounce out of a short-term oversold condition; however, the decline could continue for a few more months.
On our first chart below we can see that the CVI...
READ MORE
MEMBERS ONLY
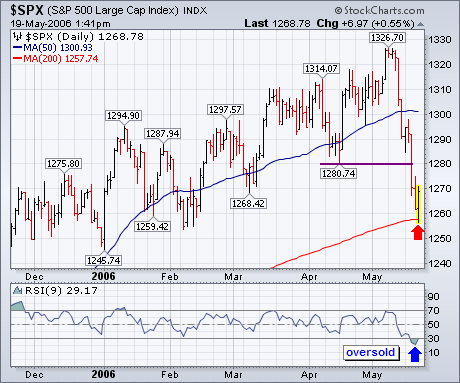
S&P 500 IS ENTITLED TO A BOUNCE
Although the longer-range chart picture has weakened (with most weekly indicators on sell signals), the S&P 500 has lost about 5% this week and looks to be in a short-term oversold condition. Its daily chart shows the 9-day RSI line below 30 for the first time this year....
READ MORE
