MEMBERS ONLY
The Case for Small-Caps as Major Indexes Test Overbought Conditions
by David Keller,
President and Chief Strategist, Sierra Alpha Research
In this edition of StockCharts TV'sThe Final Bar, Craig Johnson, CFA CMT of Piper Sandler shares his long-term charts of the S&P 500 and 10-Year Treasury Yield and makes the case for small caps through year-end 2023. Dave shares one breadth indicator reaching a bearish extreme...
READ MORE
MEMBERS ONLY
Three Ways to Stay on the Right Side of the Market
by David Keller,
President and Chief Strategist, Sierra Alpha Research
In this edition of StockCharts TV'sThe Final Bar, guest Dave Landry of DaveLandry.com reveals his three charts to define the market trend, limit losses, and stay on the right side of the market. Host David Keller, CMT targets names trading higher and testing key resistance, including TGT,...
READ MORE
MEMBERS ONLY
Stocks and Bonds SOAR After October CPI
by David Keller,
President and Chief Strategist, Sierra Alpha Research
In this edition of StockCharts TV'sThe Final Bar, guest Pete Carmasino of Chaikin Analytics puts this week's action into long-term perspective using his charts of bond prices, interest rates, unemployment, and regional banks. Dave highlights three stocks with actionable signals this week: ROST, FSLR, and MCK....
READ MORE
MEMBERS ONLY
Finding Setups as Markets Wait for October CPI
by David Keller,
President and Chief Strategist, Sierra Alpha Research
In this edition of StockCharts TV'sThe Final Bar, Dave identifies bullish and bearish momentum divergences as the equity and bond markets await the October CPI reading on Tuesday morning. He answers questions covering Brent crude oil prices, uranium stocks, inverse head and shoulders patterns, and upside potential for...
READ MORE
MEMBERS ONLY
Why is S&P 4400 So Important Right Now?
by David Keller,
President and Chief Strategist, Sierra Alpha Research
KEY TAKEAWAYS
* Charles Dow first popularized the concept of trends as defined by the pattern of peaks and valleys in price action.
* We can create shaded areas on a chart based on traditional support and resistance levels to create a "stoplight" effect to better define the market phase....
READ MORE
MEMBERS ONLY
Decoding Bear Markets, Divergences, & More! A Q&A with David Keller, CMT
by David Keller,
President and Chief Strategist, Sierra Alpha Research
In this edition of StockCharts TV'sThe Final Bar, Dave dives deep into the world of market dynamics and technical analysis to answer YOUR burning questions! He talks topics like point and figure charts, moving averages, Nomura Holdings (NMR), Arthur J. Gallagher & Co. (AJG), and more!
This video...
READ MORE
MEMBERS ONLY
Top Ten Hidden Features of StockCharts, Features 6-10
by David Keller,
President and Chief Strategist, Sierra Alpha Research
In this edition of StockCharts TV'sThe Final Bar, Dave takes a closer look at some key features on StockCharts and how to use them in new and improved ways, in order to gain a deeper understanding of market dynamics and price behavior. You might even stumble upon some...
READ MORE
MEMBERS ONLY
Top Ten Hidden Features of StockCharts, Features 1-5
by David Keller,
President and Chief Strategist, Sierra Alpha Research
In this edition of StockCharts TV'sThe Final Bar, Dave takes a closer look at some key features on StockCharts and how to use them in new and improved ways, in order to gain a deeper understanding of market dynamics and price behavior. You might even stumble upon some...
READ MORE
MEMBERS ONLY
Why are Higher Interest Rates a Big Deal?
by David Keller,
President and Chief Strategist, Sierra Alpha Research
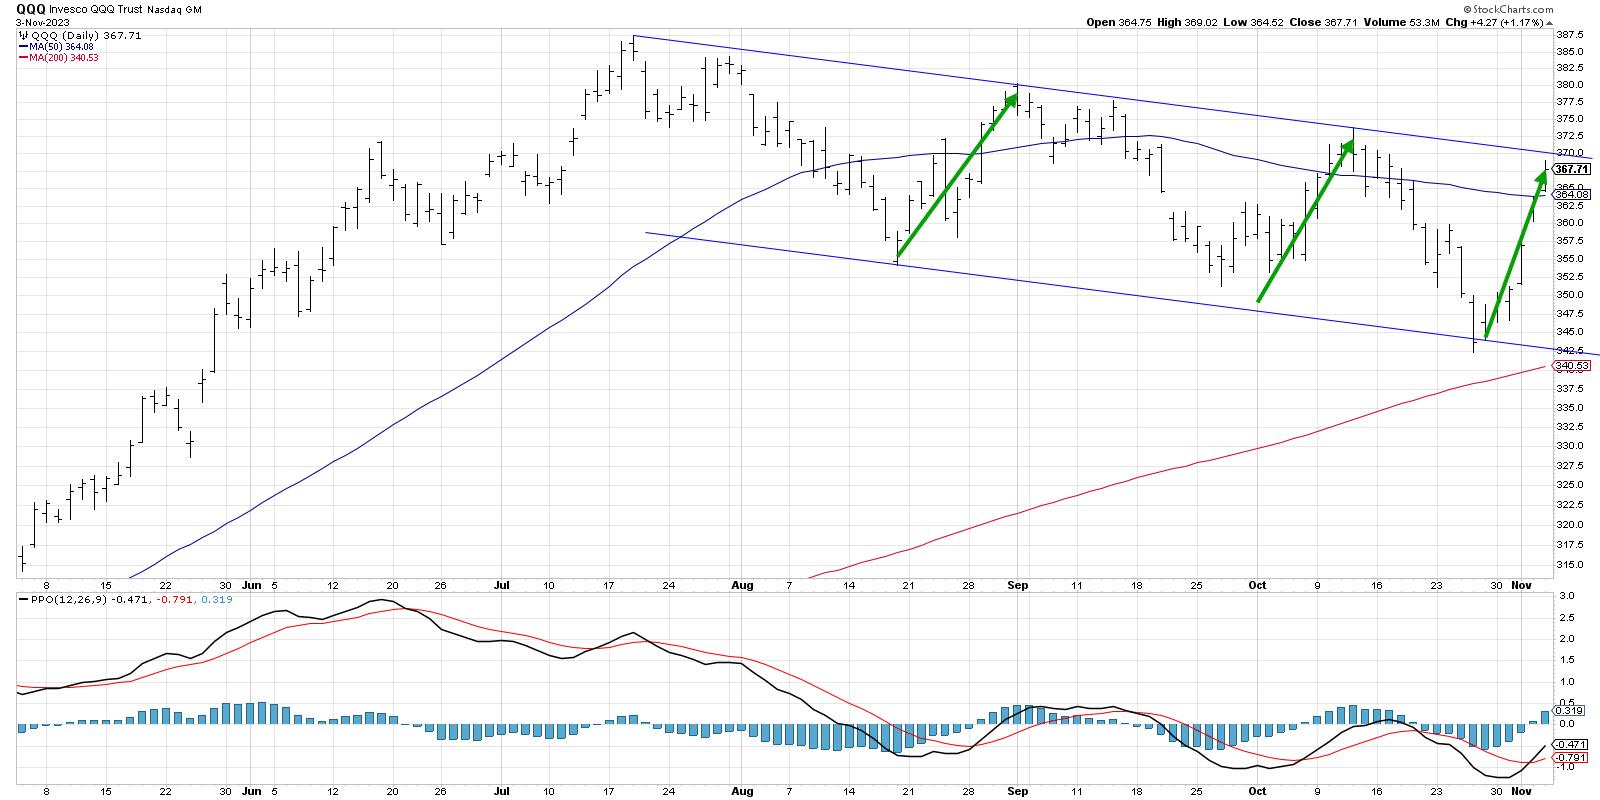
In this edition of StockCharts TV'sThe Final Bar, guest Mike Singleton of Invictus Research describes the impact of higher interest rates on consumer spending and growth stock valuations. Host David Keller, CMT charts the breakout for the QQQ and reviews stocks reporting earnings, including DKNG, UBER, and more....
READ MORE
MEMBERS ONLY
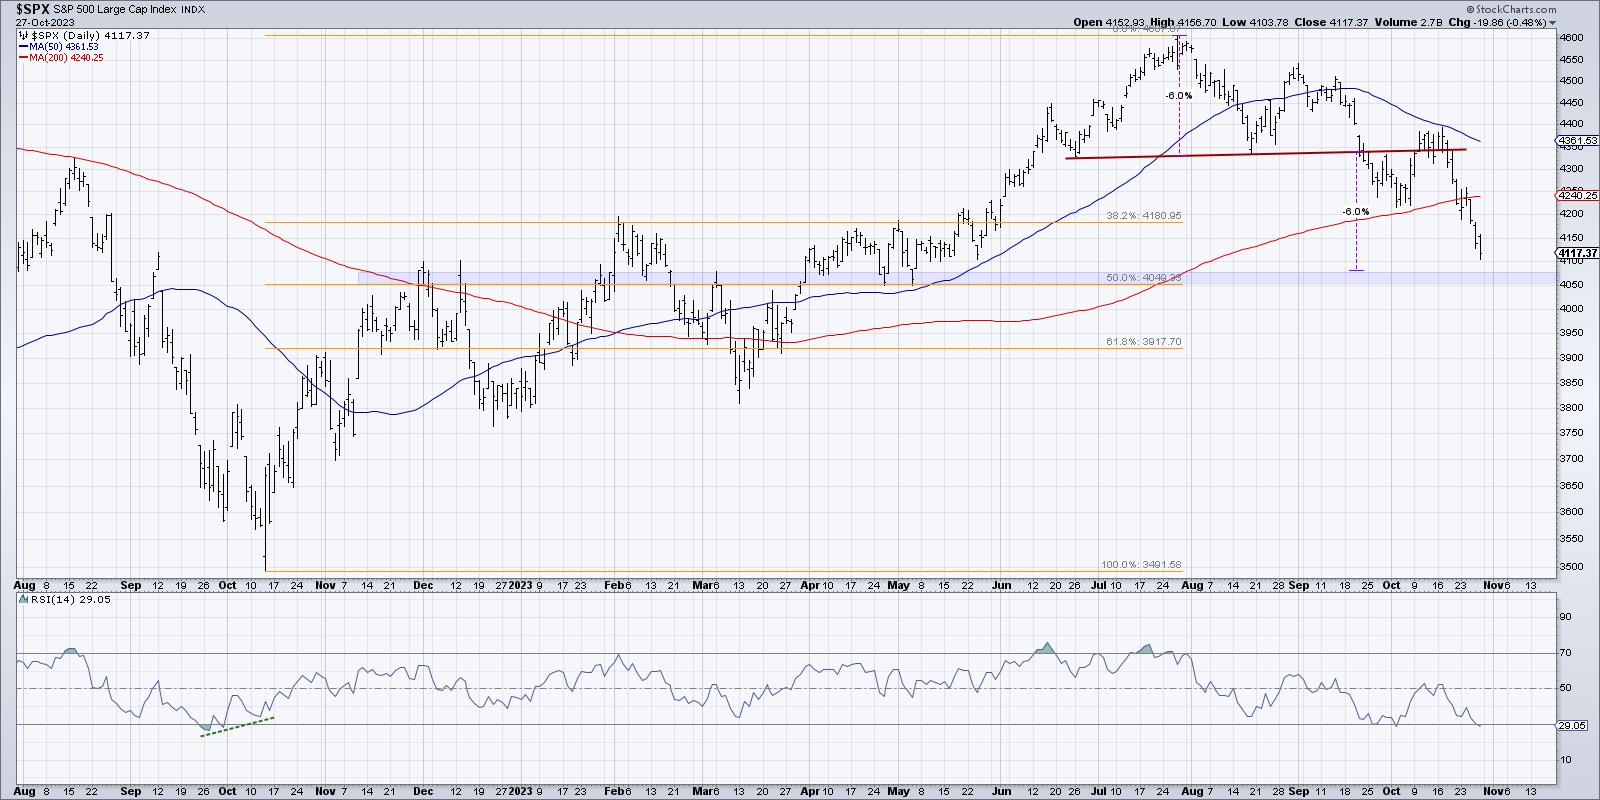
This Key Resistance Level is Crucial for the S&P 500
by David Keller,
President and Chief Strategist, Sierra Alpha Research
In this edition of StockCharts TV'sThe Final Bar, Dave breaks down the charts of the S&P 500 and Nasdaq 100 with a focus on the downtrend channel for the QQQ and key resistance at 4400 for the S&P 500. He answers viewer questions on...
READ MORE
MEMBERS ONLY
Trading the QQQ in Three Timeframes
by David Keller,
President and Chief Strategist, Sierra Alpha Research
KEY TAKEAWAYS
* The short-term trend for the QQQ is positive after this week's rally, but price is now at the upper edge of a downtrend channel.
* On the medium-term timeframe, the downtrend channel is still intact, and the momentum reading is still in line with a bearish phase....
READ MORE
MEMBERS ONLY
Top Ten Charts to Watch in November 2023
by David Keller,
President and Chief Strategist, Sierra Alpha Research
by Grayson Roze,
Chief Strategist, StockCharts.com
In this edition of StockCharts TV'sThe Final Bar, join Dave and Grayson as they break down the trends for the top ten stocks and ETF charts for November 2023. Watch as they identify key levels and signals to keep an eye out for using the power of StockCharts&...
READ MORE
MEMBERS ONLY
What Can the VIX Reveal To Us In November 2023?
by David Keller,
President and Chief Strategist, Sierra Alpha Research
In this edition of StockCharts TV'sThe Final Bar, Tim Hayes of Ned Davis Research shares an outlook for interest rates in 2024, and explains why a VIX over 28.5 could mean disaster for risk assets. Host David Keller, CMT updates charts of stocks reporting earnings including SBUX,...
READ MORE
MEMBERS ONLY
Signs of Top in Rates As Fed Says NO CHANGE
by David Keller,
President and Chief Strategist, Sierra Alpha Research
In this edition of StockCharts TV'sThe Final Bar, Katie Stockton, CMT of Fairlead Strategies shares her weekly charts of the S&P 500, VIX, and XLK and identifies three areas of opportunity through year-end 2023. Dave breaks down this week's Fed meeting from a technical...
READ MORE
MEMBERS ONLY
Stock Market Hinges on the Ten Year Interest Rate
by David Keller,
President and Chief Strategist, Sierra Alpha Research
In this edition of StockCharts TV'sThe Final Bar, Tony Dwyer of Canaccord Genuity breaks down four charts that speak to a potential tactical rally for the S&P 500, and explains why this market is still all about interest rates. Meanwhile, Dave charts the downtrend channel for...
READ MORE
MEMBERS ONLY
Countertrend Rally in the Works for SPX? What the Charts Reveal
by David Keller,
President and Chief Strategist, Sierra Alpha Research
In this edition of StockCharts TV'sThe Final Bar, Dave discusses implications for this week's earnings releases, the November Fed meeting, and geopolitical events. He answers live viewer questions on volume-based indicators, downside targets for the S&P 500 chart, possibilities for a countertrend rally for...
READ MORE
MEMBERS ONLY
My Downside Targets for the S&P 500
by David Keller,
President and Chief Strategist, Sierra Alpha Research
KEY TAKEAWAYS
* The S&P 500 has almost reached the minimum downside objective based on the head and shoulders topping pattern.
* SPX 3800 would mean represent a 38.2% retracement level of the March 2020 to January 2022 bull market phase.
If you've been fighting the mounting...
READ MORE
MEMBERS ONLY
Where to Find Stock Opportunities in Bear Territory
by David Keller,
President and Chief Strategist, Sierra Alpha Research
In this edition of StockCharts TV'sThe Final Bar, host Dave wraps a bearish week with a discussion on downtrend conditions, trendline resistance, deteriorating breadth, and finding opportunities in a bearish landscape. He answers viewer questions on inverted yield curves, recessionary periods, and leading vs. lagging technical indicators.
This...
READ MORE
MEMBERS ONLY
Late-Hour Selloff Confirms Downtrend Phase!
by David Keller,
President and Chief Strategist, Sierra Alpha Research
In this edition of StockCharts TV'sThe Final Bar, guest Tom Bowley of EarningsBeats shares his chart of key ratios illustrating how growth still has held its ground relative to value stocks. Host David Keller, CMT focuses in on distribution in the last hour of trading and highlights one...
READ MORE
MEMBERS ONLY
NASDAQ NOSEDIVES, Down Over 2% At The Close!
by David Keller,
President and Chief Strategist, Sierra Alpha Research
In this edition of StockCharts TV'sThe Final Bar, guest Mary Ellen McGonagle of MEM Investment Research shares three stocks showing promise during a period of severe market distribution. Dave focuses in on the S&P 500 testing Fibonacci support and breaks down earnings for Microsoft, Alphabet, Spotify,...
READ MORE
MEMBERS ONLY
How Mega-Cap Names Dominate Through Market Cap
by David Keller,
President and Chief Strategist, Sierra Alpha Research
In this edition of StockCharts TV'sThe Final Bar, Dave shares how growth over value is less about the types of companies and more about the market cap represented in the largest benchmark names. He breaks down today's pop-and-drop for Bitcoin and answers questions from the newly-added...
READ MORE
MEMBERS ONLY
Lagging Indicators Confirm Bearish Phase For Growth
by David Keller,
President and Chief Strategist, Sierra Alpha Research
KEY TAKEAWAYS
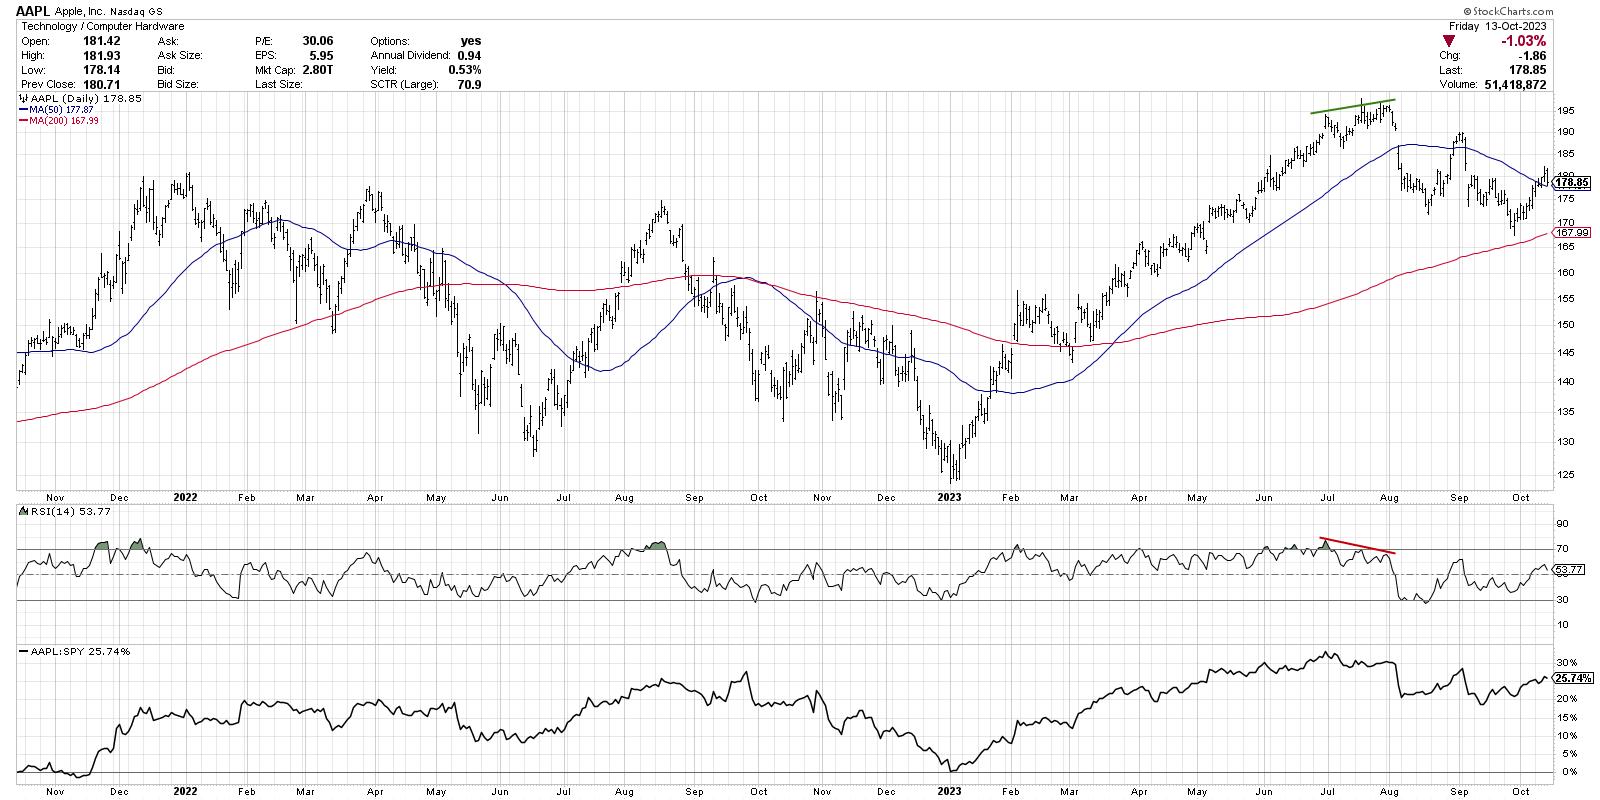
* Leading indicators help anticipate price reversals, while lagging indicators validate trend changes you've already observed.
* RSI combines the qualities of leading and lagging indicators, helping investors to prepare for and react to trend reversals.
* AAPL recently showed a bullish momentum divergence, meaning the leading indicator has...
READ MORE
MEMBERS ONLY
Growth Sectors Tumble as Defensive Plays Post a Strong Finish
by David Keller,
President and Chief Strategist, Sierra Alpha Research
In this edition of StockCharts TV'sThe Final Bar, Dave tracks the rapid decline in growth sectors including Technology and Communication Services as defensive plays like utilities and gold post a strong finish to the week. Dave answers questions from The Final Bar Mailbag on the McClellan Summation Index...
READ MORE
MEMBERS ONLY
Stocks Continue Feeling The Pressure From Higher Rates
by David Keller,
President and Chief Strategist, Sierra Alpha Research
In this edition of StockCharts TV'sThe Final Bar, guest Chris Verrone of Strategas Research Partners discusses how small-caps may emerge from the quagmire, along with why it's important to focus on relative strength. Host David Keller, CMT points out the continued strength of offense over defense...
READ MORE
MEMBERS ONLY
The Most Important Chart to Watch During Earnings Season
by David Keller,
President and Chief Strategist, Sierra Alpha Research
In this edition of StockCharts TV'sThe Final Bar, guest Adam Turnquist, CMT of LPL Financial shares his chart of the Ten Year Treasury Yield and explains why the US Dollar may be the most important chart to watch as earnings season begins. Dave highlights stocks making new swing...
READ MORE
MEMBERS ONLY
Breadth Indicators Illustrate Recent Dire Conditions
by David Keller,
President and Chief Strategist, Sierra Alpha Research
In this edition of StockCharts TV'sThe Final Bar, guest Doug Ramsey, CFA CMT of The Leuthold Group talks small-cap underperformance and shares two breadth indicators illustrating the recently dire conditions. Host David Keller, CMT declares the 200-day moving average "the most important line in the sand for...
READ MORE
MEMBERS ONLY
Maximizing Profits: Three Stocks in Three Phases
by David Keller,
President and Chief Strategist, Sierra Alpha Research
KEY TAKEAWAYS
* The accumulation phase is marked by higher highs and higher lows, as investors push the price onward and ever upward.
* Stocks in the distribution phase are trending lower, with the price usually below two downward-sloping moving averages.
* A symmetrical triangle or "coil" pattern is a telltale...
READ MORE
MEMBERS ONLY
10 Crucial Charts Shaping The Markets in October 2023
by David Keller,
President and Chief Strategist, Sierra Alpha Research
In this special edition of StockCharts TV'sThe Final Bar, Dave breaks down the crucial charts shaping October 2023's financial landscape.
This video originally premiered on October 6, 2023. Watch on our dedicated Final Bar pageon StockCharts TV, or clickthis linkto watch on YouTube.
New episodes of...
READ MORE
MEMBERS ONLY
The Top Three Indicators Pressuring Earnings Right Now
by David Keller,
President and Chief Strategist, Sierra Alpha Research
In this edition of StockCharts TV'sThe Final Bar, Jesse Felder of The Felder Report shares his long-term charts comparing price and earnings, and reveals the two charts he's watching now to navigate a potential market bottom. Dave focuses on resilient strength in the semiconductor group and...
READ MORE
MEMBERS ONLY
How Market Breadth Indicators Can Lead You Out of Market Bottoms
by David Keller,
President and Chief Strategist, Sierra Alpha Research
In this edition of StockCharts TV'sThe Final Bar, Dave digs out his market correction playbook and shares what market breadth indicators tend to do leading into and out of market bottoms. He also reveals the charts that can serve investors well in corrective phases, using relative strength as...
READ MORE
MEMBERS ONLY
Here's a Scary Scenario for You: S&P 500 Downside to 2200?!?
by David Keller,
President and Chief Strategist, Sierra Alpha Research
In this edition of StockCharts TV'sThe Final Bar, guest Jeff Huge, CMT of JWH Investment Partners updates his Elliott Wave count for the S&P 500 and shares what the MOVE index can tell us about further upside potential for interest rates. Dave recaps the continued deterioration...
READ MORE
MEMBERS ONLY
Watch for These Signs of a Bottom As Market Breadth Conditions Crumble
by David Keller,
President and Chief Strategist, Sierra Alpha Research
In this edition of StockCharts TV'sThe Final Bar, Dave shows how market breadth conditions have continued to deteriorate to the point where signs of a bottom may emerge. He answers viewer questions on historical Fed cycles, under-performance of defensive sectors like utilities, and how to use technical analysis...
READ MORE
MEMBERS ONLY
Your Burning Questions, Answered: FATE of TESLA & Bullish Bias Solutions!
by David Keller,
President and Chief Strategist, Sierra Alpha Research
In this edition of StockCharts TV'sThe Final Bar, Dave answers viewer questions about Tesla's potential trajectory towards the 200-day moving average and ways to normalize relative strength graphs using volatility measures. He also dives into his past trades' technical setup, shares tips for setting up...
READ MORE
MEMBERS ONLY
Is it Possible for the S&P 500 to Hold the 4300 Level?
by David Keller,
President and Chief Strategist, Sierra Alpha Research
In this edition of StockCharts TV'sThe Final Bar, Samantha LaDuc of LaDuc Capital breaks down the implications of higher interest rates and why semiconductors remain a crucial space to watch. Host David Keller, CMT tracks the recent rally in Bitcoin and identifies two key names testing moving average...
READ MORE
MEMBERS ONLY
Looking at Recent Market PULLBACK in a Long-Term Context & More!
by David Keller,
President and Chief Strategist, Sierra Alpha Research
In this edition of StockCharts TV'sThe Final Bar, Joe Rabil of Rabil Stock Research walks through his monthly, weekly, and daily S&P 500 charts to put the recent market pullback into proper long-term context. Host David Keller, CMT digs into breadth indicators that have turned quite...
READ MORE
MEMBERS ONLY
S&P 500 Head and Shoulders Top Confirmed
by David Keller,
President and Chief Strategist, Sierra Alpha Research
KEY TAKEAWAYS
* The head and shoulders pattern is a classic price pattern that confirms an exhaustion of buyers.
* Investors should consider the three phases of price patterns, and make sure to confirm all three phases before taking action.
* This pattern yields a minimum downside objective of around 4080-4100 for the...
READ MORE
MEMBERS ONLY
Confirmed! Head-and-Shoulders Top Pattern for the S&P 500!
by David Keller,
President and Chief Strategist, Sierra Alpha Research
In this edition of StockCharts TV'sThe Final Bar, Mish Schneider of MarketGauge shares why the most important ETFs to watch are Retailers (XRT) and Small Caps (IWM) and also shares their latest plugin on the StockCharts ACP platform. Host David Keller, CMT tracks today's risk-off move...
READ MORE
MEMBERS ONLY
Fed Keeps Hands Off Rates, Leaves DOOR OPEN for More Hikes!
by David Keller,
President and Chief Strategist, Sierra Alpha Research
In this edition of StockCharts TV'sThe Final Bar, Danielle Shay of Simpler Trading joins Dave to discuss what's the technical take on the FAANG stocks after today's Fed announcement going into earnings season? Powell and Co. leave rates unchanged, leave the door open for...
READ MORE
MEMBERS ONLY
When to BUY, When to SELL, and When to SIT On Your Hands
by David Keller,
President and Chief Strategist, Sierra Alpha Research
In this edition of StockCharts TV'sThe Final Bar, guest Dave Landry of DaveLandry.com shares his own approach to what he calls the "Three Whens"- when to buy, when to sell, and when to sit on your hands! Meanwhile, host Dave Keller reviews charts of...
READ MORE
MEMBERS ONLY
Analyzing Risks for Mega-Cap Growth Stocks Before Key FED Meeting
by David Keller,
President and Chief Strategist, Sierra Alpha Research
In this edition of StockCharts TV'sThe Final Bar, Dave conducts a deep dive into current market breadth indicators, including advance-decline data, the McClellan Oscillator, and the Bullish Percent Index. He reviews key support and resistance levels for AAPL, TSLA, NVDA, and other growth stocks as the market waits...
READ MORE