MEMBERS ONLY
Three ETFs Suggest Further Downside
by David Keller,
President and Chief Strategist, Sierra Alpha Research
This past week had all the potential to see a revival of the great bull market of 2023. The September inflation data, Apple's latest product announcements, and Arm's IPO all seemed had the possibility to reignite the fire of bullishness for investors.
By Friday's...
READ MORE
MEMBERS ONLY
Deep Dive Into Stop Losses, Volatility Hacks, and Bullish Rotation
by David Keller,
President and Chief Strategist, Sierra Alpha Research
In this edition of StockCharts TV'sThe Final Bar, Dave drops a special all-mailbag episode, including viewer questions on using Average True Range for stop losses, stocks vs. bonds, India's test of all-time highs, and best practices for price volatility.
This video originally premiered on September 15,...
READ MORE
MEMBERS ONLY
Timeless Lessons from the Godfather of Technical Analysis
by David Keller,
President and Chief Strategist, Sierra Alpha Research
In this edition of StockCharts TV'sThe Final Bar, Dave sits down with Ralph Acampora, CMT, co-founder of the CMT Association, for a memorable conversation on all things technical analysis. They review lessons learned from the October 2022 market low, words of wisdom for traders new to technical analysis,...
READ MORE
MEMBERS ONLY
Sector Rotation Analysis Still Quite Bullish
by David Keller,
President and Chief Strategist, Sierra Alpha Research
In this edition of StockCharts TV'sThe Final Bar, guest Julius de Kempenaer of RRG Research shows how his market visualizations still show stocks over bonds and offense over defense. Host David Keller, CMT highlights one industry sector breaking down due to higher crude oil prices.
This video originally...
READ MORE
MEMBERS ONLY
The Bull Case for Commodities
by David Keller,
President and Chief Strategist, Sierra Alpha Research
In this edition of StockCharts TV'sThe Final Bar, David Cox, CFA CMT of Raymond James reviews underperformance for defensive sectors like Utilities and describes why commodities should be an area of focus for investors. Host David Keller, CMT reviews today's drop in ORCL and AAPL as...
READ MORE
MEMBERS ONLY
When Facing a Market Pullback, RUN THESE SCANS!
by David Keller,
President and Chief Strategist, Sierra Alpha Research
In this edition of StockCharts TV'sThe Final Bar, Dave recaps a big up day for TSLA and bearish engulfing pattern for energy stocks. He answers viewer questions on growth stocks during rising rate environment and shares two scans to identify potential opportunities during corrective periods.
This video originally...
READ MORE
MEMBERS ONLY
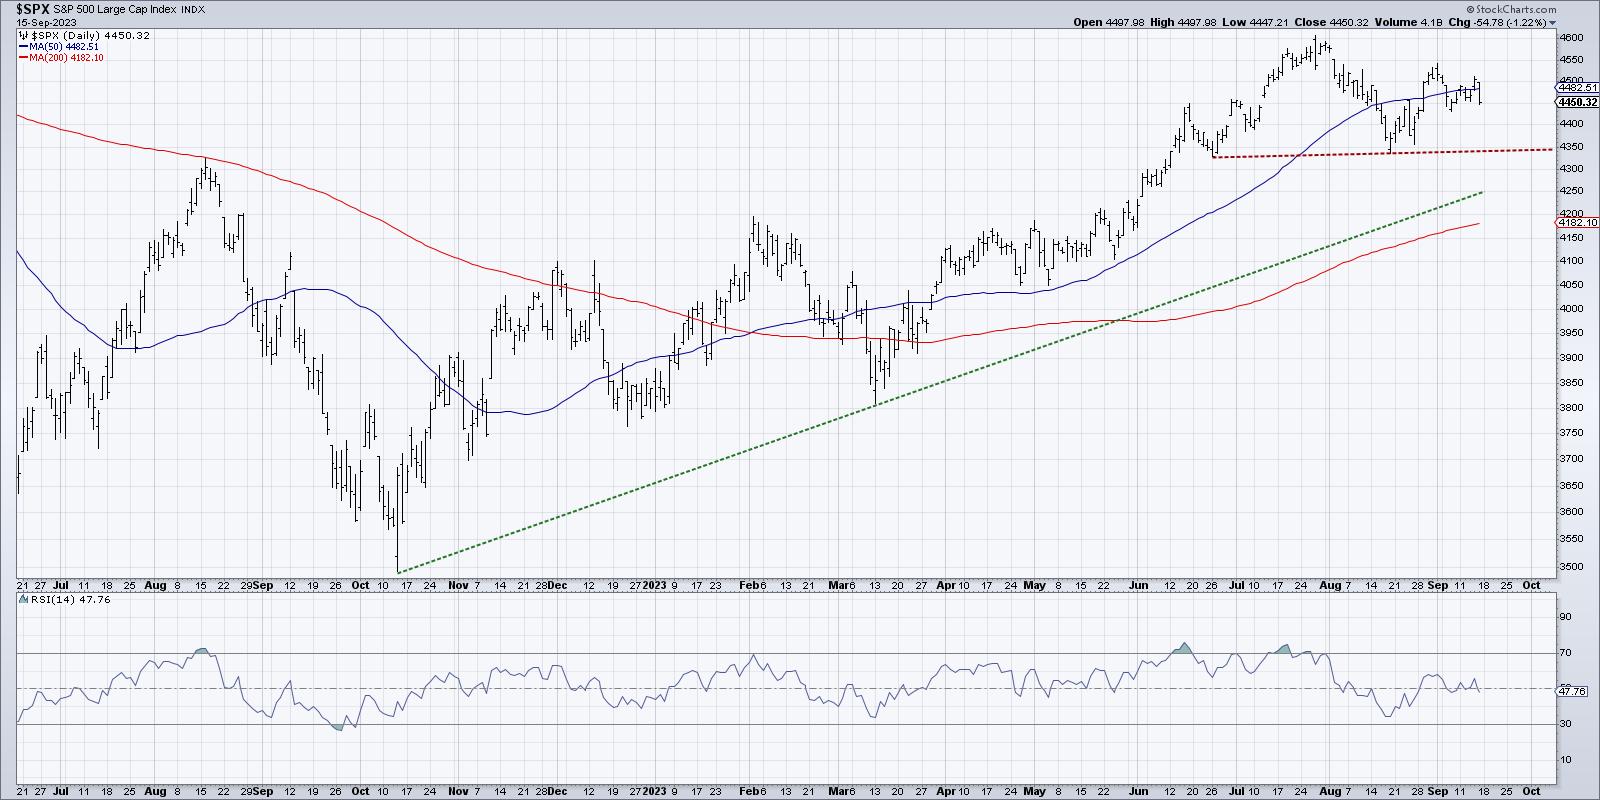
Which is More Likely -- SPX Over 4600 or Below 4200?
by David Keller,
President and Chief Strategist, Sierra Alpha Research
KEY TAKEAWAYS
* Top investors use probabilistic analysis to think through different scenarios to determine which appears the most likely.
* By thinking through each of four potential future paths for the S&P 500, we can be better prepared for whichever scenario actually plays out in the coming weeks.
We...
READ MORE
MEMBERS ONLY
BONDS & CASH - But Can We Find Better Income Alternatives?
by David Keller,
President and Chief Strategist, Sierra Alpha Research
In this edition of StockCharts TV'sThe Final Bar, Dave wraps the week with a focus on weakening breadth conditions, the Russell 2000 and underperformance of small caps, and strong energy stocks driven by stronger crude oil prices. He answers viewer questions on using ETFs instead of bonds or...
READ MORE
MEMBERS ONLY
Crucial Insights: How Rising Rates IMPACT You!
by David Keller,
President and Chief Strategist, Sierra Alpha Research
In this edition of StockCharts TV'sThe Final Bar, guest Willie Delwiche, CMT, CFA of Hi Mount Research outlines the long-term uptrend in interest rates and shares two sectors to focus on given the rising rate environment. Host David Keller, CMT tracks the sharp pullback for semiconductors and breaks...
READ MORE
MEMBERS ONLY
FORGET Valuations, REMEMBER the Charts!
by David Keller,
President and Chief Strategist, Sierra Alpha Research
In this edition of StockCharts TV'sThe Final Bar, guest Ari Wald, CFA, CMT of Oppenheimer & Co. shows how energy stocks are taking a leadership role, with high beta sectors still outperforming low volatility defensive stocks. Host David Keller, CMT tracks the latest downswing and describes a potential...
READ MORE
MEMBERS ONLY
Small-Caps Take BIG Plunge in Risk-Off Move
by David Keller,
President and Chief Strategist, Sierra Alpha Research
In this edition of StockCharts TV'sThe Final Bar, Dave notes severe weakness in the small-cap space as the Russell 2000 forms a potential head-and-shoulders topping pattern. He answers viewer questions on index volume, Coppock curves and running oscillators on breadth indicators.
This video originally premiered on September 5,...
READ MORE
MEMBERS ONLY
Top 10 Charts to Watch, September 2023
by David Keller,
President and Chief Strategist, Sierra Alpha Research
by Grayson Roze,
Chief Strategist, StockCharts.com
In this edition of StockCharts TV'sThe Final Bar, Dave and Grayson co-host a special presentation, wherein they unveil the top 10 charts that are poised to shape the landscape of September 2023.
This video originally premiered on September 4, 2023. Watch on our dedicated Final Bar pageon StockCharts...
READ MORE
MEMBERS ONLY
Three Ways I Use RSI To Analyze Trends
by David Keller,
President and Chief Strategist, Sierra Alpha Research
KEY TAKEAWAYS
* Momentum indicators like RSI can indicate overbought and oversold conditions, suggesting a short-term reversal.
* A bearish divergence, with higher prices and a lower RSI, often occur at the end of a bullish phase.
* By analyzing the range of the RSI, investors can confirm the overall trend phase and...
READ MORE
MEMBERS ONLY
Typical Tesla STALLS Out at 50-Day Moving Average
by David Keller,
President and Chief Strategist, Sierra Alpha Research
In this edition of StockCharts TV'sThe Final Bar, Dave wraps the market week with a discussion of higher interest rates, their implication for growth stocks, and why charts like TSLA shouldn't get an "all clear" until they break above the 50-day moving average. He...
READ MORE
MEMBERS ONLY
Every One of These Breadth Conditions are SCREAMING Risk On!
by David Keller,
President and Chief Strategist, Sierra Alpha Research
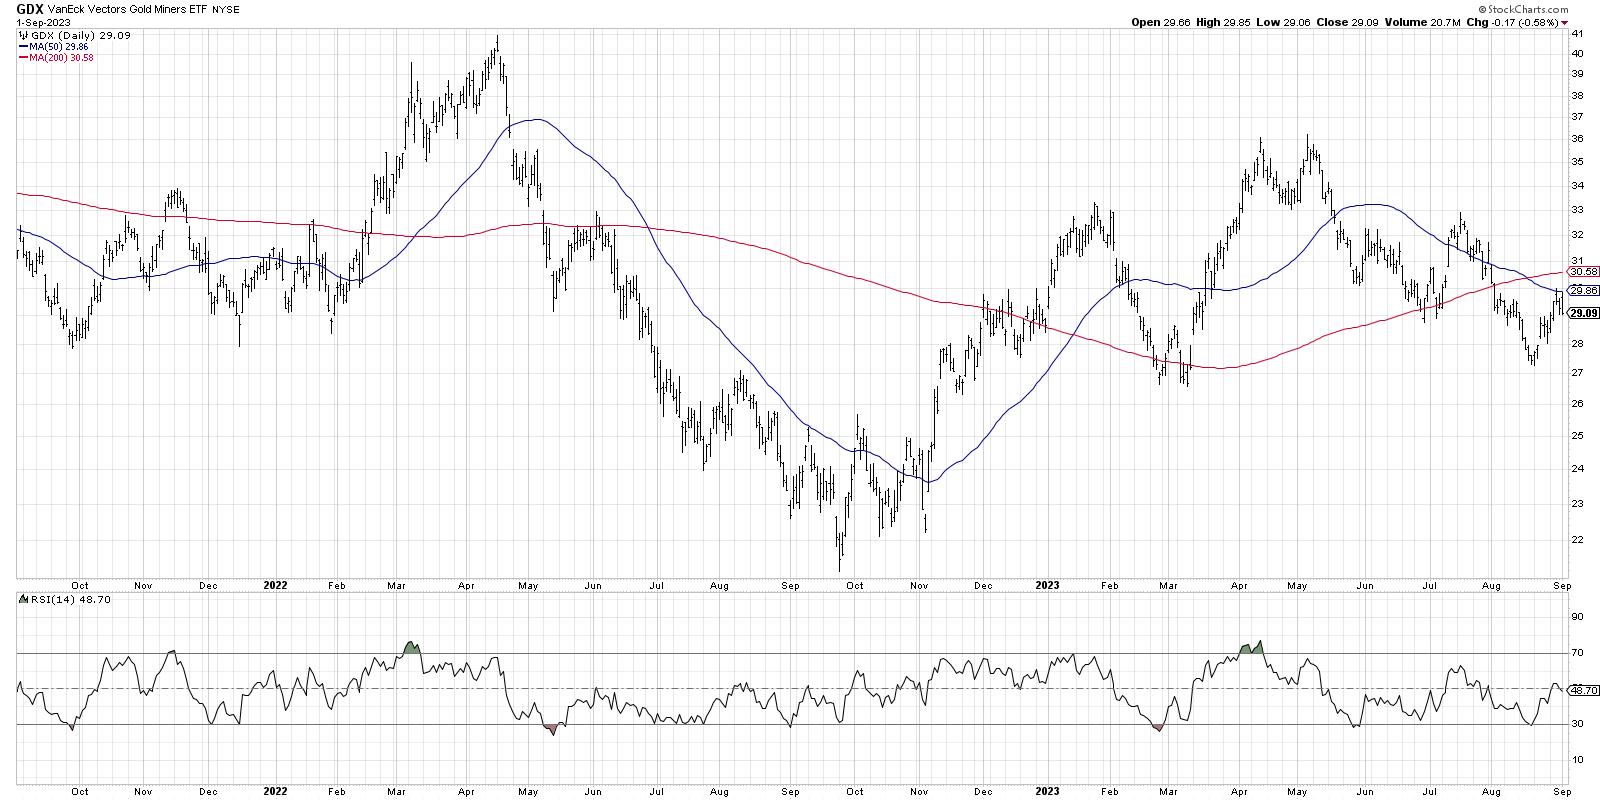
In this edition of StockCharts TV'sThe Final Bar, TG Watkins of Simpler Trading shows how breadth conditions are very similar to previous bull market pullbacks. Dave focuses in on constructive setups in gold and crude oil, then highlights one semiconductor stock featuring a symmetrical triangle pattern.
This video...
READ MORE
MEMBERS ONLY
The Long-Term Bull Case for Bitcoin
by David Keller,
President and Chief Strategist, Sierra Alpha Research
In this edition of StockCharts TV'sThe Final Bar, Adrien Zduńczyk of TheBirbNest charts Bitcoin's bounce off support at $25K and relates bullish Bitcoin trends to a broader risk appetite for investors. Host David Keller, CMT highlights the McClellan Oscillator breaking back above the crucial zero level...
READ MORE
MEMBERS ONLY
Growth Stocks Shine in Short-Covering Rally
by David Keller,
President and Chief Strategist, Sierra Alpha Research
In this special edition of StockCharts TV'sThe Final Bar, Danielle Shay of Simpler Trading breaks down the current short-covering rally and walks through her current setups for QQQ, NVDA, MSFT, and TSLA. Host Dave tracks the recent drop in interest rates and shows how Bitcoin has bounced off...
READ MORE
MEMBERS ONLY
The Five Ratios ALL Investors Should Follow
by David Keller,
President and Chief Strategist, Sierra Alpha Research
In this special edition of StockCharts TV'sThe Final Bar, join Dave as he breaks down the power of ratio analysis and reveals why it's an essential tool for every savvy investor.
This video originally premiered on August 25, 2023. Watch on our dedicated Final Bar pageon...
READ MORE
MEMBERS ONLY
SELL The News! NVDA Trades Lower After Strong Earnings
by David Keller,
President and Chief Strategist, Sierra Alpha Research
In this edition of StockCharts TV'sThe Final Bar, guest Sean McLaughlin of All Star Charts shares best practices for trading options during periods of price consolidation. Host Dave highlights bearish engulfing patterns for the SPY and QQQ, as well as leading growth stocks like MSFT and META.
This...
READ MORE
MEMBERS ONLY
Growth Stocks Seen THRIVING in Anticipation of NVDA Earnings
by David Keller,
President and Chief Strategist, Sierra Alpha Research
In this edition of StockCharts TV'sThe Final Bar, guest Callie Cox of eToro talks growth vs. value in the face of a rising interest rate environment, and why this is the most important "hurdle" for investors to watch. Dave focuses in on the technical picture for...
READ MORE
MEMBERS ONLY
VIX Flashes a Key BEARISH Symbol for Stocks!
by David Keller,
President and Chief Strategist, Sierra Alpha Research
In this edition of StockCharts TV'sThe Final Bar, guest Doug Ramsey, CFA CMT of The Leuthold Group, laments the chronic underperformance of small-cap stocks and reveals a market indicator based on the VIX that gave a bearish signal this week. Dave prepares for NVDA's earnings this...
READ MORE
MEMBERS ONLY
Is There "Blood in the Streets" for August 2023?
by David Keller,
President and Chief Strategist, Sierra Alpha Research
In this edition of StockCharts TV'sThe Final Bar, Dave tracks the dramatic upswing in growth sectors as semiconductor names rally in anticipation of Nvidia's earning release. He answers viewer questions on multiple timeframe analysis and how to know when there is "blood in the streets&...
READ MORE
MEMBERS ONLY
Are You Ready for a Huge Selloff?
by David Keller,
President and Chief Strategist, Sierra Alpha Research
KEY TAKEAWAYS
* The major equity benchmarks have broken initial support levels, fueled by weakening momentum and declining breadth conditions.
* A break below trendline and moving average support could indicate a high likelihood of further potential downside.
* Seasonal studies suggest a strong 4th quarter, so look for a hold of the...
READ MORE
MEMBERS ONLY
Unlocking Insights: Your Top Questions Answered! Q&A with Dave
by David Keller,
President and Chief Strategist, Sierra Alpha Research
In this special "all-mailbag" edition of StockCharts TV'sThe Final Bar, Dave answers viewer questions on trailing stop techniques, when to consider over-weighting small cap stocks, using the MACD indicator for market timing, and much more!
This video originally premiered on August 18, 2023. Watch on our...
READ MORE
MEMBERS ONLY
Heads Up! 10-Year Treasury Yield Could Go All the Way to FIVE Percent?
by David Keller,
President and Chief Strategist, Sierra Alpha Research
In this episode of StockCharts TV'sThe Final Bar, Tony Dwyer of Canaccord Genuity talks Fed policy, corporate bond spreads, and why the level of interest rates is so important here. Host David Keller, CMT reviews the charts of the Magnificent 7 growth stocks and discusses downside objectives for...
READ MORE
MEMBERS ONLY
What Does Equal-Weight S&P 500 Tell Us About Market Strength?
by David Keller,
President and Chief Strategist, Sierra Alpha Research
In this episode of StockCharts TV'sThe Final Bar, Jessica Inskip of OptionsPlay breaks down her weekly charts of the Nasdaq 100, S&P 500, and equal-weight S&P 500 as the risk-off environment for stocks continues. Meanwhile, Dave highlights two stocks flashing the dreaded head-and-shoulders topping...
READ MORE
MEMBERS ONLY
Top Three Things I Wish I Knew Before I Started Trading
by David Keller,
President and Chief Strategist, Sierra Alpha Research
In this episode of StockCharts TV'sThe Final Bar, Dave Landry of DaveLandry.com shares hard-fought words of wisdom from his trading career, including a healthy mix of market knowledge, mental states, and money management tips. Meanwhile, Dave Keller tracks today's downside rotation as the Nasdaq 100...
READ MORE
MEMBERS ONLY
This is GOOD STUFF: A Bullish Engulfing Pattern for Semiconductors!
by David Keller,
President and Chief Strategist, Sierra Alpha Research
In this episode of StockCharts TV'sThe Final Bar, Dave recaps today's market action including a mean reversion move higher for technology, with NVDA up over 7%. Dave also answers questions from The Final Bar Mailbag, including why the 50-day moving average can be so important and...
READ MORE
MEMBERS ONLY
Charting the Great Rotation of 2023
by David Keller,
President and Chief Strategist, Sierra Alpha Research
KEY TAKEAWAYS
* The Nasdaq 100 closed the week below its 50-day moving average, similar to recent breakdowns in leading stocks like MSFT and AAPL.
* Instead of a rotation from offense to defense, this feels more like a rotation from growth sectors to cyclical sectors.
* Energy-related ETFs including XOP and OIH...
READ MORE
MEMBERS ONLY
The Great Rotation of 2023 Continues: Latest Updates and Insights
by David Keller,
President and Chief Strategist, Sierra Alpha Research
In this episode of StockCharts TV'sThe Final Bar, Dave wraps the week, reflecting on both stocks and bonds moving lower as the latest inflation data provides mixed evidence. He opens The Final Bar Mailbag to answer questions on Fibonacci Retracements, moving average support, and how institutions trade large...
READ MORE
MEMBERS ONLY
Market Update: CPI-Fueled Rally Fizzles Out as Stocks Sag
by David Keller,
President and Chief Strategist, Sierra Alpha Research
In this episode of StockCharts TV'sThe Final Bar, guest Mish Schneider of MarketGauge talks higher rates and why China may deserve a second look for investors. Host David Keller, CMT highlights one key industry group feeling the pain as TSLA heads toward trend line support.
This video originally...
READ MORE
MEMBERS ONLY
Stocks Selloff into Close After Failing at Resistance
by David Keller,
President and Chief Strategist, Sierra Alpha Research
In this episode of StockCharts TV'sThe Final Bar, David Keller, CMT tracks the market's downside rotation as the S&P 4500 level once again serves as key resistance. He highlights semiconductor names, including NVDA and AVGO, that are breaking below their 50-day moving average, then...
READ MORE
MEMBERS ONLY
Market Breadth Indicators Signal Selling Phase
by David Keller,
President and Chief Strategist, Sierra Alpha Research
In this episode of StockCharts TV'sThe Final Bar, David Keller, CMT tracks the initial selloff and subsequent recovery for the S&P 500 and Nasdaq, with bullish candle patterns popping up on charts like AAPL. He digs into market breadth indicators, which have signaled a likely rotation...
READ MORE
MEMBERS ONLY
A HUGE Double Top Pattern in the S&P 500?
by David Keller,
President and Chief Strategist, Sierra Alpha Research
In this episode of StockCharts TV'sThe Final Bar, Dave sets the table for this week with a focus on FAANG stocks breaking down (MSFT, AAPL) vs. those still trending higher (META, GOOGL) as well as a potential rotation into financials XLF and energy XLE. He answers viewer questions...
READ MORE
MEMBERS ONLY
Growth Stocks Begin Down a Slippery Slope
by David Keller,
President and Chief Strategist, Sierra Alpha Research
KEY TAKEAWAYS
* Two key breadth indicators, the McClellan Oscillator and the Nasdaq 100 Bullish Percent Index, both registered bearish signals this week.
* While AMZN gapped higher on earnings and AAPL plunged lower, both stocks ended the week with bearish candle patterns.
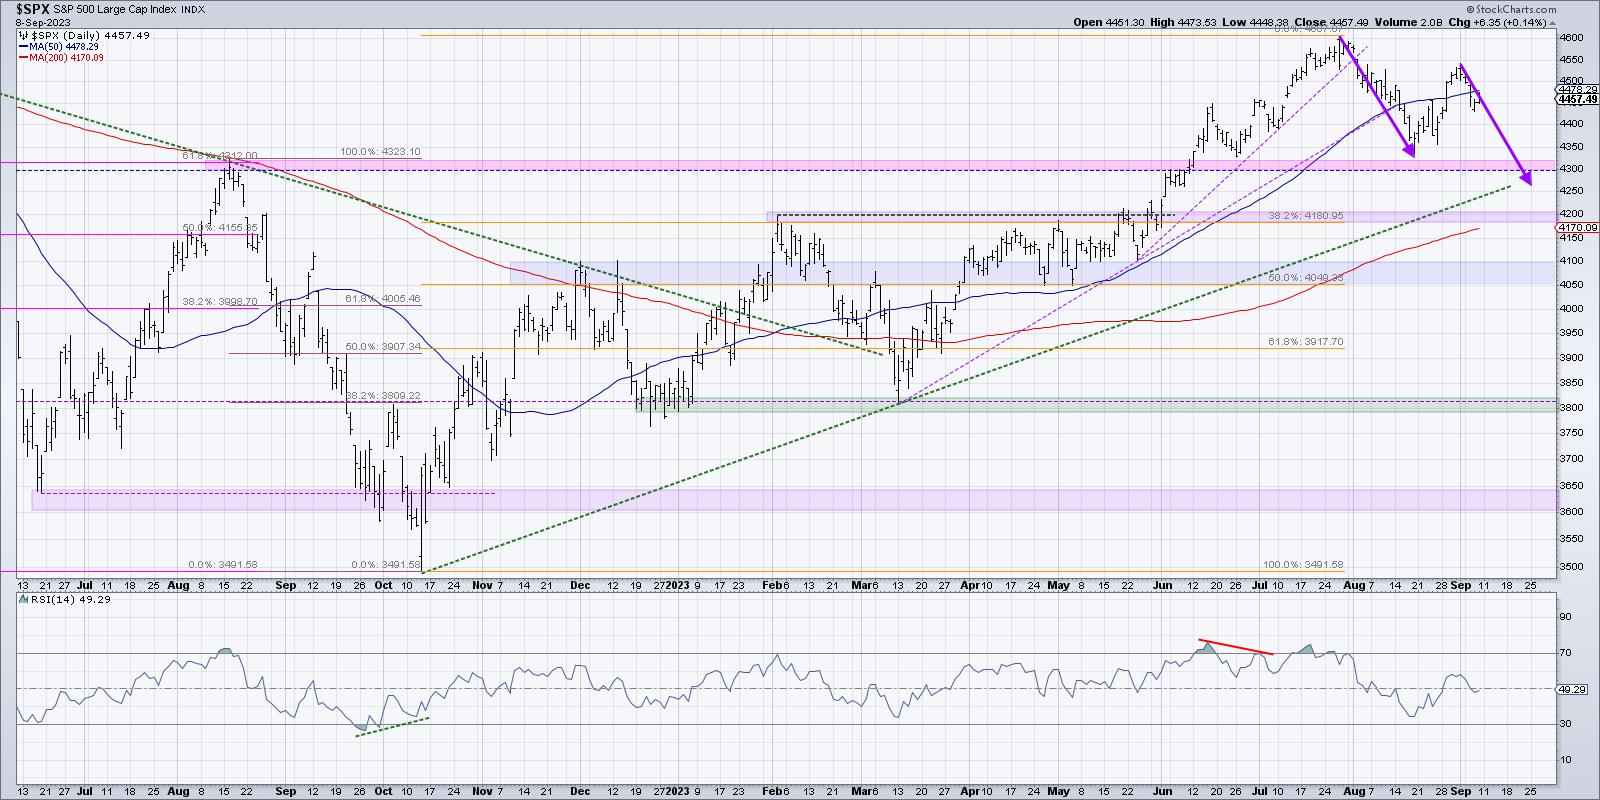
* Investors can use Fibonacci Retracements along with moving averages...
READ MORE
MEMBERS ONLY
Tech Stocks Face BIG TIME Thrashing as Apple Disappoints
by David Keller,
President and Chief Strategist, Sierra Alpha Research
In this episode of StockCharts TV'sThe Final Bar, Dave tracks the bearish rotation for the technology sector as earnings misses for AAPL, PANW, FTNT, and others put downside pressure on the Nasdaq. He answers viewer questions on On Balance Volume, Chaikin Money Flow, and technical analysis techniques when...
READ MORE
MEMBERS ONLY
Caclulating the Risk of S&P 500 Downside Below October 2022 Low
by David Keller,
President and Chief Strategist, Sierra Alpha Research
In this episode of StockCharts TV'sThe Final Bar, guest Jeff Huge, CMT of JWH Investment Partners shares his Elliott Wave chart of the S&P 500, including a downside projection well below the October 2022 low. Host David Keller, CMT reveals another market breadth indicator registering a...
READ MORE
MEMBERS ONLY
Growth Stocks are PLUNGING Now? Blame Fitch Downgrade!
by David Keller,
President and Chief Strategist, Sierra Alpha Research
In this episode of StockCharts TV'sThe Final Bar, guest Jay Woods, CMT of Freedom Capital Markets talks downside targets for the S&P 500 and Nasdaq 100, and also highlights one key sector with upside potential. Meanwhile, Dave reveals a huge sell signal from an important measure...
READ MORE
MEMBERS ONLY
Pay Attention to THIS! The Market is About to Skyrocket
by David Keller,
President and Chief Strategist, Sierra Alpha Research
In this episode of StockCharts TV'sThe Final Bar, guest Ari Wald, CFA CMT of Oppenheimer shows how overbought conditions have actually been a long-term bullish signal for the S&P 500 and Nasdaq. Dave highlights stocks reporting earnings today, including Eaton Corporation (ETN), Caterpillar (CAT), Stanley Black...
READ MORE
MEMBERS ONLY
Breaking Down the Heavy Earnings Week
by David Keller,
President and Chief Strategist, Sierra Alpha Research
In this episode of StockCharts TV'sThe Final Bar, Dave breaks down a heavy earnings week featuring AAPL, AMZN, COIN, PYPL, COP, and others. Will this week illustrate the rotation from growth sectors like technology to value sectors like energy and materials? Dave also answers viewer questions on chart...
READ MORE