MEMBERS ONLY
Bearish Divergences Plaguing Former Leadership Names
by David Keller,
President and Chief Strategist, Sierra Alpha Research
KEY TAKEAWAYS
* META and NFLX remain in strong uptrend phases, with limited drawdowns in 2025.
* Four of the Mag7 names can be classified as "broken charts", with recent breakdowns representing an important change of character.
* AMZN and GOOGL offer perhaps the most concerning short-term patterns, with bearish momentum...
READ MORE
MEMBERS ONLY
Are the Once High-Flying MAG 7 Stocks Just Mediocre Now?
by David Keller,
President and Chief Strategist, Sierra Alpha Research
In this video, Dave breaks down the formerly high-flying Mag 7 stocks into three distinct buckets. These include long & strong (META, NFLX & AMZN), broken down (TSLA, AAPL, MSFT & NVDA), and questionable (GOOGL). He also shows how GOOGL is not the only leading name featuring a bearish momentum...
READ MORE
MEMBERS ONLY
Three Technical Tools to Minimize Endowment Bias
by David Keller,
President and Chief Strategist, Sierra Alpha Research
Have you ever held on too long to a winning position? You watch as that former top performer in your portfolio slows down, and then rotates lower, and then really begins to deteriorate, and you just watch it all happen without taking action?
If the answer is "yes"...
READ MORE
MEMBERS ONLY
Top 10 Charts to Watch for in February 2025
by David Keller,
President and Chief Strategist, Sierra Alpha Research
While the major equity averages are certainly up year-to-date, we're detecting a growing number of signs of leadership rotation. As the Magnificent 7 stocks have begun to falter, with charts like Apple Inc. (AAPL) taking on a less-than-magnificent luster in February, we've identified ten key stocks...
READ MORE
MEMBERS ONLY
Three Behavioral Biases Impacting Your Portfolio Right Now
by David Keller,
President and Chief Strategist, Sierra Alpha Research
In this video, Dave reveals three common behavioral biases, shows how they can negatively impact your portfolio returns, and describes how to use the StockCharts platform to minimize these biases in your investment process. He also shares specific examples, from gold to Pfizer to the S&P 500, and...
READ MORE
MEMBERS ONLY
What's NEXT for Semiconductors After Monday's SHOCKING Drop?
by David Keller,
President and Chief Strategist, Sierra Alpha Research
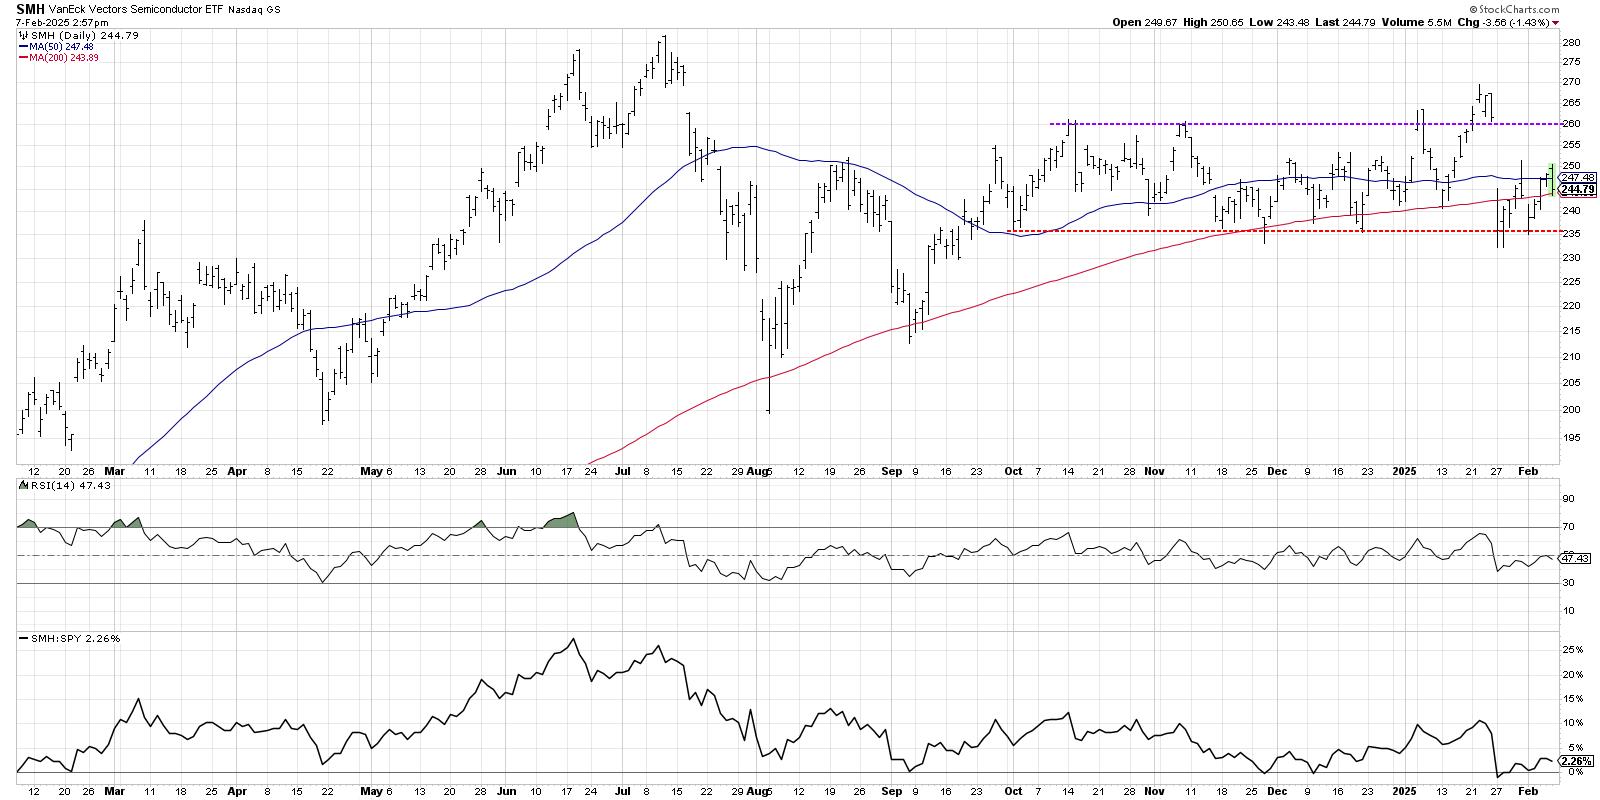
In this video, Dave reviews the VanEck Semiconductor ETF (SMH) from a technical analysis perspective. He focuses on the recent failure at price gap resistance, the breakdown below price and moving average support, and the frequent appearance of bearish engulfing patterns which have often indicated major highs over the last...
READ MORE
MEMBERS ONLY
Semiconductors Have More to Prove Before Breakout is Believed
by David Keller,
President and Chief Strategist, Sierra Alpha Research
KEY TAKEAWAYS
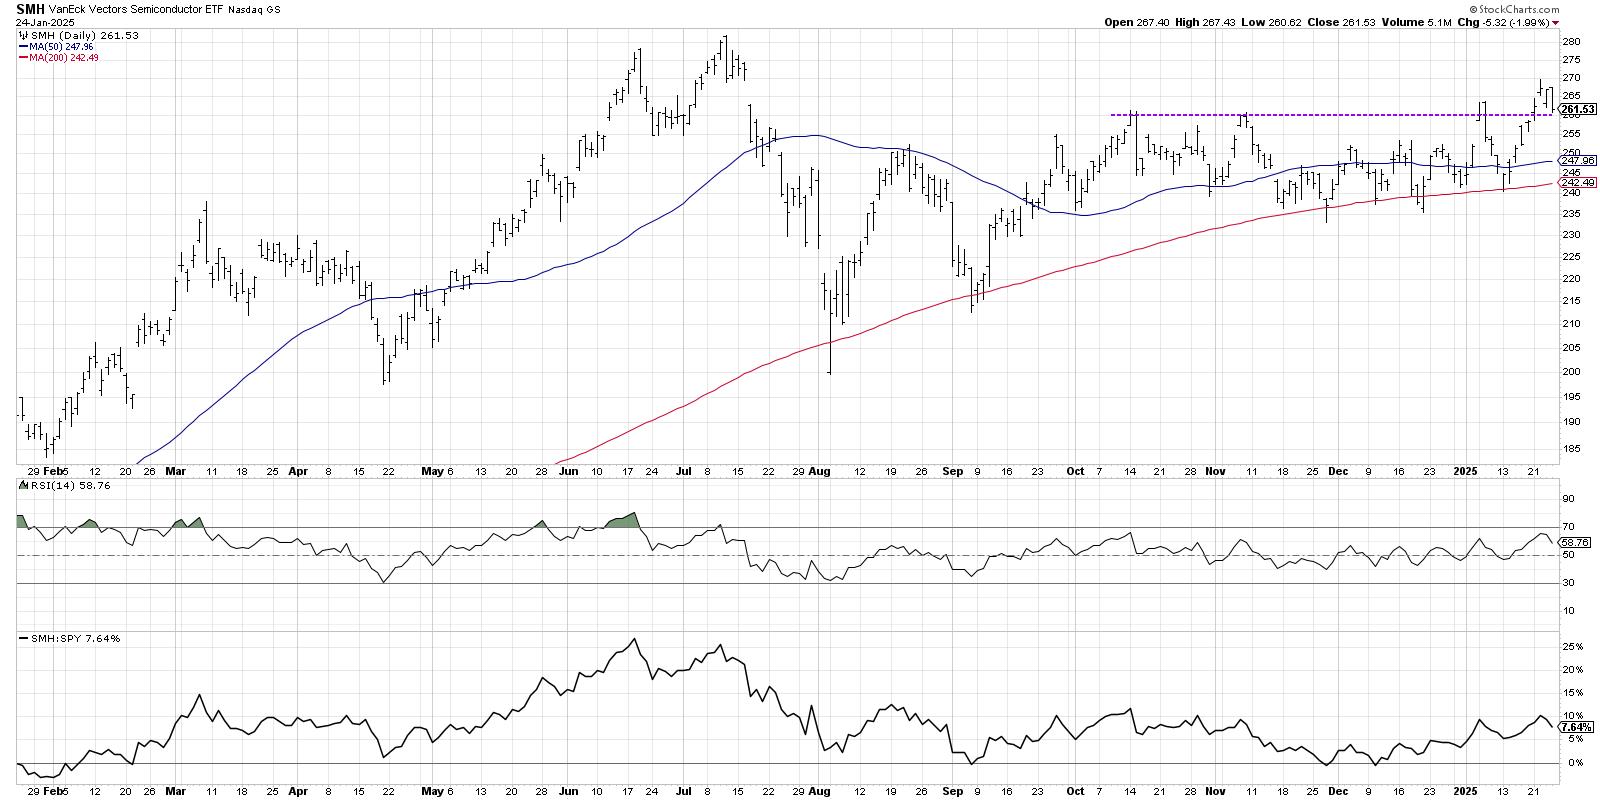
* The VanEck Vectors Semiconductor ETF (SMH) broke out of a six-month base this week, suggesting further upside potential.
* While the breakout in SMH appears bullish, the ETF still has yet to eclipse a key price gap from July 2025.
* A bearish engulfing pattern to end the week indicates...
READ MORE
MEMBERS ONLY
Market Internals Point to Large Growth Leadership
by David Keller,
President and Chief Strategist, Sierra Alpha Research
KEY TAKEAWAYS
* While the stronger US Dollar suggests caution for growth stocks, the ratios shows that growth continues to dominate value.
* While macro conditions appear beneficial for small cap stocks, large caps are back to a confirmed leadership role.
* Measures of offense vs. defensive suggest that investors are favoring offense...
READ MORE
MEMBERS ONLY
Five Key Market Ratios Every Investor Should Follow
by David Keller,
President and Chief Strategist, Sierra Alpha Research
In this video, Dave shares five charts from his ChartList of market ratios that investors can use to track changing market conditions through 2025. If you want to better track shifts in market leadership, identify where funds are flowing, and stay on top of evolving market trends, make sure to...
READ MORE
MEMBERS ONLY
How the S&P 500 Reaches 6500 By March 2025
by David Keller,
President and Chief Strategist, Sierra Alpha Research
KEY TAKEAWAYS
* The S&P 500 experienced a sudden upside reversal to finish the week right around the 6000 level.
* If the market reacts positively to earnings, and Trump's new administration takes a more conservative approach, we could see the S&P 500 reach 6500 by...
READ MORE
MEMBERS ONLY
What Would It Take For Small Caps to Lead?
by David Keller,
President and Chief Strategist, Sierra Alpha Research
KEY TAKEAWAYS
* Financials represent one of the top sector weights in the IWM, and banks have kicked off earnings season with renewed strength.
* A resurgence in biotech stocks, one of the largest industries represented in the IWM, could provide an upside catalyst.
* US Dollar strength could adversely impact mega cap...
READ MORE
MEMBERS ONLY
The Bullish Case for Small Caps vs. Large Caps
by David Keller,
President and Chief Strategist, Sierra Alpha Research
Will small cap stocks finally take on a leadership role in 2025? In this video, Dave provides a thorough technical analysis discussion of the Russell 2000 ETF (IWM) and how that compares to the current technical configuration of the S&P 500 index. He also shares three charts he&...
READ MORE
MEMBERS ONLY
S&P 500 Breakdown Alert! Downside Targets Explained
by David Keller,
President and Chief Strategist, Sierra Alpha Research
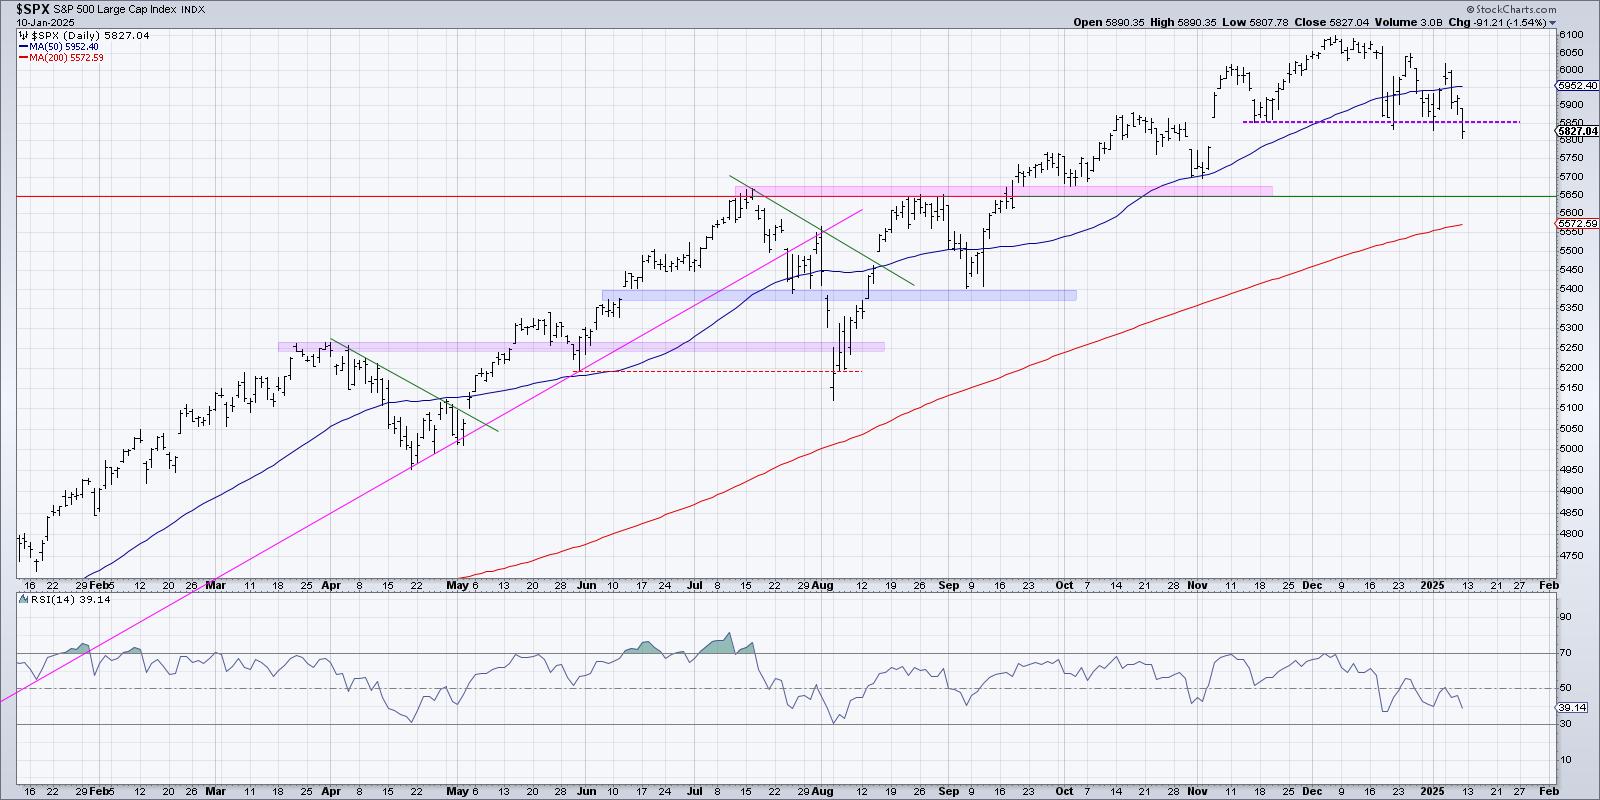
KEY TAKEAWAYS
* The break of SPX 5850 suggests further downside in January for the equity benchmarks.
* Using price pattern analysis, we can use the height of the head and shoulders pattern to determine potential support around SPX 5600.
* We can further validate this downside target using Fibonacci Retracements and moving...
READ MORE
MEMBERS ONLY
What Higher Rates Could Mean for the S&P 500
by David Keller,
President and Chief Strategist, Sierra Alpha Research
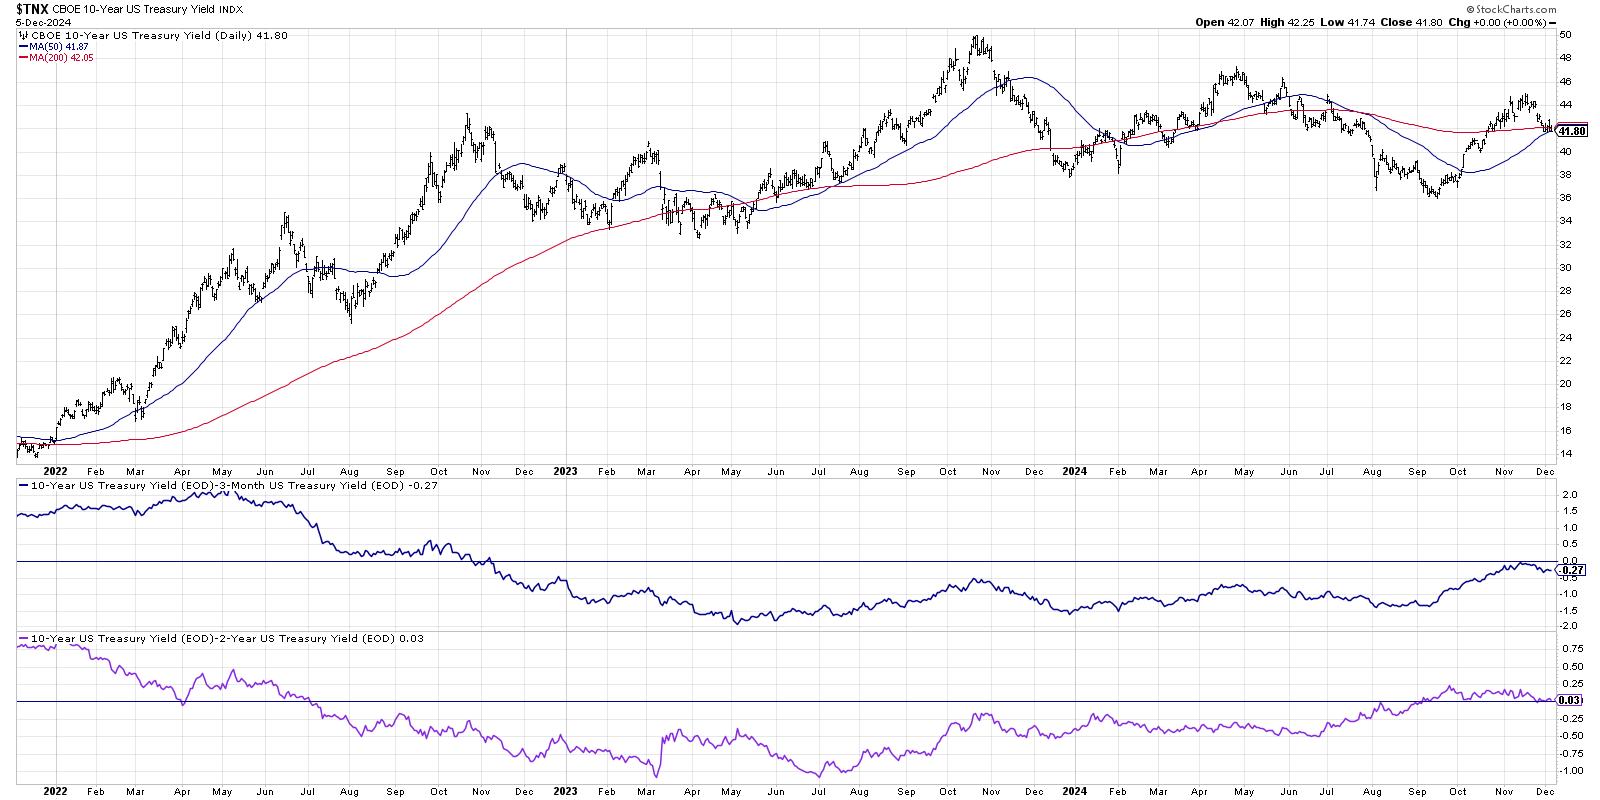
KEY TAKEAWAYS
* Higher interest rates can directly impact industry groups like homebuilders, which are driven by consumers borrowing money.
* While a normal shaped yield curve suggests optimism for economic growth, the transition from an inverted yield curve usually results in weaker stock prices.
* The market trend remains the most important...
READ MORE
MEMBERS ONLY
Rising Rates Suggest Weaker Stocks - Here's What I'm Watching!
by David Keller,
President and Chief Strategist, Sierra Alpha Research
In this video, Dave shares a long-term analysis of the Ten-Year Treasury Yield, breaks down how the shape of the yield curve has been a great leading indicator of recessionary periods and weaker stock prices, and outlines the chart he's watching to determine if early 2025 will look...
READ MORE
MEMBERS ONLY
2024's Big Bang: A Deeper Dive Into the Hindenburg Omen
by David Keller,
President and Chief Strategist, Sierra Alpha Research
KEY TAKEAWAYS
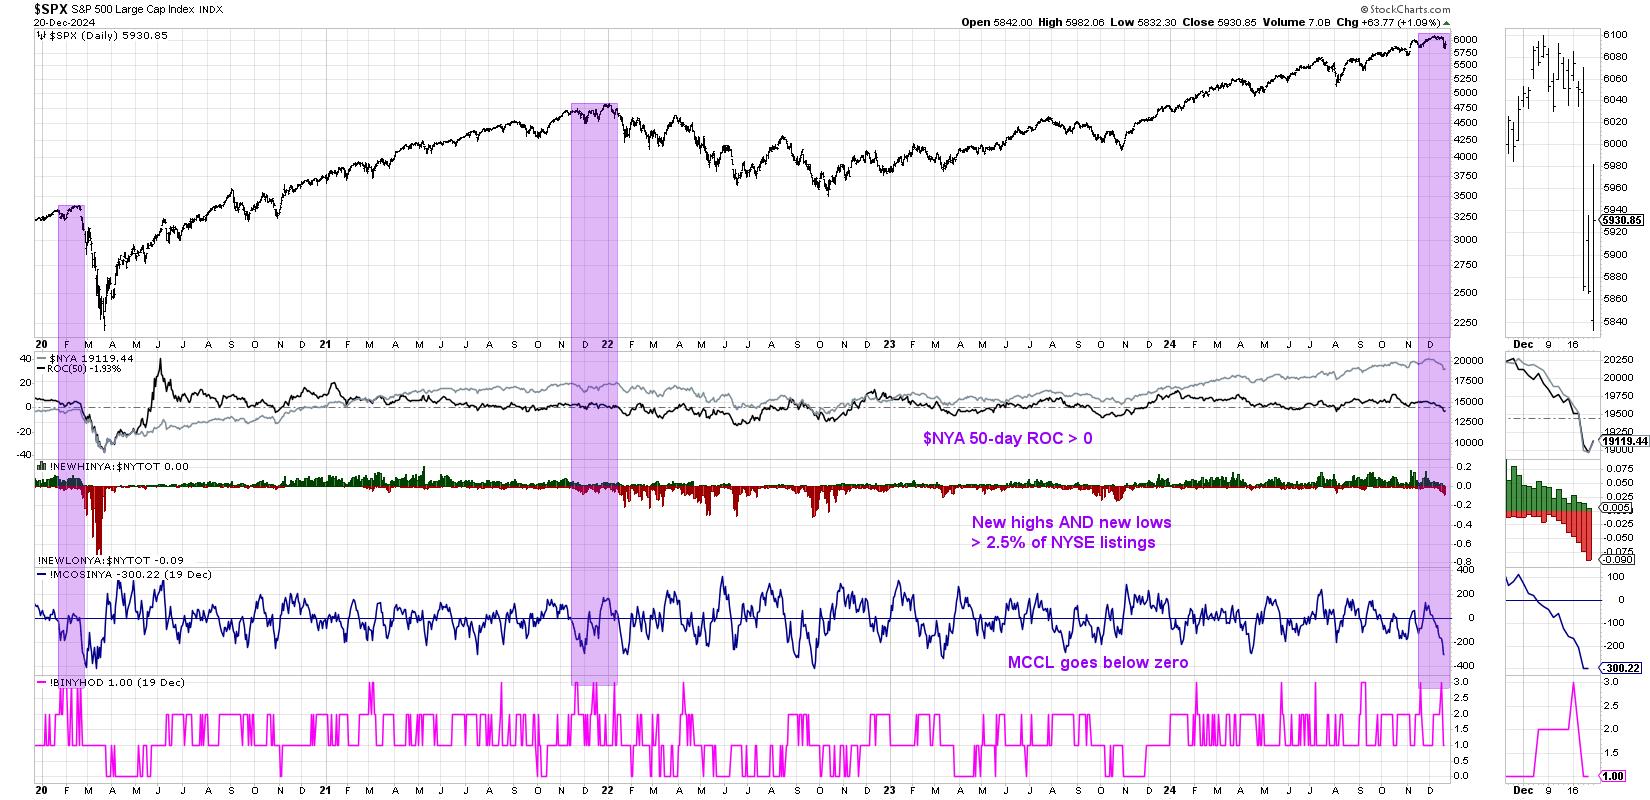
* The Hindenburg Omen looks for patterns that have consistently shown at major market tops.
* Using trend-following techniques like support and resistance levels can help to improve accuracy of macro indicators.
* S&P 5850 remains the most important level in our view going into year-end 2024.
This week...
READ MORE
MEMBERS ONLY
The Big Divergence in Bullish Percents
by David Keller,
President and Chief Strategist, Sierra Alpha Research
While the S&P 500 and Nasdaq 100 have been holding steady into this week's Fed meeting, warning signs under the hood have suggested one of two things is likely to happen going into Q1. Either a leadership rotation is amiss, with mega-cap growth stocks potentially taking...
READ MORE
MEMBERS ONLY
Will the QQQ Sell Off in January? Here's How It Could Happen
by David Keller,
President and Chief Strategist, Sierra Alpha Research
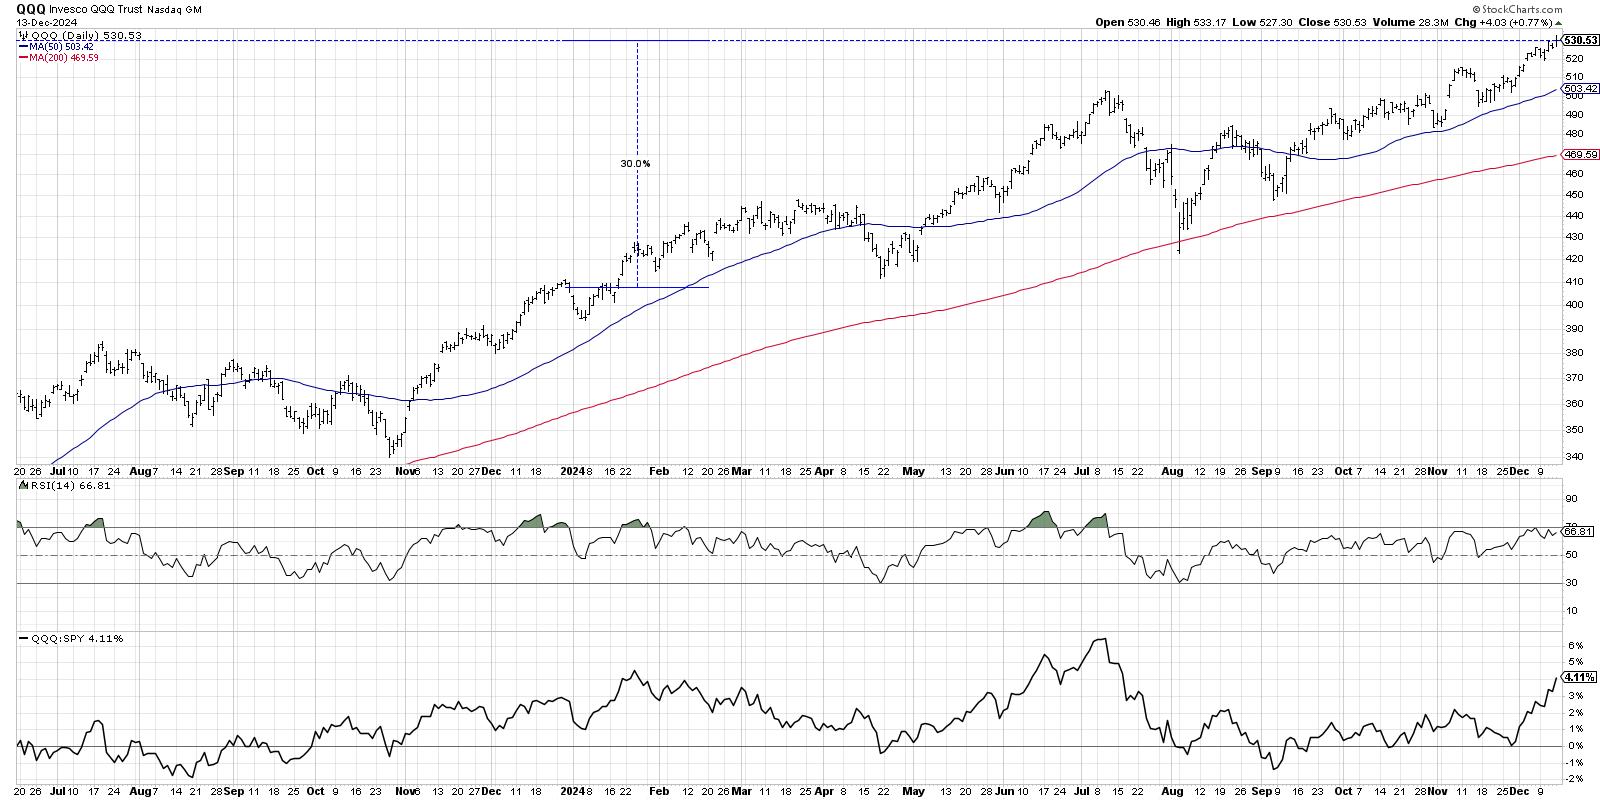
In recent interviews for my Market Misbehavior podcast, I've asked technical analysts including Frank Cappelleri, TG Watkins, and Tom Bowley what they see happening as we wrap a very successful 2024. With the Nasdaq 100 logging about a 30% gain for 2024, it's hard to imagine...
READ MORE
MEMBERS ONLY
3 WAYS to Pinpoint When a Stocks Uptrend is Ending
by David Keller,
President and Chief Strategist, Sierra Alpha Research
In this video, Dave unveils his "line in the sand" technique to help determine when stocks in established uptrends may be near the end of the bullish phase. He'll share specific levels he's watching for the S&P 500, AMZN, TMUS, and KR,...
READ MORE
MEMBERS ONLY
The Most Important Chart to Watch Into Year-End 2024
by David Keller,
President and Chief Strategist, Sierra Alpha Research
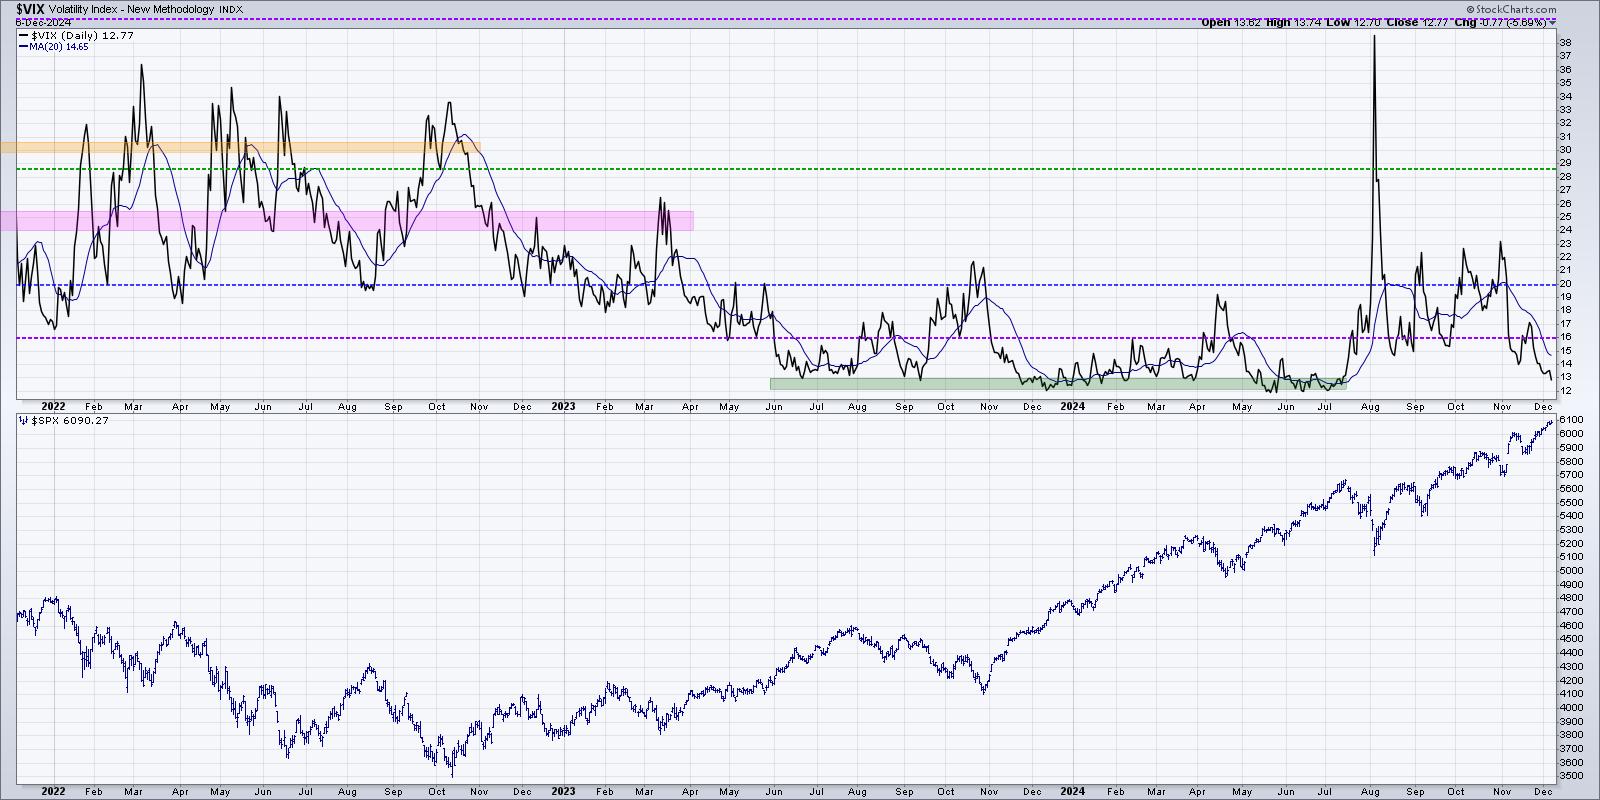
KEY TAKEAWAYS
* Low VIX reading implies that conditions are favorable for stocks.
* The MOVE index is basically a VIX for bonds, and can help to corroborate volatility readings across asset classes.
* High yield spreads remain quite narrow, implying bond investors perceive a low risk environment.
"The market goes up...
READ MORE
MEMBERS ONLY
Two ETFs That Could Thrive Based on a Normal Yield Curve
by David Keller,
President and Chief Strategist, Sierra Alpha Research
My recent discussions on the Market Misbehavior podcasthave often included some comments on the interest rate environment, particularly the shape of the yield curve. We've had an inverted yield curve since late 2022, and so the yield curve taking on a more normal shape could mean a huge...
READ MORE
MEMBERS ONLY
Can You Really Predict Stock Market Success Using the Yield Curve?
by David Keller,
President and Chief Strategist, Sierra Alpha Research
In this video, Dave reflects on the shape of the yield curve during previous bull and bear cycles with the help of StockCharts' Dynamic Yield Curve tool. He shares insights on interest rates as investors prepare for the final Fed meeting of 2024, and shares two additional charts he&...
READ MORE
MEMBERS ONLY
Five Ways You Should Use ChartLists Starting Today!
by David Keller,
President and Chief Strategist, Sierra Alpha Research
Having used many technical analysis platforms over my career as a technical analyst, I can tell you with a clear conscience that the ChartList feature on StockCharts provides exceptional capabilities to help you identify investment opportunities and manage risk in your portfolio. Once you get your portfolio or watch list...
READ MORE
MEMBERS ONLY
Five Must-Have Tools for Analyzing Stock Charts
by David Keller,
President and Chief Strategist, Sierra Alpha Research
In this video, Dave shares how he uses the powerful ChartLists feature on StockCharts to analyze trends and momentum shifts as part of his daily, weekly, and monthly chart routines. He shows how mindful investors can use ChartLists to identify inflection points, focus on top performers, analyze performance trends, and...
READ MORE
MEMBERS ONLY
2024 is Shaping Up Like 2021, Which Did Not End Particularly Well
by David Keller,
President and Chief Strategist, Sierra Alpha Research
I've always found technical analysis to be a fantastic history lesson for the markets. If you want to consider how the current conditions relate to previous market cycles, just compare the charts; you'll usually have a pretty good starting point for the discussion.
As we near...
READ MORE
MEMBERS ONLY
Sector Rotation Suggests Offense Over Defense
by David Keller,
President and Chief Strategist, Sierra Alpha Research
KEY TAKEAWAYS
* Relative strength trends show a recent rotation into Consumer Discretionary, Communication Services, Financials, and Energy.
* The offense to defense ratio still favors "things you want" over "things you need."
* RRG charts give a fairly clear roadmap of what to look for rotation-wise into early...
READ MORE
MEMBERS ONLY
Three Ways Top Investors Track Sector Rotation
by David Keller,
President and Chief Strategist, Sierra Alpha Research
In this video, Dave outlines three tools he uses on the StockCharts platform to analyze sector rotation, from sector relative strength ratios to the powerful Relative Rotation Graphs (RRG). Dave shares how institutional investors think about sector rotation strategies, evaluating the current evidence to determine how money managers are allocating...
READ MORE
MEMBERS ONLY
Are the Magnificent 7 Still the Kings of Wall Street?
by David Keller,
President and Chief Strategist, Sierra Alpha Research
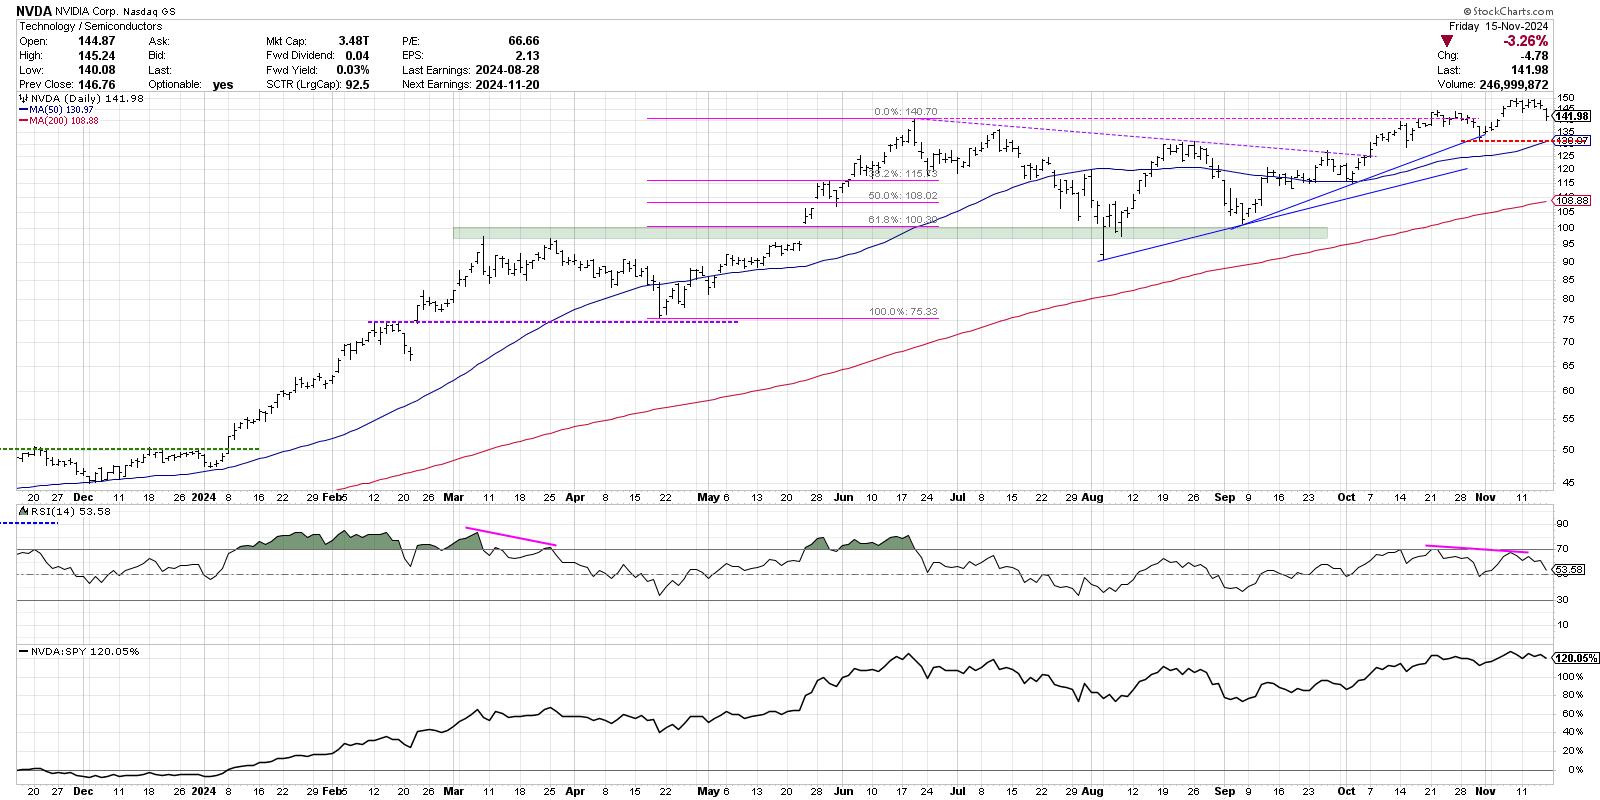
KEY TAKEAWAYS
* The Breakout Names have already broken to new all-time highs in Q4, but will they be able to hold those gains?
* The Consolidating Charts have failed to break to new highs, so it's all about watching key price support levels.
* The Wild Cards may be the...
READ MORE
MEMBERS ONLY
The Sign of Strong Charts Getting Stronger
by David Keller,
President and Chief Strategist, Sierra Alpha Research
I was originally taught to use RSI as a swing trading tool, helping me to identify when the price of a particular asset was overextended to the upside and downside. And, on the swing trading time frame, that approach very much works, especially if you employ a shorter time period...
READ MORE
MEMBERS ONLY
Are Extremely Overbought Conditions Good or Bad for Stocks?
by David Keller,
President and Chief Strategist, Sierra Alpha Research
When a stock shows an RSI value above 80, is that a good thing or a bad thing? In this video, Dave reviews a series of examples showing this "extreme overbought" condition, highlights how these signals usually occur not at the end of, but often earlier in an...
READ MORE
MEMBERS ONLY
Short-Term Bearish Signal as Markets Brace for News-Heavy Week
by David Keller,
President and Chief Strategist, Sierra Alpha Research
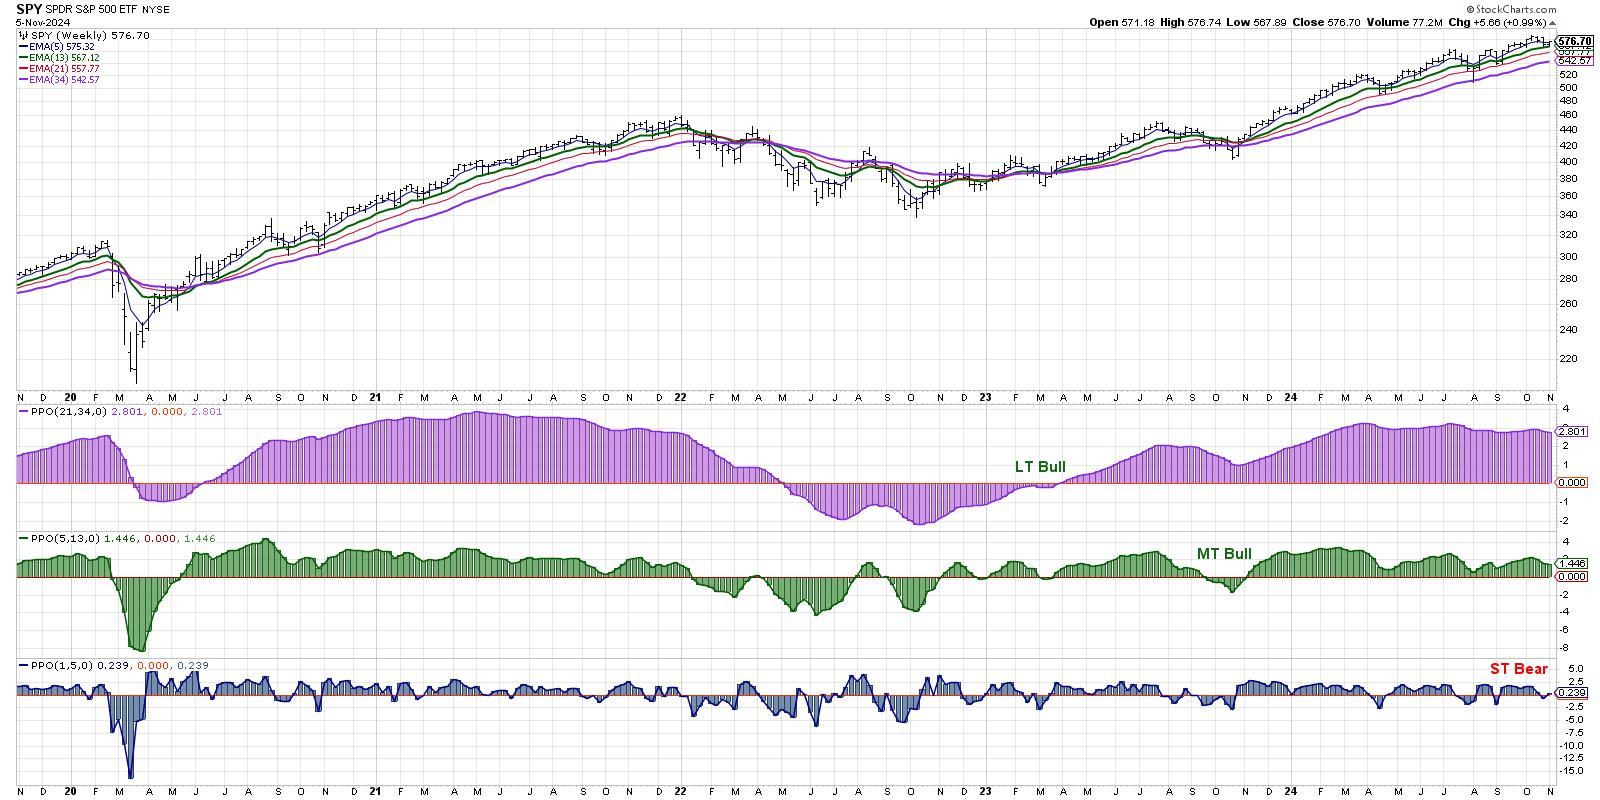
KEY TAKEAWAYS
* We can define the market trend on multiple time frames using a series of exponential moving averages.
* While our short-term Market Trend Model turned bearish last week, the medium-term and long-term models remain bullish.
* 2021 could provide a compelling analogue to what we're experiencing so far...
READ MORE
MEMBERS ONLY
Market Trend Model Flashes Short-Term Bearish, What's Next?
by David Keller,
President and Chief Strategist, Sierra Alpha Research
In this video, Dave breaks down the three time frames in his Market Trend Model, reveals the short-term bearish signal that flashed on Friday's close, relates the current configuration to previous bull and bear market cycles, and shares how investors can best track this model to ensure they&...
READ MORE
MEMBERS ONLY
Top Ten Charts to Watch for November 2024
by David Keller,
President and Chief Strategist, Sierra Alpha Research
With the Magnificent 7 stocks struggling to hold up through a tumultuous earnings season, what sort of opportunities are emerging on the charts going into November? Today, we'll break down some of the names we've included in our Top Ten Charts to Watch for November 2024....
READ MORE
MEMBERS ONLY
Will Breadth Divergences Signal the End of the Bull?
by David Keller,
President and Chief Strategist, Sierra Alpha Research
KEY TAKEAWAYS
* A negative McClellan Oscillator suggests short-term weakness in breadth conditions.
* About 30% of the S&P 500 members have already broken down below their 50-day moving average.
* The Bullish Percent Index has broken a key bearish threshold, indicating that many stocks have already begun bearish trends.
As...
READ MORE
MEMBERS ONLY
Top 5 Breadth Indicators You Can't Afford to Ignore!
by David Keller,
President and Chief Strategist, Sierra Alpha Research
In this video, Dave digs into five market breadth indicators every investor should track as we navigate a volatile period including Q3 earnings, the US elections, and the November Fed meeting. He breaks down key insights on each of the five charts, talks about why breadth indicators are equal-weighted, and...
READ MORE
MEMBERS ONLY
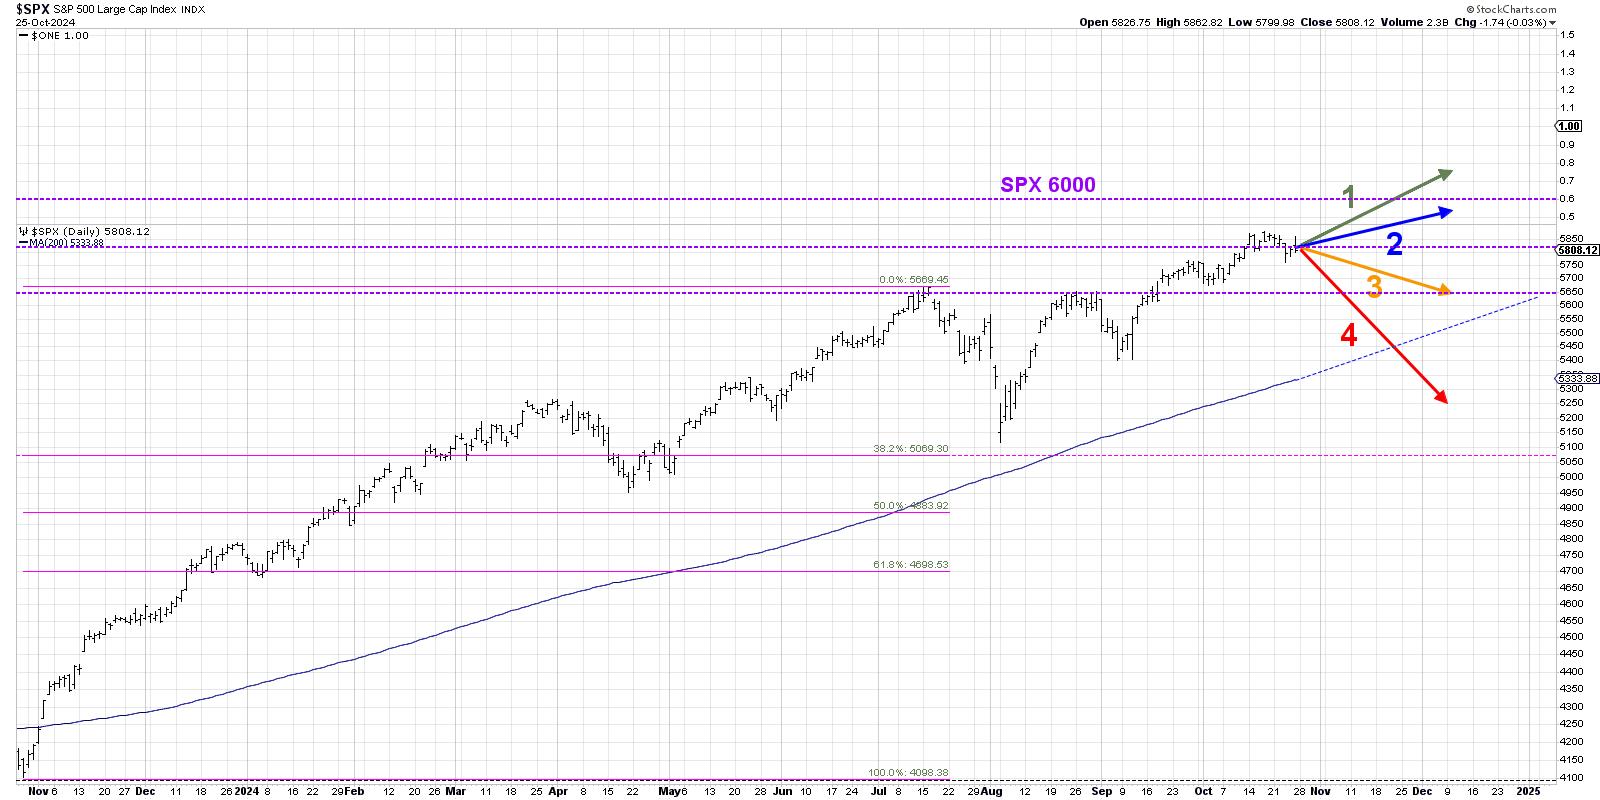
Why the S&P 500 Won't Break 6000 (Yet)
by David Keller,
President and Chief Strategist, Sierra Alpha Research
When I was growing up, I loved Choose Your Own Adventure books. I see the world in shades of gray instead of black-and-white, so I was immediately drawn to the seemingly endless scenarios that the main characters could experience as I made different choices for them.
As investors, we often...
READ MORE
MEMBERS ONLY
Three Ways to Visualize the Start of a Potential Distribution Phase
by David Keller,
President and Chief Strategist, Sierra Alpha Research
KEY TAKEAWAYS
* The S&P 500 is nearing trendline support, which could provide a crucial signal of downside rotation.
* Market breadth indicators are beginning to diverge from the index, trending lower in the month of October.
* The MarketCarpet visualization shows a concerning drop in the mega-cap growth names which...
READ MORE
MEMBERS ONLY
What's the BEST Market Visualization Tool?
by David Keller,
President and Chief Strategist, Sierra Alpha Research
How do you track movements of all the S&P 500 stocks on any given trading day? In this video, Dave will show you how he uses the StockCharts MarketCarpet to evaluate broad equity market conditions, assess the changes in the mega-cap stocks which dominate the benchmarks, and identify...
READ MORE
MEMBERS ONLY
Does the MACD Histogram Hold the Secret to Anticipating Trend Changes?
by David Keller,
President and Chief Strategist, Sierra Alpha Research
KEY TAKEAWAYS
* The MACD and PPO indicators are trend-following devices designed to confirm a trend reversal has occurred.
* The histogram shows when the MACD indicator is showing signs of a potential reversal, providing more of a leading indicator.
* Investors can use other indicators, such as the Chandelier Exit system, on...
READ MORE
MEMBERS ONLY
The Master Sentiment Chart You Need to Follow
by David Keller,
President and Chief Strategist, Sierra Alpha Research
KEY TAKEAWAYS
* The put/call ratio measures volumes in the options market to compare bullish vs. bearish positioning.
* The AAII Survey is close to the 50% bullish level, which often coincides with major market tops.
* The NAAIM Exposure Index, currently just above 90%, tells us that money managers are not...
READ MORE