MEMBERS ONLY
Top 10 Stocks to Watch in July 2024!
by David Keller,
President and Chief Strategist, Sierra Alpha Research
by Grayson Roze,
Chief Strategist, StockCharts.com
In this edition of StockCharts TV'sThe Final Bar, join Dave and Grayson as they run through top 10 charts to watch in July 2024! They'll cover breakout strategies, moving average techniques, relative strength, and much more. You don't want to miss these insights into...
READ MORE
MEMBERS ONLY
Can the S&P 500 Move Meaningfully Higher Without NVDA?
by David Keller,
President and Chief Strategist, Sierra Alpha Research
2024 has been a year marked by exceptional returns for a relatively small number of high-flying growth stocks. In recent weeks, top performers like Nvidia (NVDA) have pulled back, and Super Micro Computer (SMCI) remains well below its all-time high from earlier this year. So can the major equity benchmarks...
READ MORE
MEMBERS ONLY
The 4 Best Tech Stocks to Watch Now!
by David Keller,
President and Chief Strategist, Sierra Alpha Research
In this edition of StockCharts TV'sThe Final Bar, Dave shares charts for Palo Alto Networks, Arista Networks, Adobe Systems, and Fortinet, four tech stocks that are all pushing higher despite major indexes remaining sideways going into Friday's economic releases. He also breaks down the chart of...
READ MORE
MEMBERS ONLY
Two Consumer Stocks Popping to New Swing Highs!
by David Keller,
President and Chief Strategist, Sierra Alpha Research
In this edition of StockCharts TV'sThe Final Bar, Dave recaps Wednesday's late-stage rally for the S&P 500. He analyzes the charts of FDX, TSLA, RIVN, AMZN, and GLW, and reviews what a stronger US Dollar could mean for the SPX and Nasdaq.
See Dave&...
READ MORE
MEMBERS ONLY
Cruise Line Stocks Just Exploded! Here's What You Need to Know
by David Keller,
President and Chief Strategist, Sierra Alpha Research
In this edition of StockCharts TV'sThe Final Bar, Dave highlights technical analysis takeaways for NVDA, ENPH, PNR, GLD, and Bitcoin. He also breaks down the sudden resurgence in stocks like CCL, the benefits of long-term trend analysis on the weekly chart of the Nasdaq 100 (QQQ), and how...
READ MORE
MEMBERS ONLY
Nvidia Plunges Over 6% to Mark the End of the AI Trade?
by David Keller,
President and Chief Strategist, Sierra Alpha Research
In this edition of StockCharts TV'sThe Final Bar, Dave tracks the rapid and concerning deterioration in semiconductors, with stocks like NVDA and AVGO pushing lower after last week's bearish candle patterns. He then dives into the downturn in Bitcoin, the impressive recovery for energy stocks, and...
READ MORE
MEMBERS ONLY
Why Technical Analysis Does NOT Work for Leveraged ETFs
by David Keller,
President and Chief Strategist, Sierra Alpha Research
In this edition of StockCharts TV'sThe Final Bar, Dave answers viewer questions on using technical indicators on leveraged and inverse ETFs like SOXL and SOXS, buying breakouts below the 200-day moving average, upside targets for gold, and whether the $USD is in a primary uptrend.
See Dave'...
READ MORE
MEMBERS ONLY
Bearish Engulfing Patterns Forming on NVDA & MU
by David Keller,
President and Chief Strategist, Sierra Alpha Research
In this edition of StockCharts TV'sThe Final Bar, Dave recaps a day where technology shares struggles, with leading names like NVDA and MU dropping bearish engulfing patterns to indicate short-term distributions. He also addresses the ongoing divergence between large caps and small caps, the upside potential for energy...
READ MORE
MEMBERS ONLY
NVDA Wreaks Havoc on Technology Benchmark
by David Keller,
President and Chief Strategist, Sierra Alpha Research
In this edition of StockCharts TV'sThe Final Bar, Dave celebrates Nvidia's rise to overtake Microsoft (MSFT) as the largest company by market cap, creating chaos in the Technology Sector ETF (XLK) with implications for Apple (AAPL). He points out that 10% of the S&P...
READ MORE
MEMBERS ONLY
It's TOO EARLY to Be Bullish on Tesla
by David Keller,
President and Chief Strategist, Sierra Alpha Research
In this edition of StockCharts TV'sThe Final Bar, Dave breaks down an upside follow-through day for the S&P 500 and Nasdaq, and highlights the continued weakness in market breadth indicators. Dave identifies key levels to watch for GLD, FSLR, ENPH, TSLA, AVGO, and BIO. Focusing in...
READ MORE
MEMBERS ONLY
Could the QQQ Turn Dramatically Lower?
by David Keller,
President and Chief Strategist, Sierra Alpha Research
There is no denying the strength of the bullish primary trend for stocks off the April low. The Nasdaq 100 index continues to make new all-time highs, closing just under $480 on Friday after gaining about 3.5% over the last week. But will this incredible uptrend continue into July...
READ MORE
MEMBERS ONLY
Breadth Thrust Can Validate a New Bull Phase for Stocks
by David Keller,
President and Chief Strategist, Sierra Alpha Research
In this edition of StockCharts TV'sThe Final Bar, Dave describes how the "breadth thrust", popularized by legendary market strategist Martin Zweig, can help to validate a new bull phase for stocks. He answers viewer questions on pairs trades, running technical indicators like RSI on price ratios,...
READ MORE
MEMBERS ONLY
Bearish Divergences in 2 KEY Growth Stocks: BEWARE!
by David Keller,
President and Chief Strategist, Sierra Alpha Research
In this edition of StockCharts TV'sThe Final Bar, Dave recaps a fresh new all-time high for the S&P 500, a concerning "hanging man" candle for the SPY, and troubling bearish divergences on the charts of AMZN and GOOGL. He also breaks down short-term and...
READ MORE
MEMBERS ONLY
S&P 500 Above 5400: Economic Optimism or Irrational Exuberance?
by David Keller,
President and Chief Strategist, Sierra Alpha Research
In this edition of StockCharts TV'sThe Final Bar, Dave recaps the continued optimism for technology shares following this morning's bullish CPI data and the Fed's statements suggesting a Goldilocks scenario for risk assets. He also breaks down key technical signals and levels for AAPL,...
READ MORE
MEMBERS ONLY
Apple Blasts Through $200 On AI Optimism
by David Keller,
President and Chief Strategist, Sierra Alpha Research
In this edition of StockCharts TV'sThe Final Bar, Dave reviews key charts from a technical analysis perspective, including AAPL, FSLR, MSTR, and STT. He also addresses the potential bearish momentum divergence for the S&P 500 index and reviews the negative breadth conditions, with new 52-week lows...
READ MORE
MEMBERS ONLY
NVDA Stock Split Launches S&P 500 Higher
by David Keller,
President and Chief Strategist, Sierra Alpha Research
In this edition of StockCharts TV'sThe Final Bar, Dave recaps a bullish day for stocks, with 8 out of 11 S&P 500 sectors finishing higher. He breaks down the charts of NVDA, ENPH, FSLR, and AMD, and reviews a potential upside reversal in gold.
See Dave&...
READ MORE
MEMBERS ONLY
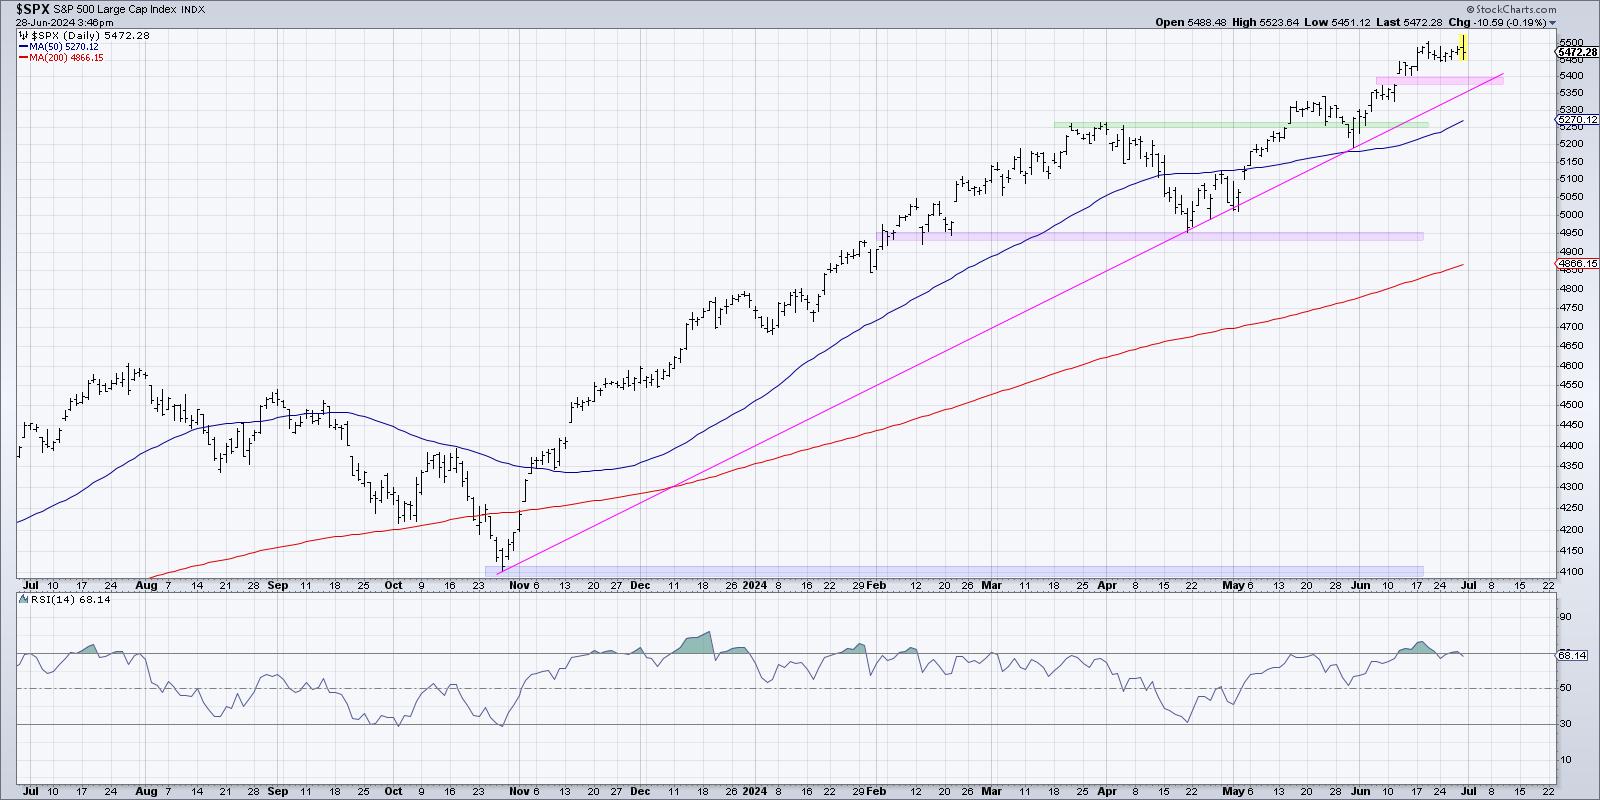
Tracking the Three Signs of the Bear
by David Keller,
President and Chief Strategist, Sierra Alpha Research
There is no denying that the primary trend for the S&P 500 remains bullish as we push to the end of Q2 2024. But what about the conditions "under the hood" of the major benchmarks? Today, we'll highlight three "signs of the bear&...
READ MORE
MEMBERS ONLY
Hindenburg Omen Flashes Initial Sell Signal
by David Keller,
President and Chief Strategist, Sierra Alpha Research
While the S&P 500 did manage to finish the week above tactical support at 5250, one of the most widely-followed macro technical indicators recently registered an initial sell signal for the second time in 2024. Today we'll explain the three components of the Hindenburg Omen, show...
READ MORE
MEMBERS ONLY
MUST SEE! Top 10 Stock Picks For June 2024
by David Keller,
President and Chief Strategist, Sierra Alpha Research
by Grayson Roze,
Chief Strategist, StockCharts.com
In this edition of StockCharts TV'sThe Final Bar, join Dave and Grayson as they run through top 10 charts to watch in June 2024! They'll cover breakout strategies, moving average techniques, relative strength, and much more. You don't want to miss these insights into...
READ MORE
MEMBERS ONLY
S&P 500 Sinks on Software and Semiconductor SELLOFF
by David Keller,
President and Chief Strategist, Sierra Alpha Research
In this edition of StockCharts TV'sThe Final Bar, Dave welcomes Jonathan Krinsky, CMT of BTIG. Jonathan speaks to the weakness in market breadth conditions and the software group as a key space to watch for relative strength weakness. David breaks down the relationship between the S&P...
READ MORE
MEMBERS ONLY
Failed Bearish Patterns are Bullish for S&P 500!
by David Keller,
President and Chief Strategist, Sierra Alpha Research
In this edition of StockCharts TV'sThe Final Bar, Dave welcomes Frank Cappelleri, CMT CFA of CappThesis. Frank shares how the bull market phase has been marked by confirmed and completed bullish patterns and failed breakdowns after bearish patterns. Meanwhile, Dave discusses the rising interest rate environment, what it...
READ MORE
MEMBERS ONLY
Three Stock Ideas as S&P 500 Treads Water
by David Keller,
President and Chief Strategist, Sierra Alpha Research
In this edition of StockCharts TV'sThe Final Bar, Dave welcomes Tony Zhang of OptionsPlay. Tony shares three stock ideas showing favorable risk/reward characteristics as the S&P 500 index treads water above support at 5250. David describes the deteriorating market breadth conditions and reviews charts of...
READ MORE
MEMBERS ONLY
Technical Indicator Showdown: MACD vs. PPO vs. PMO
by David Keller,
President and Chief Strategist, Sierra Alpha Research
In this edition of StockCharts TV'sThe Final Bar, Dave answers viewer questions from The Final Bar Mailbag. He outlines the differences between the MACD, PPO, and PMO indicators, covers the mechanics of corporate buybacks, examines the basics of candlestick analysis, and discusses whether applying trendline analysis to the...
READ MORE
MEMBERS ONLY
Dow Theory Flashes Bear Signal
by David Keller,
President and Chief Strategist, Sierra Alpha Research
Dow Theory is based on the foundational work of Charles Dow, considered the "Father of Technical Analysis." Many of the tools we employ to better analyze market structure and investor sentiment, from trend analysis to index construction, are derived from Dow's original essays from the early...
READ MORE
MEMBERS ONLY
S&P 500 Downside Target 4800?!
by David Keller,
President and Chief Strategist, Sierra Alpha Research
In this edition of StockCharts TV'sThe Final Bar, Dave welcomes Jeff Huge, CMT of JWH Investment Partners. David reflects on NVDA's gap higher, quick deterioration in market breadth indicators, and bearish candle patterns for ON and HOOD. Jeff shares his downside target for the S&...
READ MORE
MEMBERS ONLY
Growth is Alive and Kicking for S&P 500
by David Keller,
President and Chief Strategist, Sierra Alpha Research
In this edition of StockCharts TV'sThe Final Bar, Dave welcomes Mike Singleton of Invictus Research. David highlights a bearish momentum divergence for gold, and also illustrates how mid-cap and small-cap stocks have yet to make new highs in Q2. Mike paints a bullish picture for stocks based on...
READ MORE
MEMBERS ONLY
These Sectors are Showing Strength as S&P 500 Soars!
by David Keller,
President and Chief Strategist, Sierra Alpha Research
In this edition of StockCharts TV'sThe Final Bar, Dave is joined by special guest Julius de Kempenaer of RRG Research. Dave hits on the out-performance of traditionally defensive sectors and breaks down the charts of FSLR, NVDA, and more. Julius, meanwhile, is cautiously optimistic as the equity indexes...
READ MORE
MEMBERS ONLY
Bitcoin Blasts ABOVE 70K!
by David Keller,
President and Chief Strategist, Sierra Alpha Research
In this edition of StockCharts TV'sThe Final Bar, Dave highlights strong market breadth as the S&P 500 digests last week's break above 5300 and Bitcoin powers above the crucial 70K level. He also breaks down key technical levels for CCL, HD, ZM, MSTR, NFLX,...
READ MORE
MEMBERS ONLY
The One Chart to Watch as S&P 500 Makes New All-Time Highs
by David Keller,
President and Chief Strategist, Sierra Alpha Research
As the S&P 500 and Nasdaq 100 have once again made new all-time highs, and the Dow Jones Industrial Average has briefly broken above the 40,000 level for the first time, how should we think about further upside for our equity benchmarks?
There are two general ways...
READ MORE
MEMBERS ONLY
TOP 10 Stock Picks for May 2024
by David Keller,
President and Chief Strategist, Sierra Alpha Research
In this edition of StockCharts TV'sThe Final Bar, join Dave and Grayson as they run through the top 10 charts to watch in May 2024! They'll cover breakout strategies, moving average techniques, relative strength, and much more. You don't want to miss these insights...
READ MORE
MEMBERS ONLY
Larry Williams: Dow 40k, Cycle Analysis, and Lessons Learned
by David Keller,
President and Chief Strategist, Sierra Alpha Research
In this edition of StockCharts TV'sThe Final Bar, legendary trader and author Larry Williams joins Dave in the StockCharts TV studio. Larry shares his latest thoughts on Dow 40K, the resilient rise of gold and precious metals, cycle analysis on the S&P 500 and crude oil,...
READ MORE
MEMBERS ONLY
China Tariffs Drive Upside for Rare Earth Minerals
by David Keller,
President and Chief Strategist, Sierra Alpha Research
In this edition of StockCharts TV'sThe Final Bar, Dave welcomes Mish Schneider of MarketGauge. Mish breaks down one materials name that could benefit from recently announced China tariffs, and describes how regional banks could benefit from Fed actions in 2024. David charts the S&P 500'...
READ MORE
MEMBERS ONLY
Watch for Higher Lows in These Three Tech Stocks
by David Keller,
President and Chief Strategist, Sierra Alpha Research
In this edition of StockCharts TV'sThe Final Bar, Dave uncovers strength in SQSP using the Stochastics Oscillator and the StochRSI indicator. He shares his favorite chart for analyzing relative strength ratios for leading stocks, and also answers viewer questions on price patterns for XLB and PYPL, plus best...
READ MORE
MEMBERS ONLY
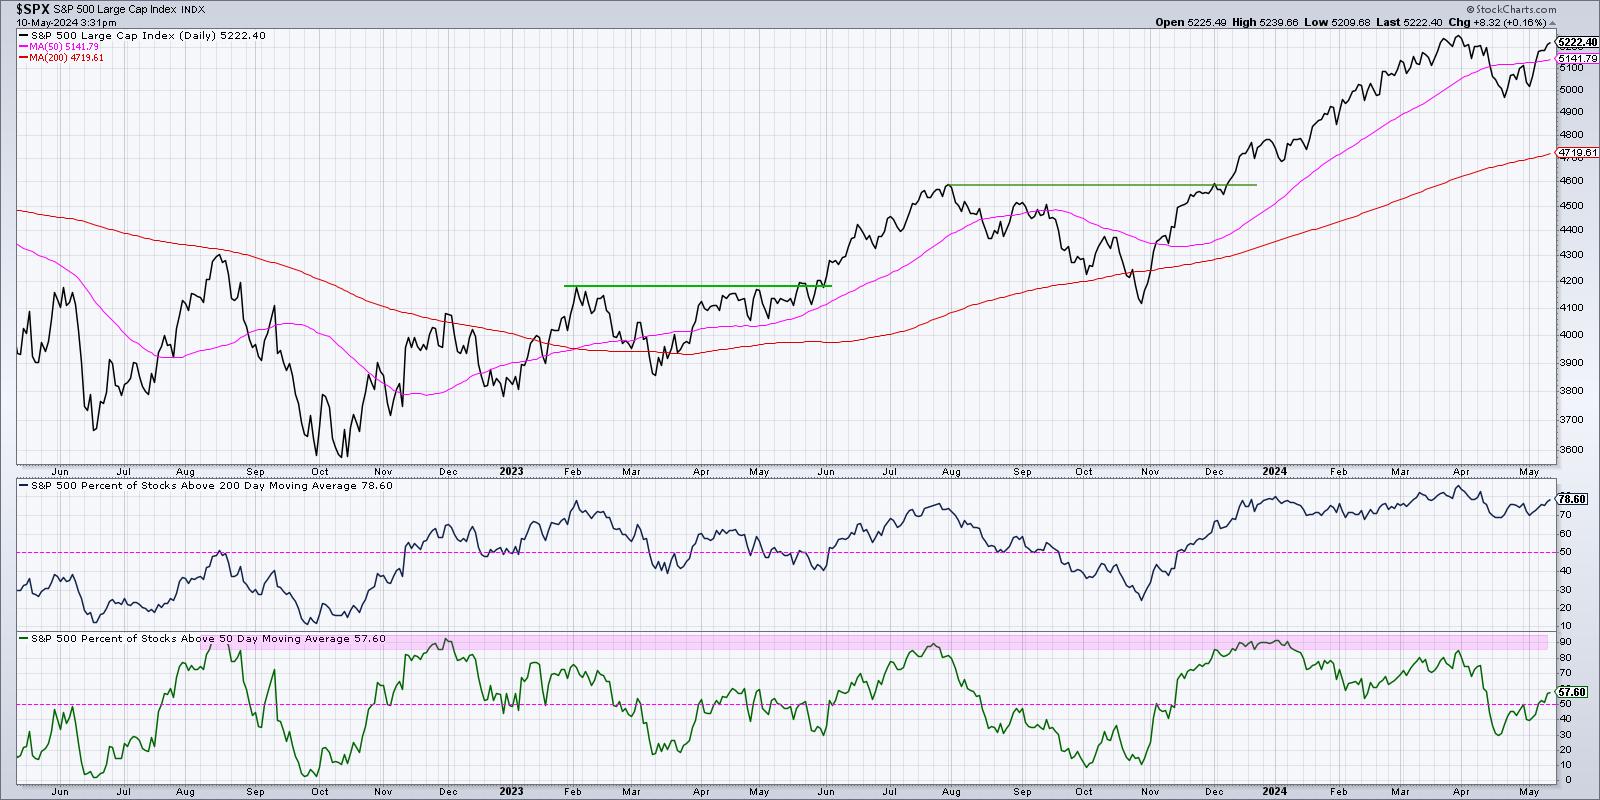
Three Breadth Indicators to Confirm a Bullish Market Trend
by David Keller,
President and Chief Strategist, Sierra Alpha Research
There's no denying the strength the major averages have displayed off their April lows. The S&P 500 finished the week within a rounding error of the previous all-time high around 5250. What would it take for the SPX and NDX to power to new all-time highs...
READ MORE
MEMBERS ONLY
Relative Strength Screams Bullish for This Tech Stock
by David Keller,
President and Chief Strategist, Sierra Alpha Research
In this edition of StockCharts TV'sThe Final Bar, Dave uncovers strength in SQSP using the Stochastics Oscillator and the StochRSI indicator. He shares his favorite chart for analyzing relative strength ratios for leading stocks, and also answers viewer questions on price patterns for XLB and PYPL, plus best...
READ MORE
MEMBERS ONLY
Stocks Pop Higher as Defensive Sectors Thrive
by David Keller,
President and Chief Strategist, Sierra Alpha Research
In this edition of StockCharts TV'sThe Final Bar, Dave breaks down an unusual day for stocks. The S&P 500 and Nasdaq closed higher, but the top sectors were defensive - real estate and utilities! He shares key levels to watch for NVDA, AAPL, TSLA, and more,...
READ MORE
MEMBERS ONLY
The Top Performing Sector is Utilities?!?
by David Keller,
President and Chief Strategist, Sierra Alpha Research
In this edition of StockCharts TV'sThe Final Bar, Dave recaps a choppy day for equities, with utilities remaining atop the leaderboard for a second straight session. He lays out a potential reversal in interest rates, what that could mean for growth stocks, and recaps earnings plays including WYNN,...
READ MORE
MEMBERS ONLY
Is the S&P 500 Forming a Bear Flag Pattern?
by David Keller,
President and Chief Strategist, Sierra Alpha Research
In this edition of StockCharts TV'sThe Final Bar, Dave focuses in on price pattern analysis for the S&P 500, then reflects on the emergence of defensive sectors like consumer staples. He also recaps earnings movers, including DIS, SHOP, and more.
This video originally premiered on May...
READ MORE
MEMBERS ONLY
The Market Breadth Indicator You Should Be Following
by David Keller,
President and Chief Strategist, Sierra Alpha Research
In this edition of StockCharts TV'sThe Final Bar, Dave recaps another strong day for stocks as the S&P 500 regains its 50-day moving average. He then identifies key levels to watch for PLTR, LCID, NFLX, NVDA, and AAPL, and breaks down the latest market breadth indicator...
READ MORE
MEMBERS ONLY
Key Breadth Indicator Flashes Buy Signal for Nasdaq 100
by David Keller,
President and Chief Strategist, Sierra Alpha Research
In this edition of StockCharts TV'sThe Final Bar, Dave opens The Final Bar mailbag to answer viewer questions on the Nasdaq Bullish Percent Index, the value of long-term technical analysis techniques, how sentiment indicators relate to the market trend, and how the CMT program helped him improve his...
READ MORE