MEMBERS ONLY
Sector Spotlight: Sector Rotation After the Election
by Julius de Kempenaer,
Senior Technical Analyst, StockCharts.com
In this edition of Sector Spotlight, I look at asset class and sector rotation after last week's elections and try to digest the impact for various sectors. I analyze both the daily and weekly RRGs and find that, for some sectors, the different timeframes send contradicting messages. After...
READ MORE
MEMBERS ONLY
Sector Rotation Shows Money Flowing Out of Technology, Communications and Discretionary
by Julius de Kempenaer,
Senior Technical Analyst, StockCharts.com
The Relative Rotation Graph for US sectors shows an ongoing rotation out of the three strongest performers in 2020 so far.
Technology is inside the weakening quadrant, following a long rotation through leading, and has started to accelerate towards lagging. Consumer Discretionary is trailing slightly behind the rotation of XLK...
READ MORE
MEMBERS ONLY
Did We Already See "The Dip" or Is There Risk Ahead?
by Julius de Kempenaer,
Senior Technical Analyst, StockCharts.com
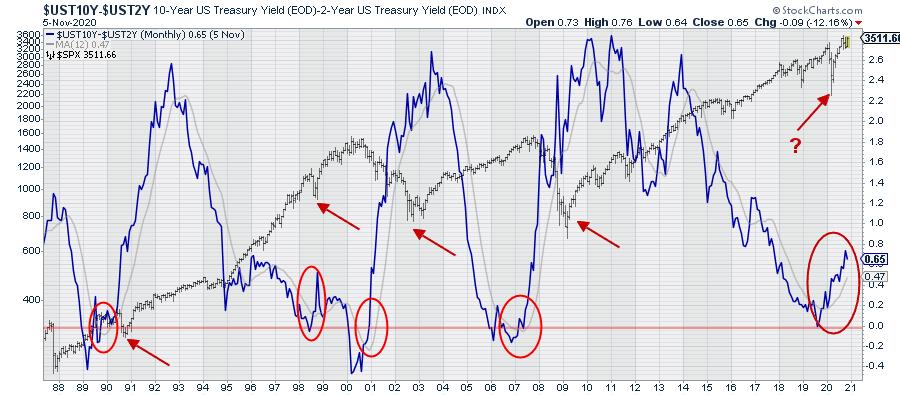
Every first Tuesday of the month in Sector Spotlight, I go over the completed monthly charts for the prior month.
Sometime mid-2019, when there was a lot of discussion on the yield curve being inverted, I started to include a long-term chart of the yield-curve in my monthly overviews. And,...
READ MORE
MEMBERS ONLY
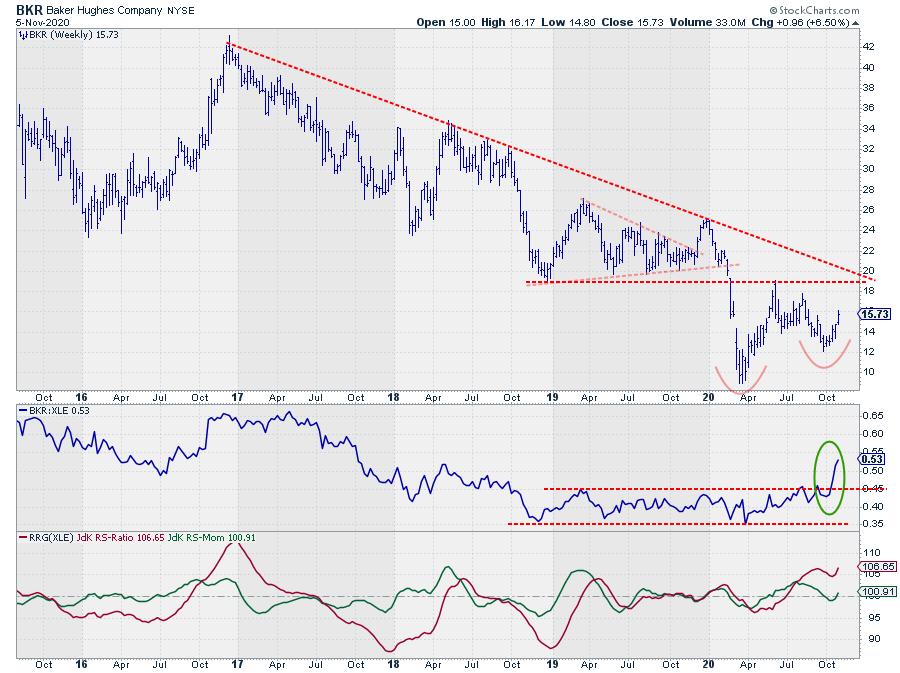
This Energy Stock Has Started to Improve!
by Julius de Kempenaer,
Senior Technical Analyst, StockCharts.com
Last Tuesday 11/3, Election Day, I joined Dave Keller on The Final Bar. Most likely because all potential US-based guests were busy doing something else ;)
Dave and I talked about the Stock/Bond rotation going into the elections and how that lined up with the 2016 elections. We also...
READ MORE
MEMBERS ONLY
Sector Spotlight: Yield Curve Steepening Accelerates
by Julius de Kempenaer,
Senior Technical Analyst, StockCharts.com
In this edition of Sector Spotlight, as it is the first Tuesday of the new month, I take a look at the monthly charts for asset classes and US sectors. Most of the (strong) monthly trends are still intact. The long-term chart of the 10-2 yield curve, in combination with...
READ MORE
MEMBERS ONLY
Monthly Charts, Bars or Lines?
by Julius de Kempenaer,
Senior Technical Analyst, StockCharts.com
On the first Tuesday of every month, I have a segment in Sector Spotlight in which I look at the completed monthly charts for the previous month. It forces me to sit down and look at the market from a longer-term perspective and make up my mind about trends that...
READ MORE
MEMBERS ONLY
Sector Spotlight: Asset Rotation on Same 2016 Track
by Julius de Kempenaer,
Senior Technical Analyst, StockCharts.com
In this edition of Sector Spotlight, I review asset and sector rotations of the last week, then move on to my monthly segment on seasonality and whether or not it matches with current rotations. Materials, Industrials, Energy and Real Estate seem on track for a performance in line with their...
READ MORE
MEMBERS ONLY
Seasonality is Pointing to Outperformance for Materials and Industrials in November
by Julius de Kempenaer,
Senior Technical Analyst, StockCharts.com
We are approaching the month of November, which, this year, also means election month. In last week's edition of the ChartWatchers Newsletter, I wrote an article. Presidential Rotation, on how the rotations for Stocks vs. Bonds are now looking similar to the rotation seen around the same time...
READ MORE
MEMBERS ONLY
Presidential Rotation
by Julius de Kempenaer,
Senior Technical Analyst, StockCharts.com
Those of you who follow my blogs and watch Sector Spotlight on StockCharts TV will know that I regularly look at rotations among various asset classes. I talked about that subject in last week's show, focusing on the relationship between stocks and bonds, and I wanted to highlight...
READ MORE
MEMBERS ONLY
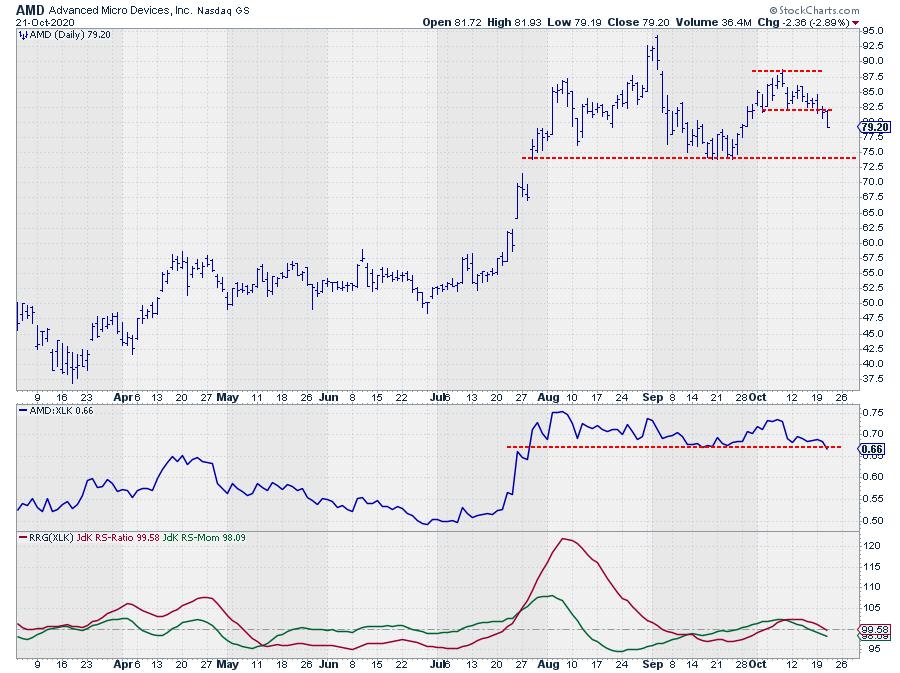
AMD is at Risk!
by Julius de Kempenaer,
Senior Technical Analyst, StockCharts.com
While going over some Relative Rotation Graphs showing the rotations for individual stocks, the tail for AMD in the Technology sector caught my attention.
AMD was one of the leading tech stocks from July to early September, almost doubling in price, but then started to fade in terms of relative...
READ MORE
MEMBERS ONLY
Sector Spotlight: Explosive Move in Stock/Bond Ratio Coming?
by Julius de Kempenaer,
Senior Technical Analyst, StockCharts.com
In this edition of Sector Spotlight, I look at last week's performance and rotations for asset classes and stock sectors. After the break, I move on to share my views on various levels of the investment pyramid, highlighting the possibility for an explosive move in the stock/bond...
READ MORE
MEMBERS ONLY
DISH is a New Short in the RRG L/S Basket
by Julius de Kempenaer,
Senior Technical Analyst, StockCharts.com
From time to time, I present Long/Short or Pair Trading ideas in my weekly Sector Spotlight show on StockCharts TV. During the past few months, I have started to track these ideas as a portfolio. This is by no means an advisory service or a model portfolio of any...
READ MORE
MEMBERS ONLY
Sector Spotlight: RRG L/S Basket Update
by Julius de Kempenaer,
Senior Technical Analyst, StockCharts.com
In this edition of Sector Spotlight, I cover rotational developments over the last two weeks for asset classes and sectors. After that, I take a look at the current positions in the Long/Short basket, which is up well over 10% since March.
This video was originally broadcast on October...
READ MORE
MEMBERS ONLY
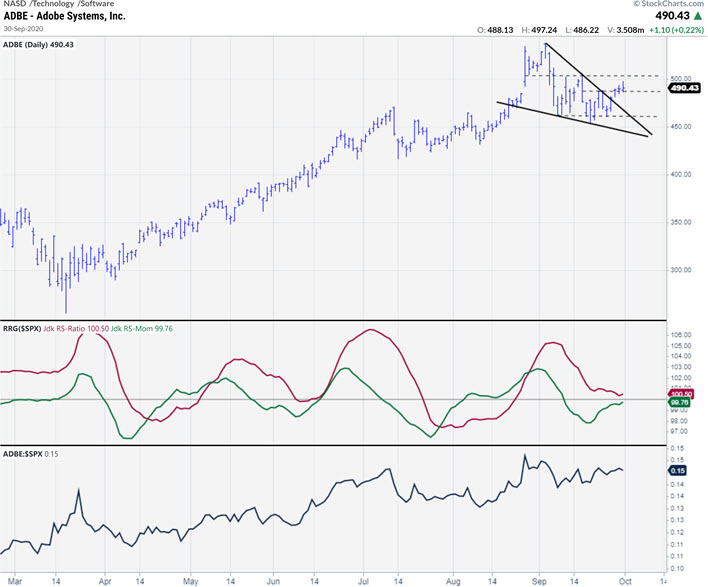
ADBE Setting Up For a New Rally
by Julius de Kempenaer,
Senior Technical Analyst, StockCharts.com
The chart above shows the daily price bars for ADBE, in combination with the RRG-Lines and raw Relative Strength.
There are two reasons to use this chart today. The first is to make sure all of you are aware of the rapid further development of the new ACP platform here...
READ MORE
MEMBERS ONLY
Sector Spotlight: Tech & Comm Rally Into October
by Julius de Kempenaer,
Senior Technical Analyst, StockCharts.com
In this edition of Sector Spotlight, with September drawing to an end, I dive into the monthly seasonality, finding some very interesting seasonal patterns for Technology and Communication Services on the one hand and Energy and Health Care on the other. History suggests a 2% out-performance for Technology in October,...
READ MORE
MEMBERS ONLY
Short Term Rotations Put XLC and XLK Back in Favor Again on Relative Rotation Graph
by Julius de Kempenaer,
Senior Technical Analyst, StockCharts.com
The erratic rotations that we discussed last week are still ongoing. Looking back at the rotational action on the RRG for US sectors last week shows that the focus of investors is shifting back to Technology and Communication Services again.
Despite being inside the lagging quadrant, XLK showed the strongest...
READ MORE
MEMBERS ONLY
What Does It Mean When Sectors Fly All Over the Place?
by Julius de Kempenaer,
Senior Technical Analyst, StockCharts.com
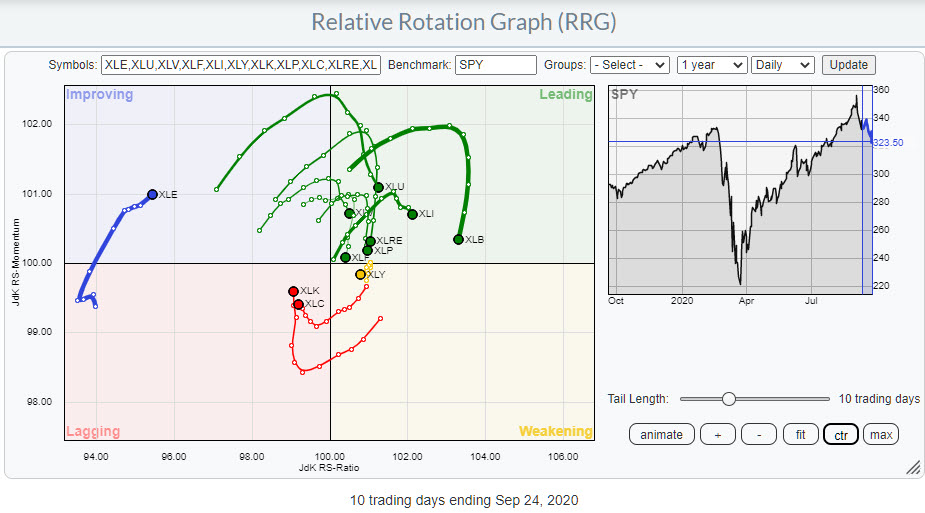
The Relative Rotation Graph above shows the rotation for US sectors on a daily basis over roughly the last two weeks.
The most important observation that we can make from this image is that the rotation currently is very erratic. The tails do not last very long in one quadrant...
READ MORE
MEMBERS ONLY
Breaking Down the Dow Jones Composite Index
by Julius de Kempenaer,
Senior Technical Analyst, StockCharts.com
The S&P 500 and the Nasdaq 100 are probably the most discussed charts/indexes. The Dow Jones Industrials is probably the most well known index. From an RRG point of view, the breakdown of the S&P 500 into its sectors is probably the most-watched RRG.
But,...
READ MORE
MEMBERS ONLY
Sector Spotlight: Erratic Rotation Signals Uncertainty
by Julius de Kempenaer,
Senior Technical Analyst, StockCharts.com
In this edition of Sector Spotlight, I spend the show talking about current market rotations. I begin with the overview of last week's rotations in asset classes and US sectors, then switch to weekly charts to step away from the erratic daily rotations; this way, I can get...
READ MORE
MEMBERS ONLY
Daily Rotations Look Erratic
by Julius de Kempenaer,
Senior Technical Analyst, StockCharts.com
The Relative Rotation Graph above shows the rotation for US sectors on a daily basis at the start of this new week (20.09.21).
The most important observation that we can make from this image is that the rotation currently is very erratic. The tails do not last very...
READ MORE
MEMBERS ONLY
Is the Technology Sector at Risk?
by Julius de Kempenaer,
Senior Technical Analyst, StockCharts.com
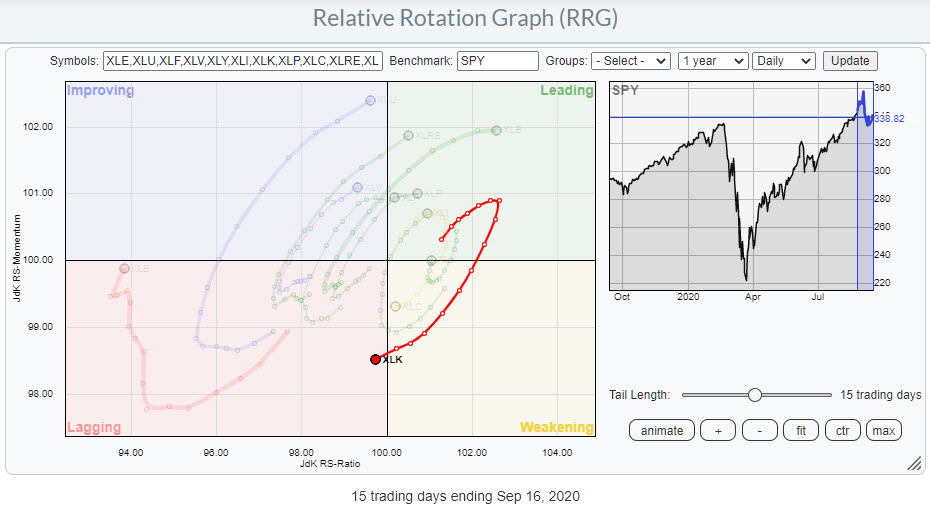
At yesterday's close XLK, the technology sector, rotated into the lagging quadrant. This happened a few times since the market started to rally out of the March low. On the daily chart to be exact.
On the weekly RRG, XLK remained far to the right inside the leading...
READ MORE
MEMBERS ONLY
Sector Spotlight: A Full Mailbag
by Julius de Kempenaer,
Senior Technical Analyst, StockCharts.com
In this edition of Sector Spotlight, I present the usual look at the rotations for Asset Classes and US Sectors via Relative Rotation Graphs. In addition, the better part of the show is spent on answering questions from the mailbag. These questions range from slowing down animations on RRGs to...
READ MORE
MEMBERS ONLY
XLC and XLK Continue to Lose Relative Strength, Which is Picked Up by the Rest of the Market
by Julius de Kempenaer,
Senior Technical Analyst, StockCharts.com
Last week, the rotations for the Communication Services and Technology sectors continued on their trajectory deeper into the weakening quadrant, heading towards lagging. As always with relative strength, one sector's loss is another sector's gain - or, in this case three sectors' losses are the...
READ MORE
MEMBERS ONLY
Are We Just Coming Out of a Full Recession?
by Julius de Kempenaer,
Senior Technical Analyst, StockCharts.com
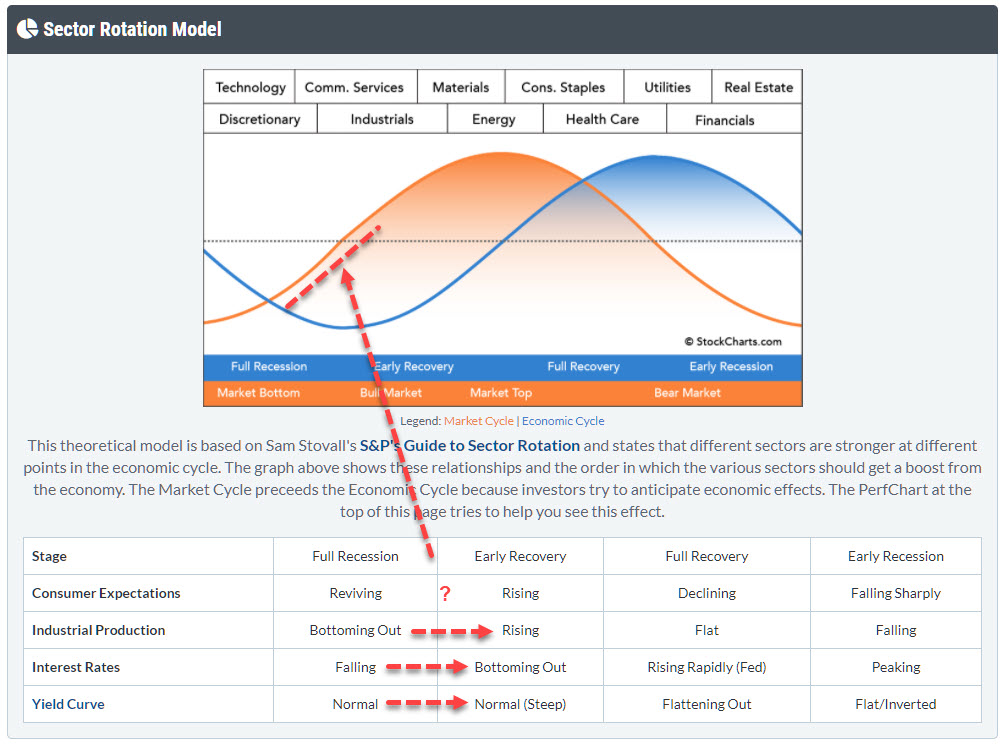
With markets flying everywhere from day to day, I want to take a step back in this article and look at the bigger economic cycle picture, in order to see if we can fit things into the "Sector Rotation Model" as it can bee seen under the PerfCharts....
READ MORE
MEMBERS ONLY
Where Is All That Money Going To?
by Julius de Kempenaer,
Senior Technical Analyst, StockCharts.com
Last week's selloff primarily hit some mega-cap names in Technology, Communication Services and Discretionary stocks. For sure, it shook up markets pretty well and, as usual, the selling of risk assets led to an inflow into risk-off assets like bonds and more defensive sectors.
Another ways of breaking...
READ MORE
MEMBERS ONLY
Sector Spotlight: Long/Short Basket Up 8%
by Julius de Kempenaer,
Senior Technical Analyst, StockCharts.com
In this edition of Sector Spotlight, I break down the events of last week's volatile price action and how that translates into the tails on the Relative Rotation Graphs; I then put these price moves into a slightly longer-term perspective. Julius also dives into the Long/Short baskets,...
READ MORE
MEMBERS ONLY
Seasonality Expects a Decline For SPY in September and an Underperformance for Technology
by Julius de Kempenaer,
Senior Technical Analyst, StockCharts.com
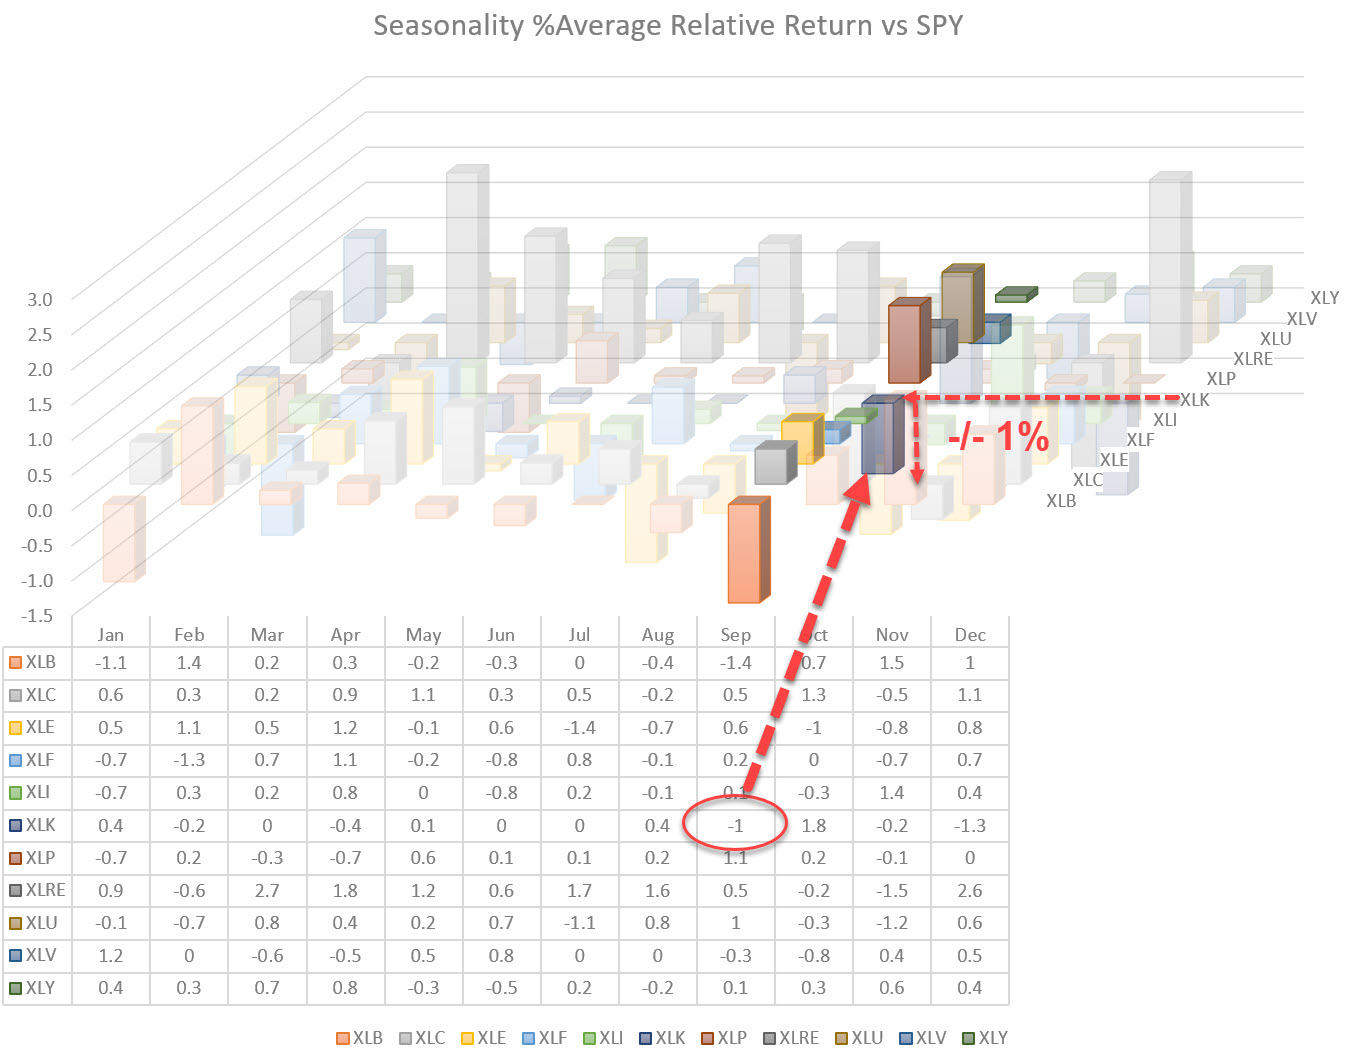
Last Tuesday in Sector Spotlight, as well as in my last article of the RRG blog, I discussed seasonality for US sectors. While going over the table showing the average returns per sector per month, my eye fell on another number... the minus-one percent (-1%) for the Technology sector. This...
READ MORE
MEMBERS ONLY
Sector Spotlight: Avoid Materials in September
by Julius de Kempenaer,
Senior Technical Analyst, StockCharts.com
In this edition of Sector Spotlight, I look at last week's rotations using daily Relative Rotation Graphs and go over the completed monthly charts for August to catch up on the long-term trends. After the break, I analyze the seasonality for US sectors and look for alignment of...
READ MORE
MEMBERS ONLY
September Seasonality Points to Sector Rotation from Materials into Communication Services
by Julius de Kempenaer,
Senior Technical Analyst, StockCharts.com
The graph above shows the percentage of months in which sectors have outperformed the S&P 500 in the past. For most sectors, the data go back 20 years, with the exceptions of XLC and XLRE, as these sectors were only introduced more recently and the historical data does...
READ MORE
MEMBERS ONLY
Swap From XLK to RYT to Mitigate The Increasing Risk For AAPL
by Julius de Kempenaer,
Senior Technical Analyst, StockCharts.com
Last week, I wrote an article titled "What Can We Learn From Equal Weight vs. Cap Weighted Rotations on RRG". In that article, I touched upon distortions between EW and CW sector ETFs because of the large and increasing weight of a few Mega-Cap stocks.
In this week&...
READ MORE
MEMBERS ONLY
NKE Starts Running!
by Julius de Kempenaer,
Senior Technical Analyst, StockCharts.com
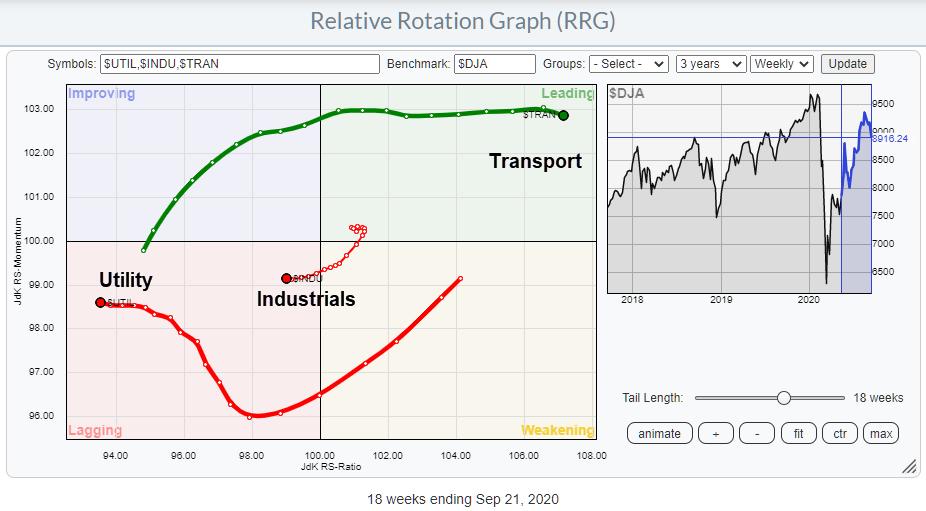
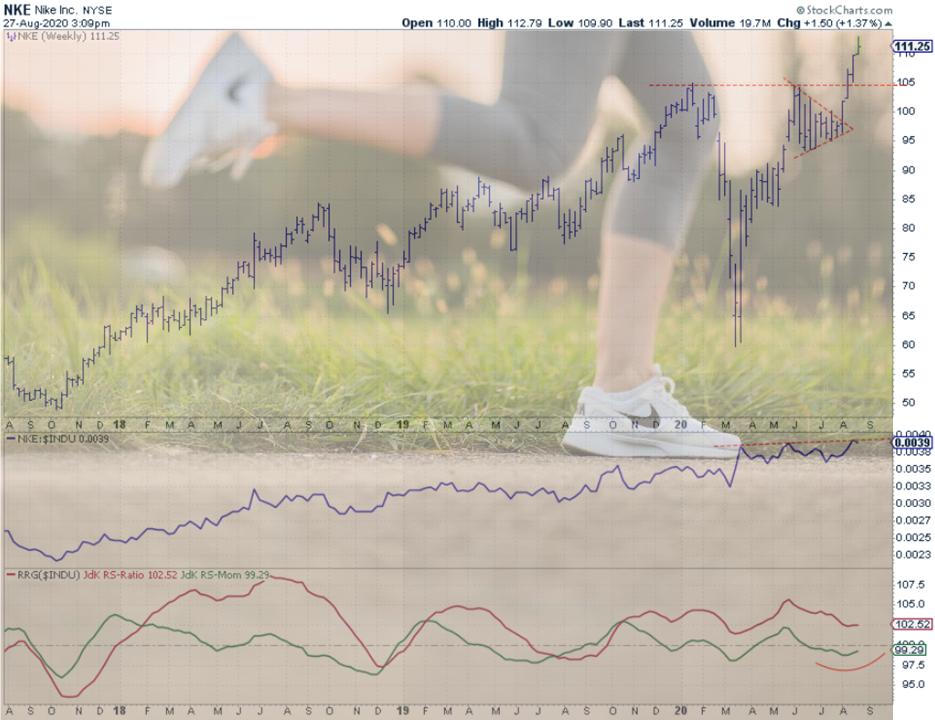
On the weekly Relative Rotation Graph for the DJ Industrials universe, NKE is inside the weakening quadrant following a completed rotation on the right side of the graph (Leading-Weakening-Leading). And over the last few weeks, the tail on NKE has again started to curl back up. These sort of rotations...
READ MORE
MEMBERS ONLY
Sector Spotlight: Putting Industries Inside Technology
by Julius de Kempenaer,
Senior Technical Analyst, StockCharts.com
In this edition of Sector Spotlight, I work my way through the investment pyramid in a top-down fashion using RRGs. After the break, I analyze an RRG that holds the industry indexes that make up the technology sector to get a more granular handle on the rotations of various groups...
READ MORE
MEMBERS ONLY
What Can We Learn From Equal Weight vs. Cap Weighted Rotations on RRG?
by Julius de Kempenaer,
Senior Technical Analyst, StockCharts.com
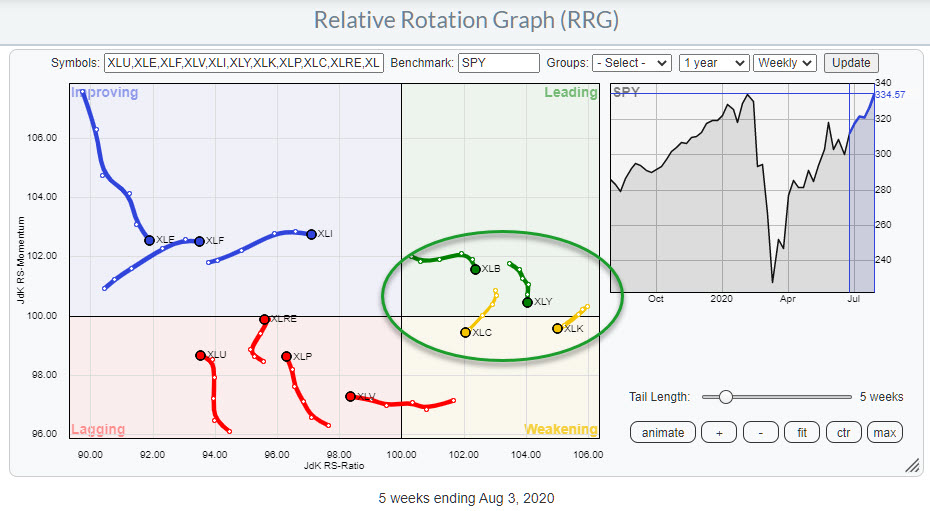
By far the most-watched Relative Rotation Graph is the one that shows the rotation for the 11 S&P sectors, and for good reason; it shows very clearly where the strengths and weaknesses in the various areas of the market are.
But we have to realize that some of...
READ MORE
MEMBERS ONLY
Trains Trump Planes!
by Julius de Kempenaer,
Senior Technical Analyst, StockCharts.com
Last Tuesday in Sector Spotlight, I covered the Industrials sector. While looking into the constituents of the sector and the group breakdown, it was pretty clear that the group "airlines" is not doing very well.
UAL, DAL and LUV are all inside the improving quadrant, but they also...
READ MORE
MEMBERS ONLY
Sector Spotlight: Opportunities in the Industrials Sector
by Julius de Kempenaer,
Senior Technical Analyst, StockCharts.com
In this edition of Sector Spotlight, I put last week's rotations for asset classes and sectors into a longer-term perspective. After the break, I perform a deep dive into the industrials sector, showing some stocks with potential but also a group that, as a whole, is better off...
READ MORE
MEMBERS ONLY
Not All Tech Stocks Look Good... But the Most Important Ones Still Do!
by Julius de Kempenaer,
Senior Technical Analyst, StockCharts.com
The technology sector sparks a lot of interest, and for good reason - it has turned into a safe(r) haven when things get rough in the markets, but it's also everybody's baby when the market goes up. "What could possibly go wrong?", one...
READ MORE
MEMBERS ONLY
Break to New Highs in $SPX is Crucial for Leadership vs. Rest of the World
by Julius de Kempenaer,
Senior Technical Analyst, StockCharts.com
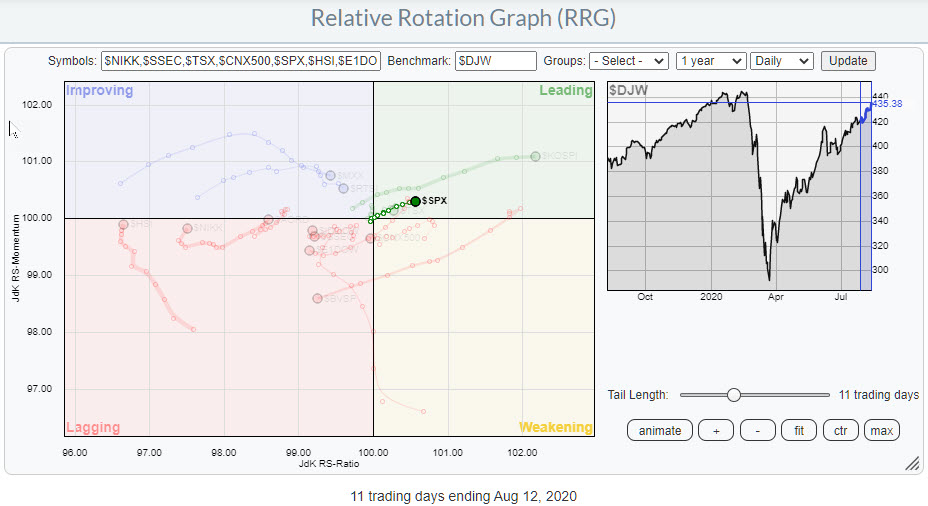
Towards the end of May, the US stock market ($SPX) started to lose relative strength vs. other major world market stock indexes.
Around that time the $SPX tail vs. $DJW, the Dow Jones Global Index, rolled over inside the leading quadrant and started to rotate into and through weakening. This...
READ MORE
MEMBERS ONLY
Sector Spotlight: Four Interesting Sector Rotations
by Julius de Kempenaer,
Senior Technical Analyst, StockCharts.com
In this edition of Sector Spotlight, I look at the rotations for Asset Classes and US sectors, zooming in on the combination of weekly and daily rotations for Consumer Discretionary, Materials, Communication Services and Technology. After the break, I touch on the current positions in the long short baskets and...
READ MORE
MEMBERS ONLY
Sector Rotation From Materials and Discretionary to Tech and Communication
by Julius de Kempenaer,
Senior Technical Analyst, StockCharts.com
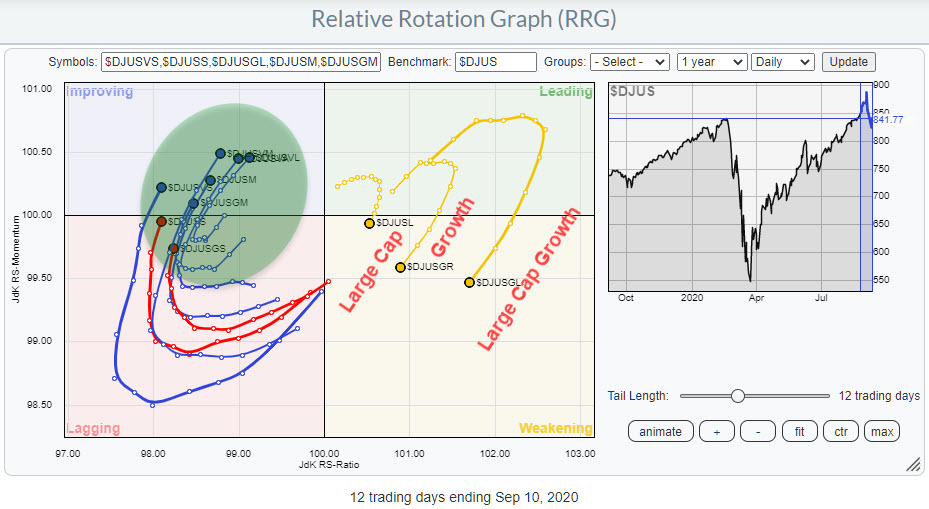
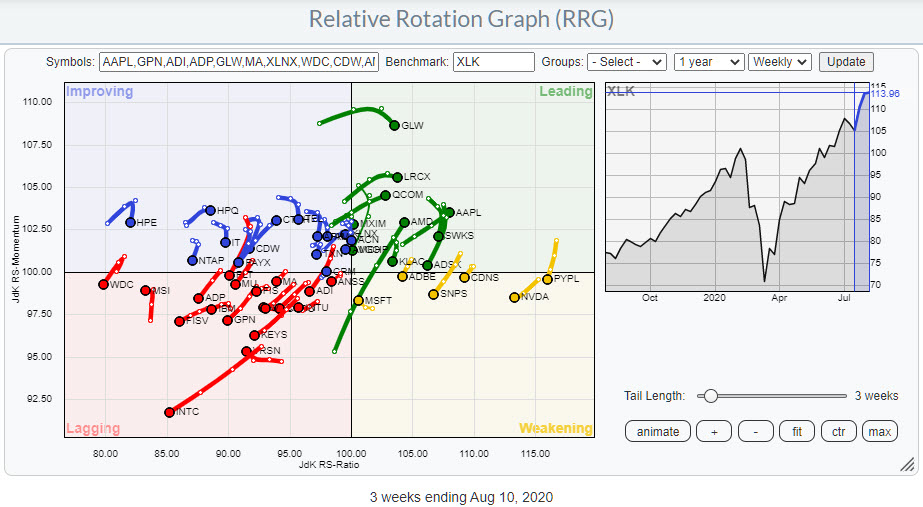
The weekly Relative Rotation Graph for US sectors shows four sectors at the right-hand side of the plot, JdK RS-Ratio > 100 and all seven other sectors at the left-hand side. This indicates that, from a relative strength perspective, the market is driven by only four sectors. But those four...
READ MORE
MEMBERS ONLY
Break from "Pennant" Targets $500 for AAPL
by Julius de Kempenaer,
Senior Technical Analyst, StockCharts.com
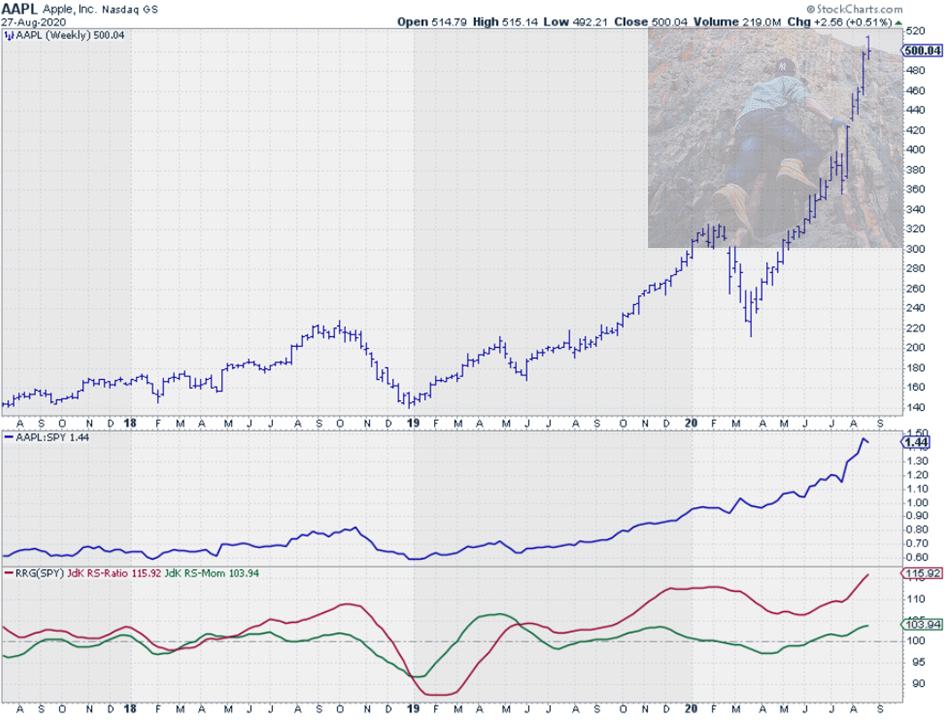
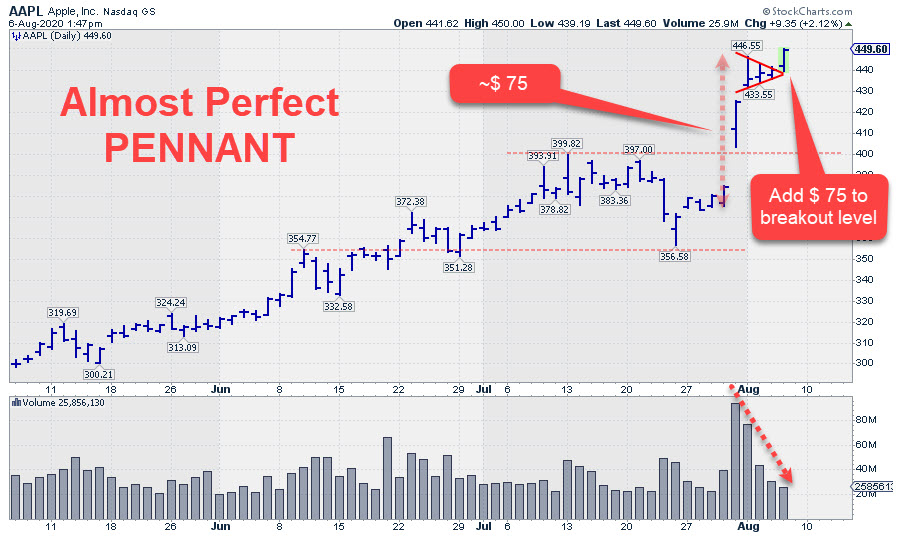
To get some inspiration for a nice subject or stock to show in this article, I went to my dashboard, on which I have one widget that shows the most actively traded stocks in the Dow Jones Industrials index.
A nice little gimmick is that you can run an RRG...
READ MORE