MEMBERS ONLY
It’s All Systems Go for Commodities
by Martin Pring,
President, Pring Research
Commodity prices are rising and have the potential for further upside movement. Martin Pring analyzes the CRB Index from different perspectives. Find out what his charts show....
READ MORE
MEMBERS ONLY
It’s That Time in the Cycle for Materials; Do the Technicals Agree?
by Martin Pring,
President, Pring Research
Are we in the late stage of a business cycle that benefits mining, energy, and basic industry sectors? Martin Pring analyzes the technicals of the sectors to identify where we are in the cycle....
READ MORE
MEMBERS ONLY
Is the US Market Losing its Edge Relative to Global Equities?
by Martin Pring,
President, Pring Research
Are the U.S. markets showing signs of running out of steam? Martin Pring analyzes the relative strength of U.S. indexes with respect to non-U.S. indexes. Another group that could gain momentum is small-caps. Here's what you should be watching. ...
READ MORE
MEMBERS ONLY
Unveiling the Factors Behind a Potential Energy Surge
by Martin Pring,
President, Pring Research
Although the Energy sector has been a laggard in the past 200 days, these charts suggest this sector may be about to reverse course. Here's a unique perspective....
READ MORE
MEMBERS ONLY
Bitcoin is at a 2026 Crossroad
by Martin Pring,
President, Pring Research
Bitcoin has recently sold off sharply. Was 2025 the top, or will prices continue to rise higher in 2026? Martin Pring analyzes Bitcoin from various angles and shares his perspective....
READ MORE
MEMBERS ONLY
Watch This Chart — “Affordability” May Be About to Get Less Affordable
by Martin Pring,
President, Pring Research
Gold's historic leadership may be shifting. A critical Gold/CRB signal suggests a potential commodity bull market and rising affordability risks ahead. ...
READ MORE
MEMBERS ONLY
Two Markets That Could Be Influenced by a Peace Settlement in Ukraine
by Martin Pring,
President, Pring Research
Martin Pring analyzes the two areas that could see a significant upside move if a peace settlement in the conflict in Ukraine is reached....
READ MORE
MEMBERS ONLY
Is It Finally Time for Small Caps to Outperform?
by Martin Pring,
President, Pring Research
Small caps have made very little upside movement since 2021, but that could be changing. Martin Pring analyzes small-cap stocks and makes his case for a potential rally in this asset group....
READ MORE
MEMBERS ONLY
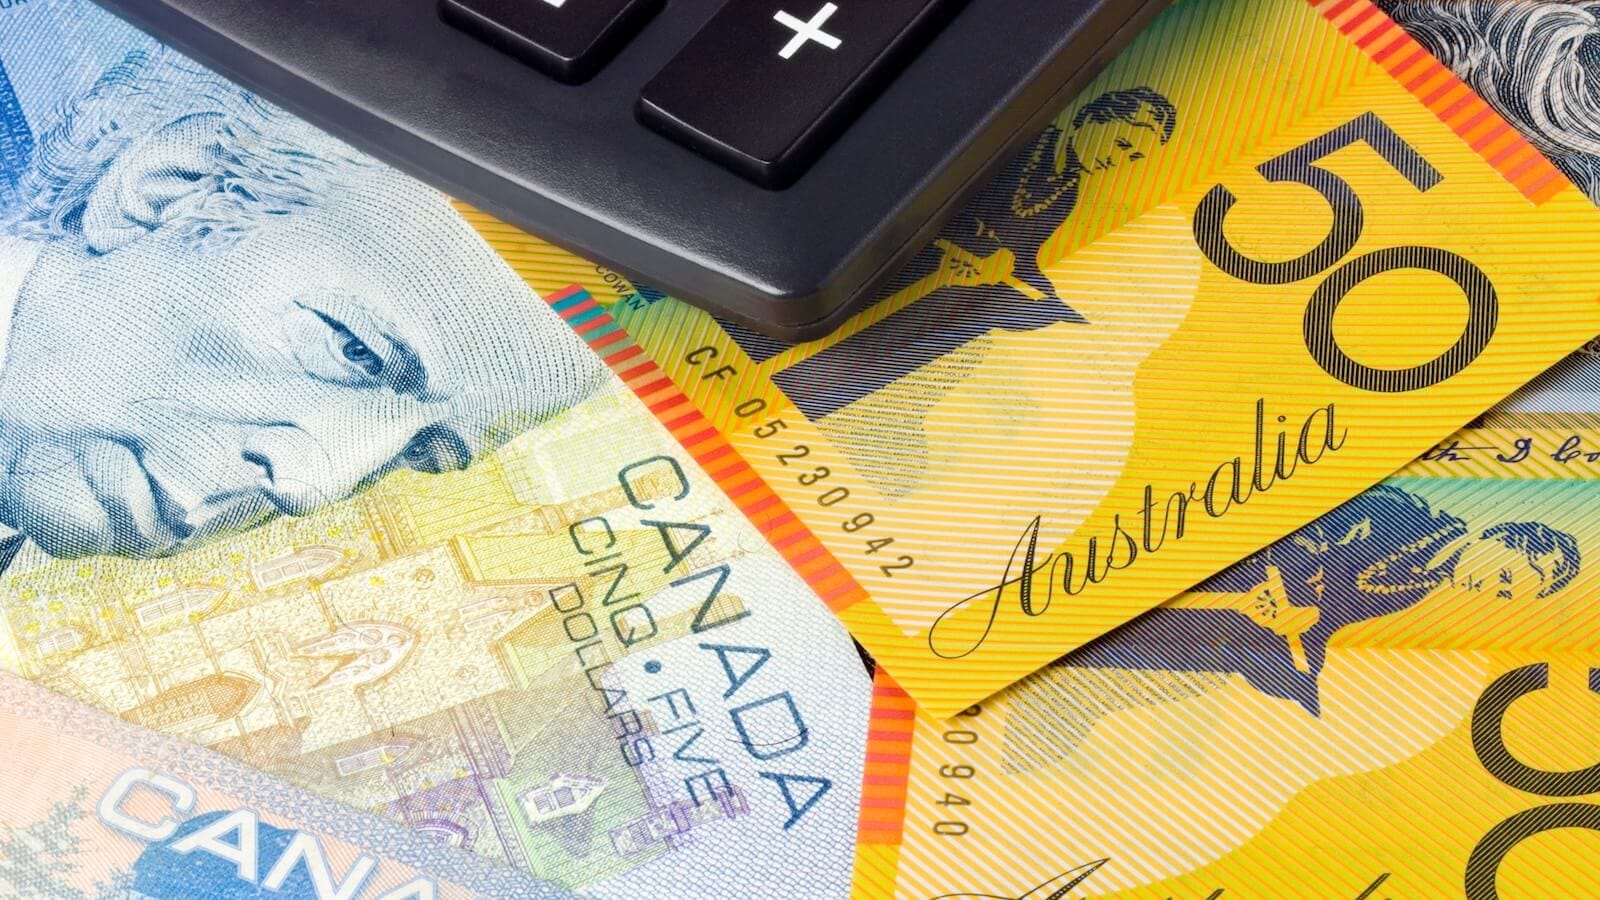
Two Currencies May Be About to Go Bullish for Commodities
by Martin Pring,
President, Pring Research
The Australian dollar and Canadian dollar may be getting ready to strengthen against the US dollar. Martin Pring analyzes these two commodity-based currencies and discusses which direction the two are likely to move....
READ MORE
MEMBERS ONLY
Will Santa Keep on Giving? Or Will the Grinch Finally Come to Wall Street?
by Martin Pring,
President, Pring Research
The S&P and NYSE Composites have reached resistance. Can the push through, or will they back off?...
READ MORE
MEMBERS ONLY
The US Dollar Index Hits a Critical Crossroad: Will It Reverse or Rally?
by Martin Pring,
President, Pring Research
The US Dollar Index has reached a key resistance level. Will it break through it and rally higher? Martin Pring provides his expert insight into the dollar's potential to rally....
READ MORE
MEMBERS ONLY
Bitcoin Takes One More Step to Signal a Primary Bear Market
by Martin Pring,
President, Pring Research
Martin Pring analyzes Bitcoin using charts of different time frames, highlighting key support levels and divergences. Keep an eye on these charts....
READ MORE
MEMBERS ONLY
Fed Chair Says, “It’s Cloudy”; These Benchmarks Could Blow the Clouds Away
by Martin Pring,
President, Pring Research
Martin Pring analyzes charts of US Treasury yields, which suggest there may be some disagreement between the market and the Fed....
READ MORE
MEMBERS ONLY
A Deep Dive into the Health Care Sector
by Martin Pring,
President, Pring Research
Martin Pring analyzes the Health Care sector, which is breaking out of a key resistance level. On a relative basis, the sector's performance may not be stellar....
READ MORE
MEMBERS ONLY
Confidence Ratios are Breaking Out in One Direction
by Martin Pring,
President, Pring Research
Martin Pring analyzes the relationship between sectors and various asset classes to confirm trend continuations....
READ MORE
MEMBERS ONLY
Wednesday May Have Been Turnaround Day for Some Markets
by Martin Pring,
President, Pring Research
Following the Fed's rate cut, the price action in several markets indicated a short-term reversal. Martin suggests monitoring these charts and their technical signals in the coming weeks....
READ MORE
MEMBERS ONLY
These Asset Relationships Could Be About to Signal Some Important Changes Ahead
by Martin Pring,
President, Pring Research
Martin explains how analyzing inter-asset relationships can give important insights into the market -- and what those relationships are telling us right now....
READ MORE
MEMBERS ONLY
The CPI is Coming Out Wednesday: Here is Something to Be Aware of
by Martin Pring,
President, Pring Research
As August CPI data looms, Martin looks at the chart and analyzes whether an upside reversal could be in the cards....
READ MORE
MEMBERS ONLY
The World is Breaking Out All Over
by Martin Pring,
President, Pring Research
A plethora of breakouts suggests that international markets have much further to run on the upside. Martin reviews where the principal regions of the world currently stand....
READ MORE
MEMBERS ONLY
Is It Time to Think Small in a Big Way?
by Martin Pring,
President, Pring Research
The NYSE/S&P ratio has been in a downtrend for seventeen years, but is a reversal finally underway? What does the picture look like for small-caps going forward?...
READ MORE
MEMBERS ONLY
Bitcoin Fails at a New All-Time High; What’s Next?
by Martin Pring,
President, Pring Research
Earlier this summer, I pointed out that Bitcoin had experienced a bearish shooting star on the day it experienced a new all-time high, and noted that this probably foreshadowed some short-term weakness. I pointed out that no damage whatsoever had been done to the basic uptrend, as the consensus of...
READ MORE
MEMBERS ONLY
Can Gold Defy Gravity and Break to the Upside?
by Martin Pring,
President, Pring Research
Why does gold look ready to "defy gravity"? Martin Pring explains the technical signs....
READ MORE
MEMBERS ONLY
Last Week’s Market Action Showed Signs of Exhaustion, Especially In This One Key Stock
by Martin Pring,
President, Pring Research
Explore how recent bearish weekly patterns in the S&P 500, Nasdaq, and Microsoft could signal an intermediate-term trend reversal. Learn why confirmation is key in technical analysis....
READ MORE
MEMBERS ONLY
Is It Time to Take Another Look at China?
by Martin Pring,
President, Pring Research
Here's an analysis of the recent bullish developments in the Shanghai Stock Exchange Composite Index and liquid Chinese ETFs. ...
READ MORE
MEMBERS ONLY
Emerging Markets May Be on the Cusp of a Major Breakout
by Martin Pring,
President, Pring Research
Emerging markets, in the form of the iShares MSCI Emerging Markets ETF (EEM), have been underperforming the DJ World Index since 2010 -- but that may be about to change.
After all, Chart 1 shows that the RS line has crossed above a three-year down trendline and experienced a long-term...
READ MORE
MEMBERS ONLY
This Market Sector is Starting to Emerge as a Leader; Can it Complete the Job?
by Martin Pring,
President, Pring Research
Many years ago, I developed a couple of indexes that were designed to give me a sense of whether industry groups benefiting from inflationary conditions were outperforming those who performed better under deflationary ones. It was my way of recognizing the fact that, in a broad sense, the business cycle...
READ MORE
MEMBERS ONLY
Bitcoin Breaks to an All-Time High; Should We Uncork the Champagne?
by Martin Pring,
President, Pring Research
Bitcoin broke out to a new all-time high last week, so it seemed to me that it would be a good time to come out with a bullish article. After all, Chart 1 shows that a solid breakout came from a one-year reverse head-and-shoulders pattern, which was also accompanied by...
READ MORE
MEMBERS ONLY
The Battle Between Fed Chairman and the President Will Ultimately Be Won by the Market!
by Martin Pring,
President, Pring Research
The President and the Fed Chair have been in a battle over lower rates for some time. One has been pressuring for easy money to boost the economy, the other prefers to hold off for a while to see what effects the tariffs and other factors might have on inflation....
READ MORE
MEMBERS ONLY
The Dollar Index Just Gave a Major Sell Signal - Does That Mean It's About to Implode?
by Martin Pring,
President, Pring Research
Last month, the Dollar Index triggered a number of sell signals confirming that it is in a bear market. Chart 1, for instance, shows that the red up trendline emanating in 2011 has been decisively ruptured, thereby pushing the Index further below its moving average. The Coppock Curve, seen in...
READ MORE
MEMBERS ONLY
Never Easy to Predict, the Price of Crude Just Got Harder
by Martin Pring,
President, Pring Research
Earlier in the month, I wrote an article pointing out that gold and copper typically move ahead of oil. It's true, the leads and lags between these three entities differ from cycle to cycle. However, since gold momentum turned up in early 2023 and copper in early 2022,...
READ MORE
MEMBERS ONLY
G7 Meeting in Canada Could Be Opportune Time for Accumulating Canadian Dollar and Canadian Equities
by Martin Pring,
President, Pring Research
The Canadian dollar peaked in 2007 and 2011 at around $1.05, and it has been zig-zagging downwards ever since. Now at a lowly 73 cents USD, the currency looks as if it may be in the process of bottoming, or at the very least entering a multi-year trading range....
READ MORE
MEMBERS ONLY
This Widely Used Commodity Could Be About to Surprise Us on the Upside
by Martin Pring,
President, Pring Research
Chart 1 lays out the long-term momentum (KST) relationship between gold, copper, and crude oil for the last 30 years. The arrows slant towards the right, indicating that gold leads copper, which subsequently turns up ahead of oil. Gold reversed to the upside in early 2023 and copper at the...
READ MORE
MEMBERS ONLY
This Important Metal Could Be on the Verge of a Mega-Breakout
by Martin Pring,
President, Pring Research
Gold has been on a tear since 2022, leaving other metals in the dust. Nevertheless, it's important to remember that the yellow metal has a strong tendency to lead commodities in general, which implies the likelihood of inflationary pressures in the commodity pits going forward. The leads and...
READ MORE
MEMBERS ONLY
Five Charts I Am Watching Closely
by Martin Pring,
President, Pring Research
Each week, I monitor numerous charts to see if they have the potential for an important breakout. I tend to look at longer-term ones, because they set the scene as to whether the primary trend is bullish or bearish. That's important information to have, as the magnitude and...
READ MORE