MEMBERS ONLY
How to Ride Out the Bear Market

by David Keller,
President and Chief Strategist, Sierra Alpha Research

by Julius de Kempenaer,
Senior Technical Analyst, StockCharts.com
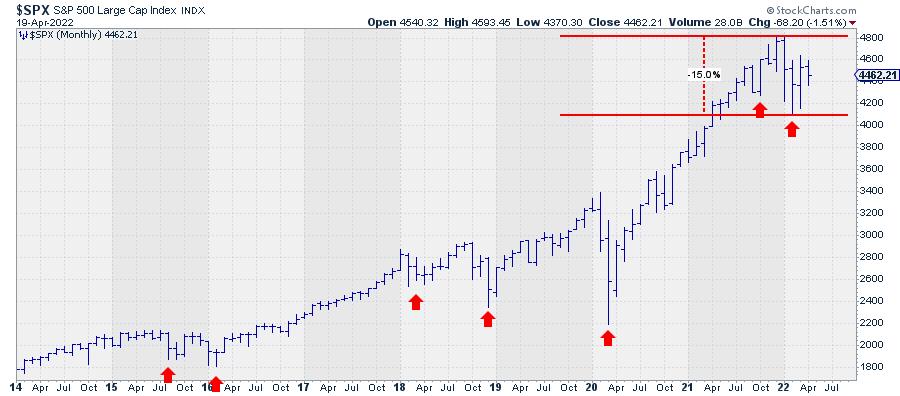
How can we ride out this bear market? Before we can answer that question, we first have to define what qualifies as a bear market. Very often, a decline of 20% or more from the most recent high is used as a yardstick to define a bear market. That seems...
READ MORE
MEMBERS ONLY

GNG TV: Equities Struggle, Defensive Sectors Continue to Lead

by Alex Cole,
Co-founder, GoNoGo Charts®

by Tyler Wood,
Co-founder, GoNoGo Charts®
On this week's edition of the GoNoGo Charts show, with Equities recovering this week, Alex and Tyler look at what they would like to see happen from a momentum perspective to have faith in the "Go" trend. Even with the "Go" in place, it...
READ MORE
MEMBERS ONLY

HAWKISH FED PUSHES STOCKS SHARPLY LOWER -- MAJOR INDEXES SUFFER DOWNSIDE REVERSAL DAY -- 200 DAY AVERAGES PROVIDE RESISTANCE

by John Murphy,
Chief Technical Analyst, StockCharts.com
50-BASIS POINT HIKE ON THE TABLE FOR FED MAY MEETING... Today's statement by Fed Chairman Jerome Powell that a 50-basis point rate hike was on the table for May, combined with other hawkish comments, pushed stocks sharply lower today. And their technical condition continues to weaken. Particularly disturbing...
READ MORE
MEMBERS ONLY

Support and Resistance: Look for Pools of Money

by Joe Rabil,
President, Rabil Stock Research
In this week's edition of Stock Talk with Joe Rabil, Joe gives a lesson on Support and Resistance. He explains the "Pools of Money" concept and how it can be useful in determining the best entry points as well as risk levels. He also discusses how...
READ MORE
MEMBERS ONLY
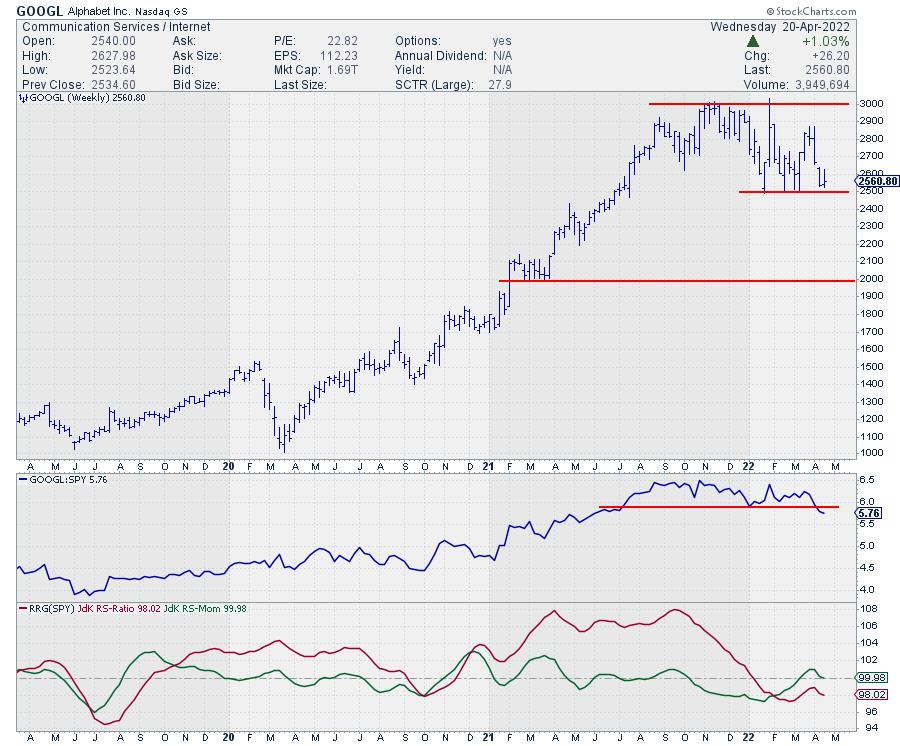
GOOGL On Track for $2000 Once This Support Level Breaks
by Julius de Kempenaer,
Senior Technical Analyst, StockCharts.com
When I brought up the Relative Rotation Graph showing the NYFANG components against $SPX, I made a few interesting observations.
In general, the rotation of almost all tails looks horrible. They are either already inside the lagging quadrant (and) at a negative RRG-Heading, or rotating back to lagging. The two...
READ MORE
MEMBERS ONLY
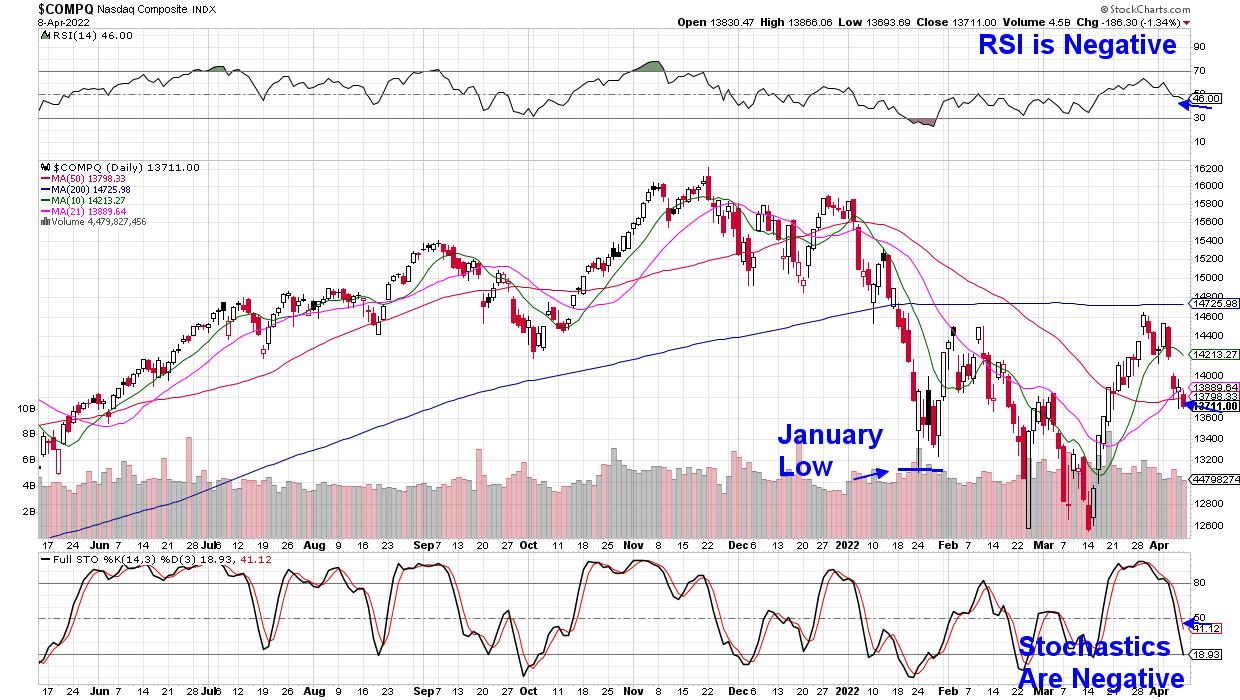
Does the Nasdaq 100 Index Have a Chokehold on the Stock Market?
On Wednesday, the stock market stuck with its choppy trend.
After Tuesday's rally into resistance, we watched for either a reversal to the downside or a potential break to the upside as momentum had grown since last week. However, the market tends to play out differently than expected,...
READ MORE
MEMBERS ONLY

How I Make My Money Trading

by Dave Landry,
Founder, Sentive Trading, LLC
On this week's edition of Trading Simplified, Dave discusses exactly how he makes money trading, using his Mystery Charts as an example. Follow along as he shares his spreadsheets, charts and thoughts explaining his methodology.
This video was originally broadcast on April 20, 2022. Click anywhere on the...
READ MORE
MEMBERS ONLY
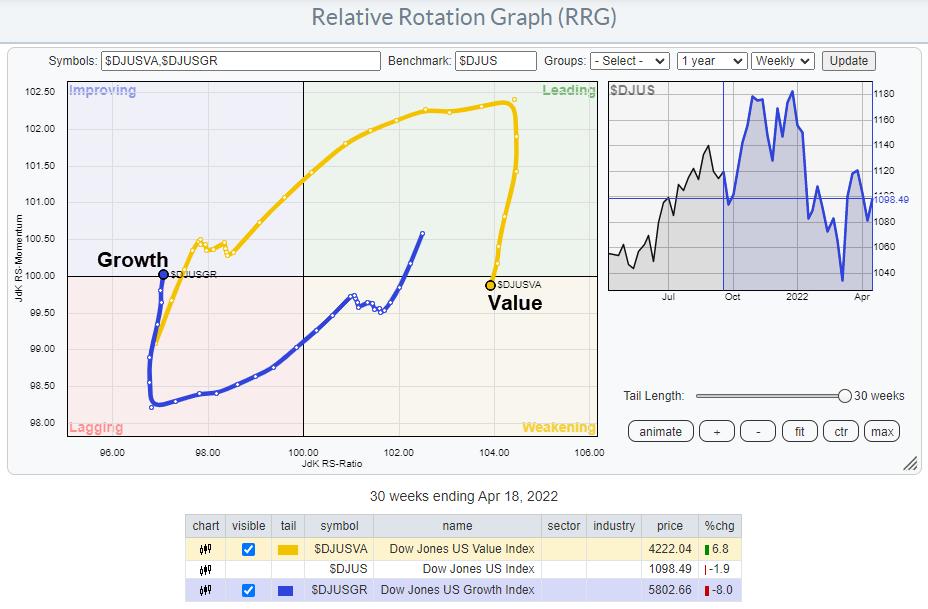
After a Short Break, Value is Ready to Pick Up Again
by Julius de Kempenaer,
Senior Technical Analyst, StockCharts.com
In this week's episode of Sector Spotlight, I had planned to also do a review of the current growth/value rotation. Due to bad timing on my side, or talking too long on the breakdown of sectors into cyclical, defensive and sensitive in large-cap, equal-weight and small-cap universes,...
READ MORE
MEMBERS ONLY
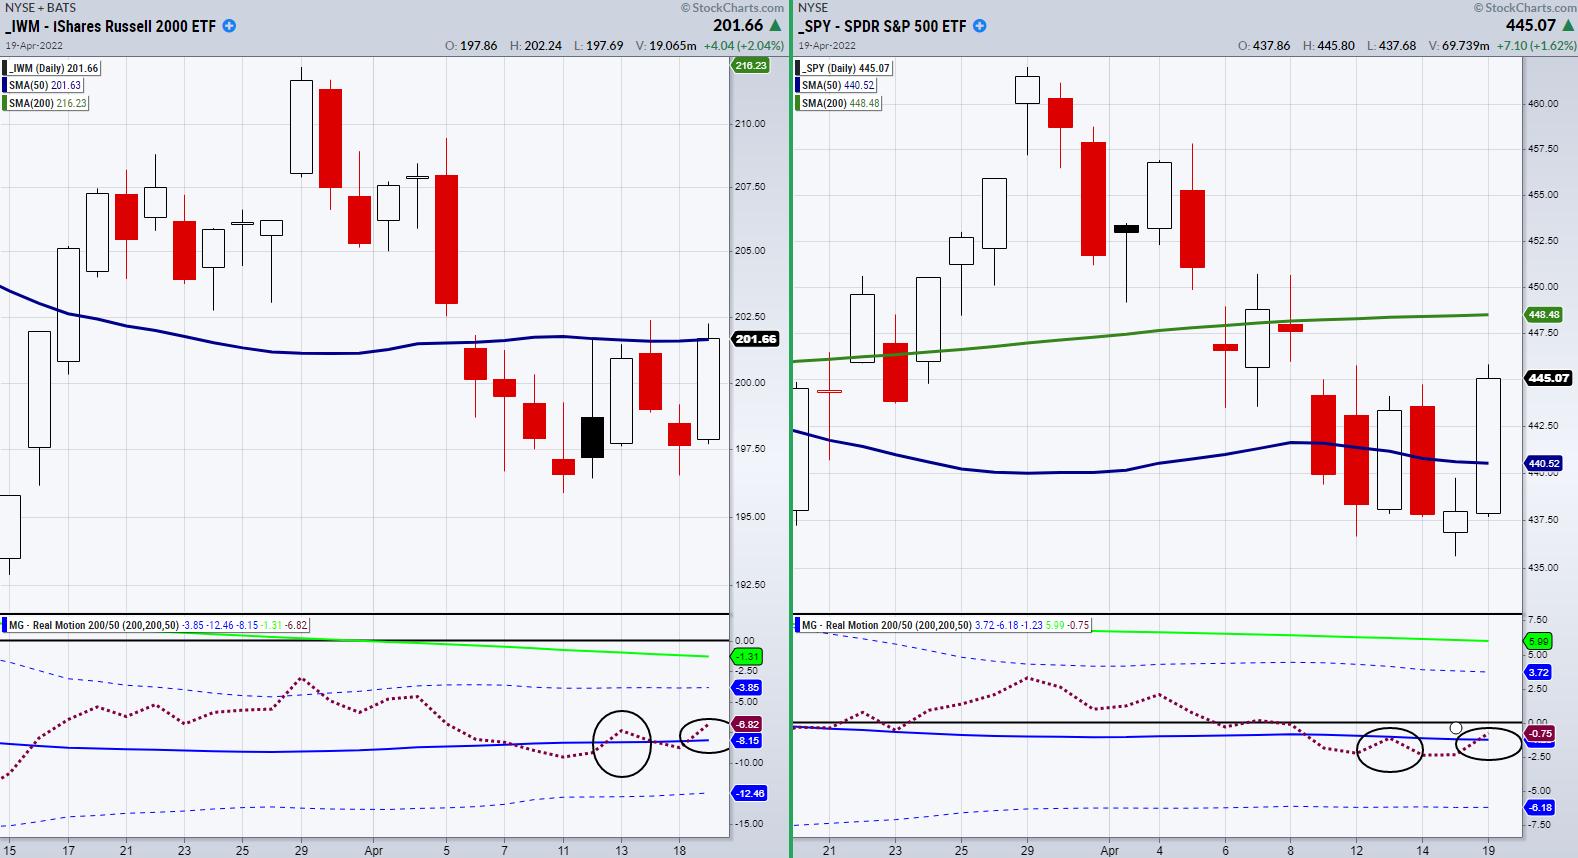
Real Motion Shows Hidden Momentum in the Russell 2000 and S&P 500
On Tuesday, the stock market rallied right into resistance from its major moving average; however, this time could be different. While the market is choppy and traders should be extra careful, if Wednesday shows follow-through in both price and momentum, we can watch for Tuesday's rally to continue....
READ MORE
MEMBERS ONLY

Does Recent Stock Market Action Indicate a Recession?

by Martin Pring,
President, Pring Research
I've been reading and hearing a lot about an impending recession, which reminds me of the saying that, when everyone thinks alike, everyone is usually wrong. That's not to say everyone is expecting a recession, but we may have reached a point where there is sufficient...
READ MORE
MEMBERS ONLY

Sector Spotlight: Defense, Defense, Defense!
by Julius de Kempenaer,
Senior Technical Analyst, StockCharts.com
In this edition of StockCharts TV's Sector Spotlight, I briefly look at the current rotations in asset classes, then dive into sectors. After a look at what happened last week, I break down the sector universes into cyclical/offensive, defensive and sensitive, then compare the rotations between large-cap,...
READ MORE
MEMBERS ONLY

DP TV: Carl's Take on Interest Rate Inversions

by Erin Swenlin,
Vice President, DecisionPoint.com

by Carl Swenlin,
President and Founder, DecisionPoint.com
On this episode of DecisionPoint, Carl starts off the program with his famous "Grab Bag" addition. He reveals his thoughts on the current yield inversions. Is he worried? Carl reviews the exclusive DecisionPoint indicator sets and his thoughts on Bitcoin, Oil, Bonds, Dollar and Gold. Erin then gives...
READ MORE
MEMBERS ONLY

Why We are Watching Wells Fargo (WFC) and National Bank Holdings (NBHC)
Earnings season is upon us and the banks have been kicking it off. However, the kickoff has been weak, as seen in the above chart of the regional banking ETF (KRE).
With that said, if KRE can clear and hold over its 10-day moving average on both price and our...
READ MORE
MEMBERS ONLY
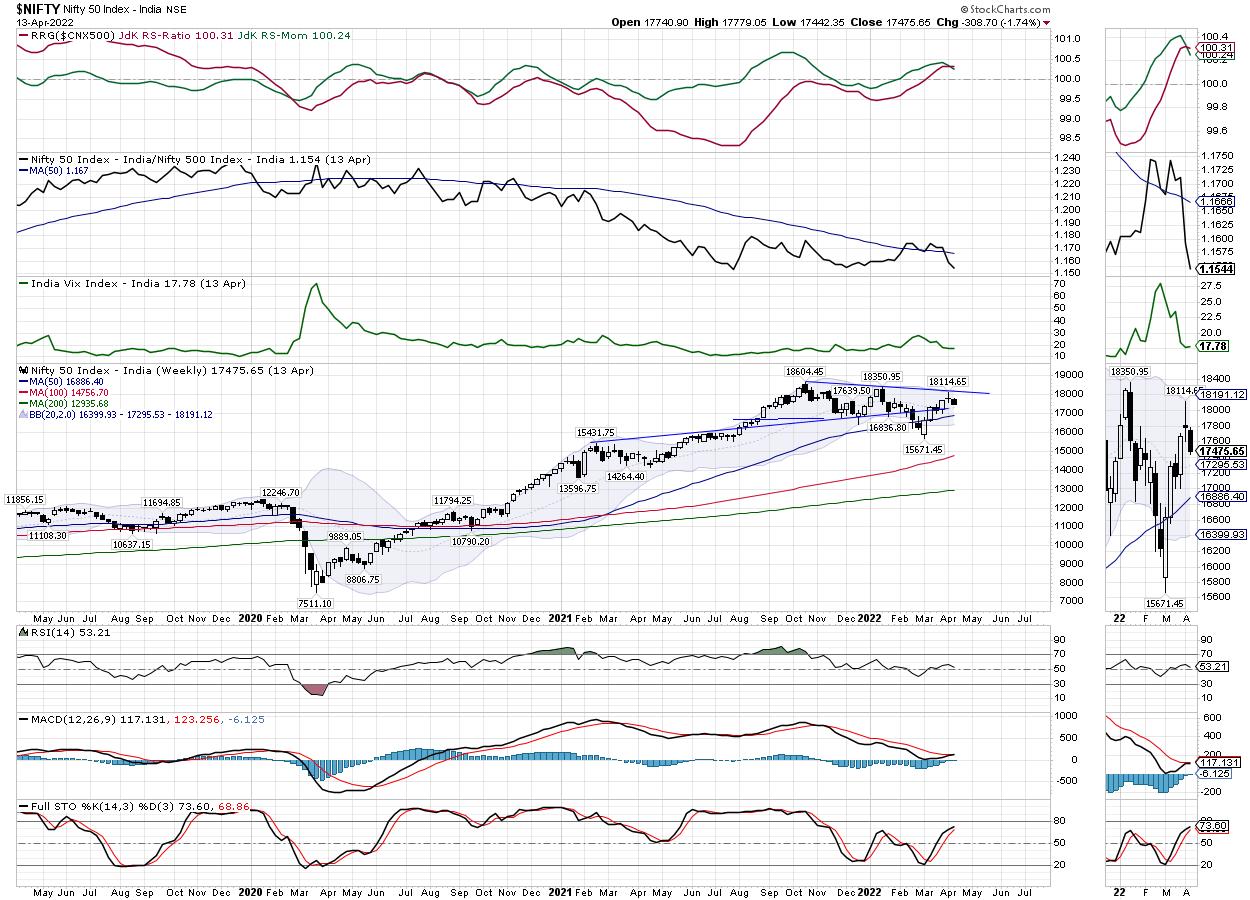
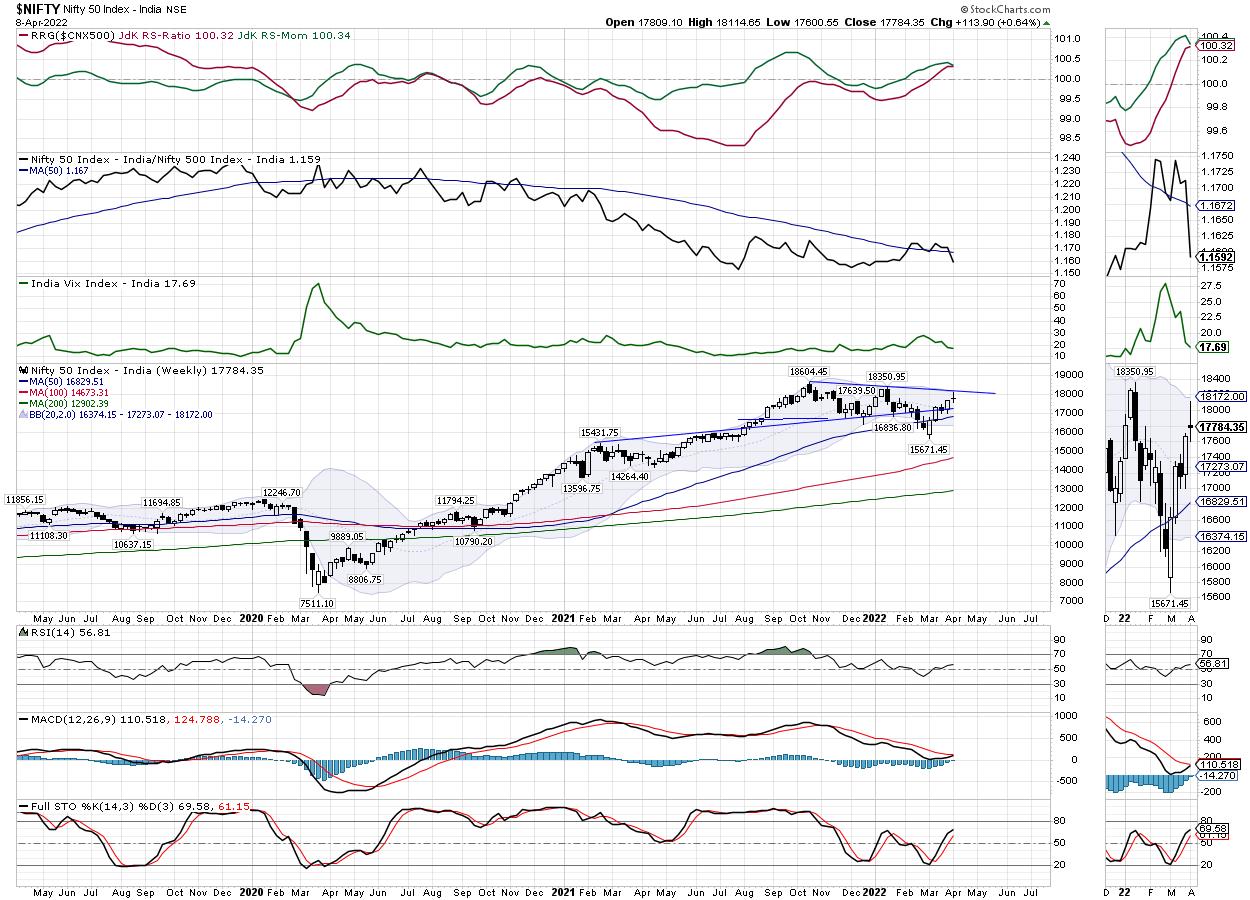
Week Ahead: NIFTY May Attempt a Technical Pullback Through The Week; RRG Chart Shows Pharma Sector Rolling Inside Leading Quadrant

by Milan Vaishnav,
Founder and Technical Analyst, EquityResearch.asia and ChartWizard.ae
In the previous weekly technical note, it was mentioned that, given the shortened trading week with two trading holidays, the equity markets may exhibit a tentative and cautious bias and may not show any major move on the upside. While keeping in line with this analysis, the NIFTY continued to...
READ MORE
MEMBERS ONLY

Are We Headed Lower?

by Mary Ellen McGonagle,
President, MEM Investment Research
On this episode of StockCharts TV'sThe MEM Edge, Mary Ellen highlights the key drivers for price action that are expected to carry into next week. She also reviews the number one event that's driving stocks and how you can prepare.
This video was originally broadcast on...
READ MORE
MEMBERS ONLY

A Defensive Picture No Matter How you Slice It

by Arthur Hill,
Chief Technical Strategist, TrendInvestorPro.com
Sector PerfCharts provide clear performance snapshots of the market mood and the market mood is defensive. The PerfCharts below show the percentage change for the S&P 500 SPDR (SPY) and the eleven sectors. These sectors can be divided into three groups: offensive sectors, defensive sectors and other.
The...
READ MORE
MEMBERS ONLY
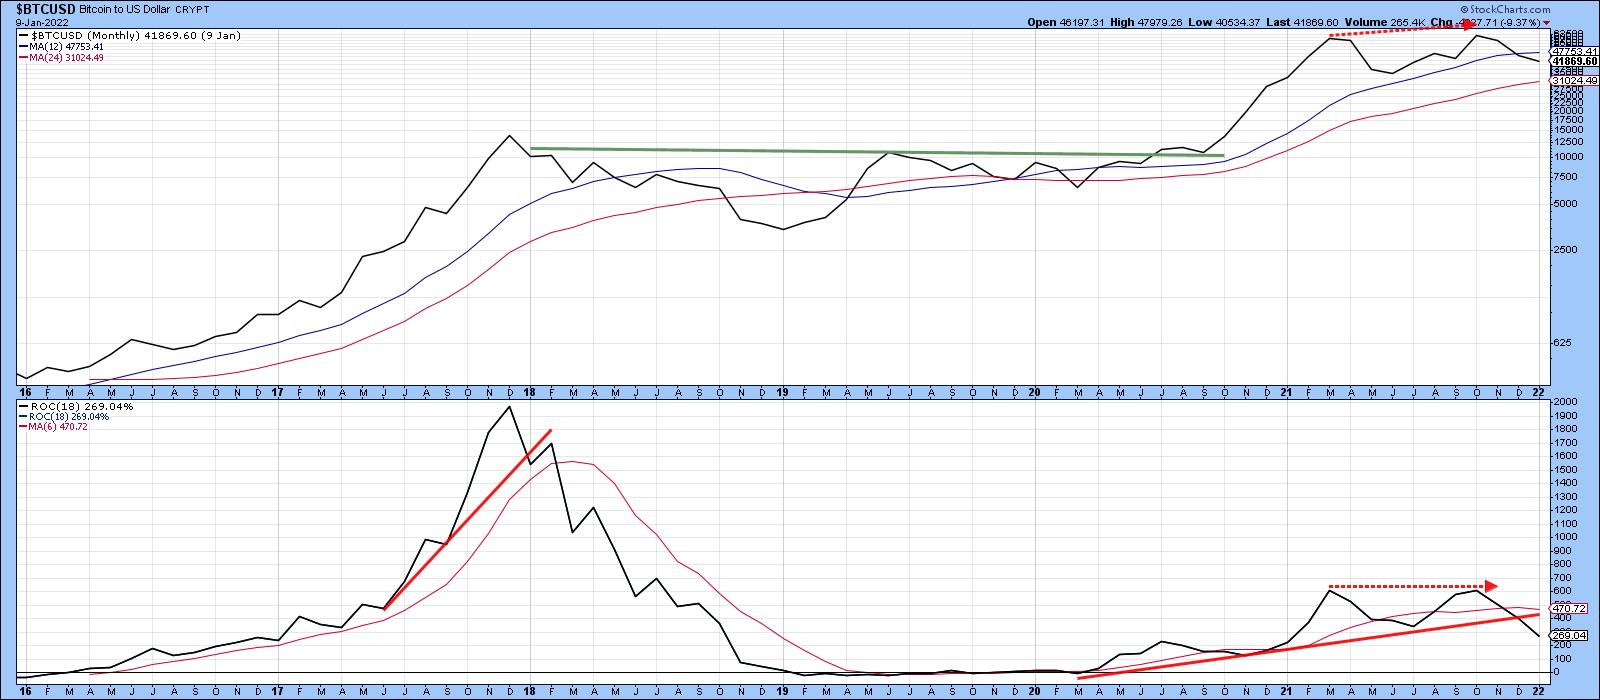
Has the Bitcoin Bubble Burst?
by Martin Pring,
President, Pring Research
In early December of last year, I wrote an articleon whether Bitcoin had reached the tipping point in terms of signaling a peak in the crypto bubble. Some may disagree about the "bubble" label; however, it seems to me that a financial category coming out of nowhere 10-years...
READ MORE
MEMBERS ONLY
Finding Opportunities as Earnings Season Kicks into High Gear

by John Hopkins,
President and Co-founder, EarningsBeats.com
It's that time of the year, Q1 Earnings Season, when thousands of companies reveal their numbers, including the good, the bad and the ugly. We've already seen a bit of everything, but that will pale in comparison to what is about to happen, with companies like...
READ MORE
MEMBERS ONLY

Is it Time to Get Bearish?

by Larry Williams,
Veteran Investor and Author
Larry is back in this new StockCharts TV special! There's a lot of opinions out there about what the curve means and talking heads are flapping all over about inflation. In this video, Larry shows the actual history of what this means so you can make informed decisions....
READ MORE
MEMBERS ONLY

Pockets of Strength in Weak Market

by TG Watkins,
Director of Stocks, Simpler Trading
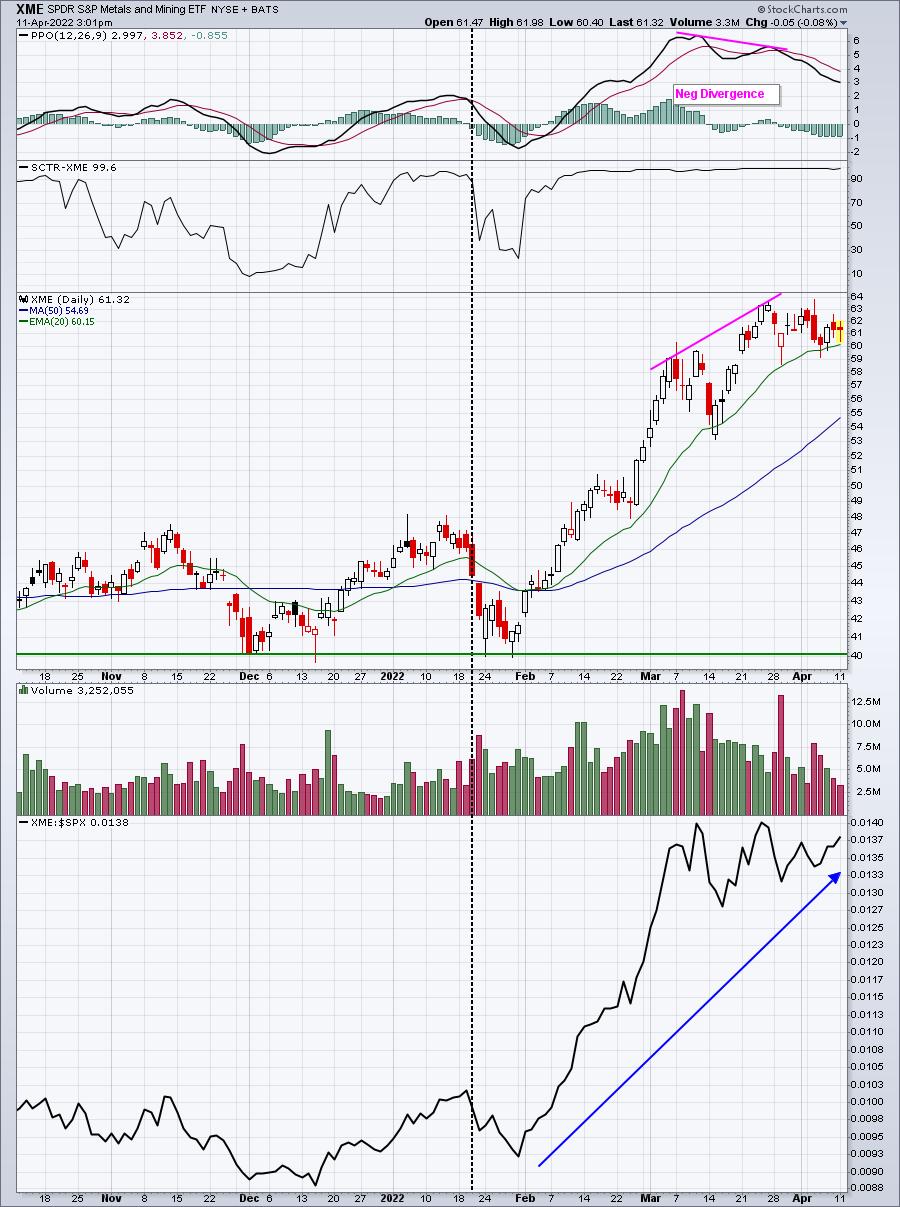
In this week's edition of Moxie Indicator Minutes, TG explains why he thinks the overall market is weak. He then points out where he is seeing the most strength. Commodities are the bullish place to be, along with precious metals.
This video was originally broadcast on April 14,...
READ MORE
MEMBERS ONLY

This Approach Is The Absolute Best Approach To Earnings Season

by Tom Bowley,
Chief Market Strategist, EarningsBeats.com
While our primary focus at EarningsBeats.com is technical analysis, we combine that technical approach with fundamental analysis as well. Earnings is what we do. Prior to earnings reports, we're scouting for those companies most likely to report better-than-expected earnings and also the opposite - companies we want...
READ MORE
MEMBERS ONLY

STOCKS END THE WEEK ON THE DOWNSIDE -- SECTOR ALIGNMENTS SEND WARNING SIGNALS
by John Murphy,
Chief Technical Analyst, StockCharts.com
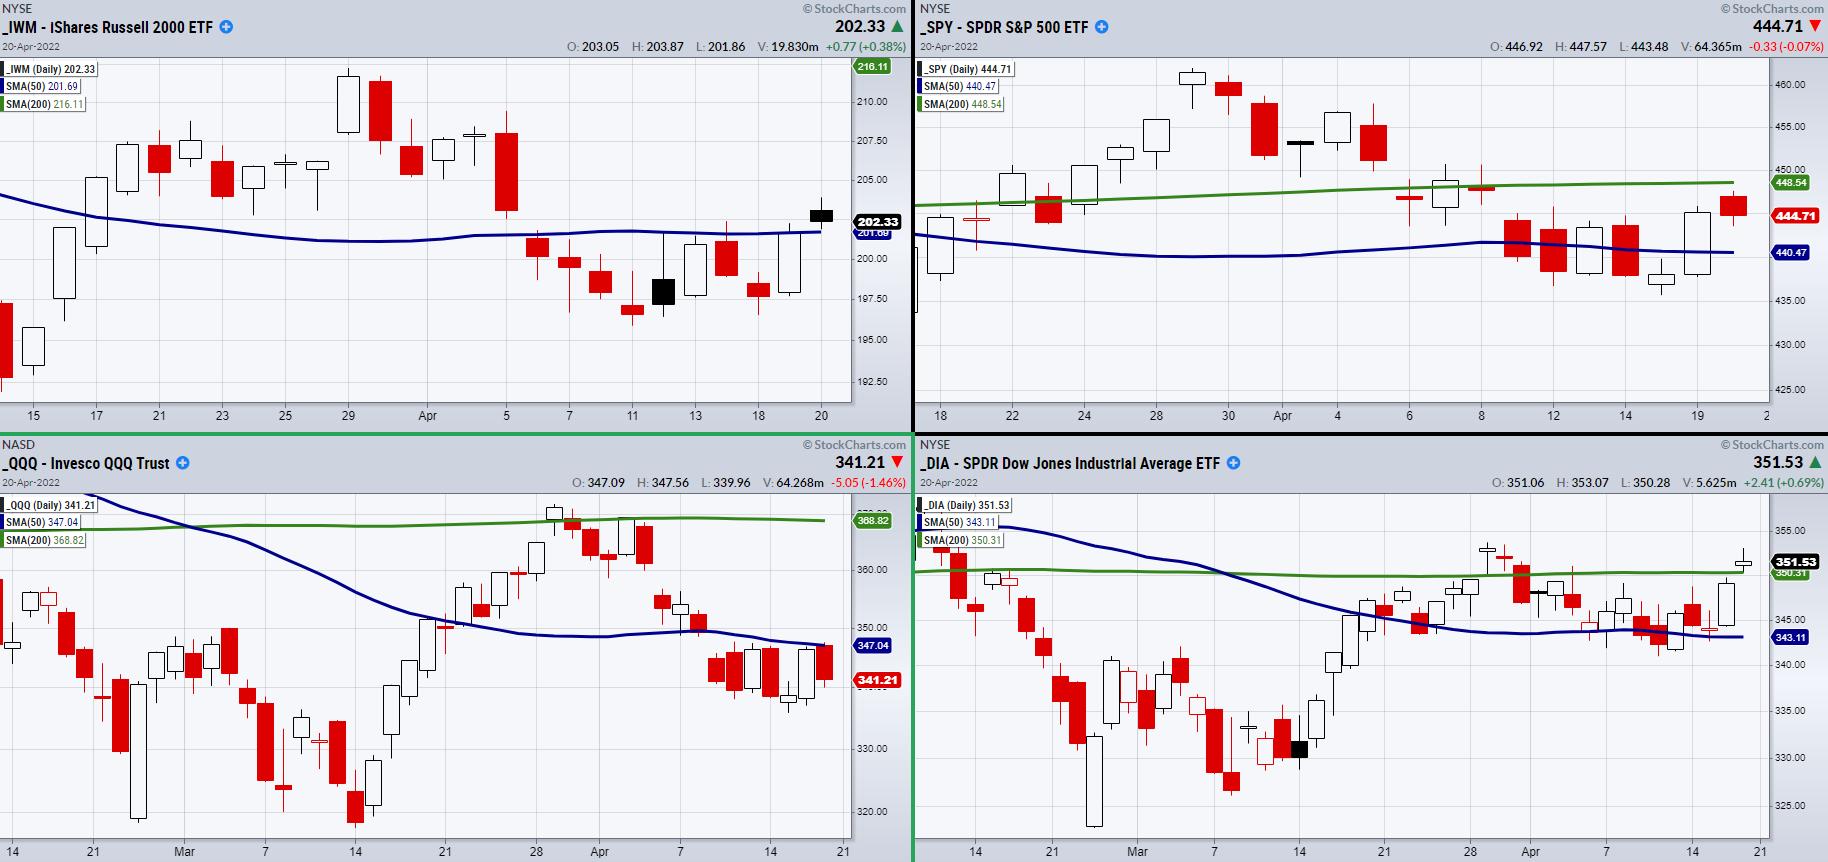
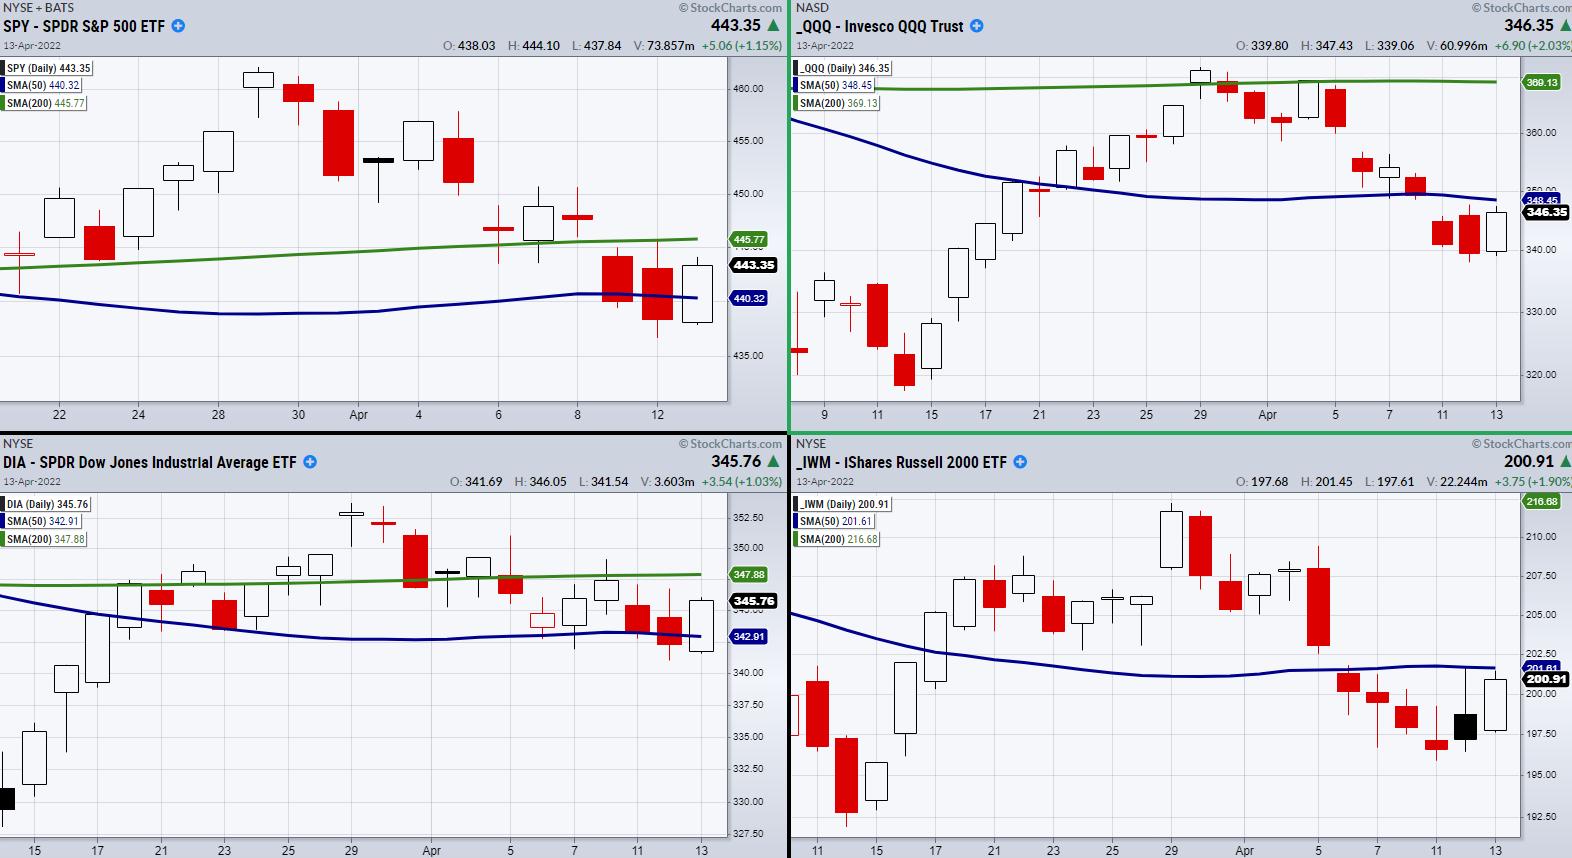
STOCKS CONTINUE TO WEAKEN... The technical condition of major U.S. stock indexes continues to weaken. All three shown below lost more ground during the week. Chart 1 shows the Dow Industrials meeting overhead resistance near their red 200-day moving average. Chart 2 shows the S&P 500 trading...
READ MORE
MEMBERS ONLY
Rising Rates, Strong Dollar, Surging Wheat
by Alex Cole,
Co-founder, GoNoGo Charts®
On this week's edition of the GoNoGo Charts show, Alex discusses another interesting week in the markets. We can see that the trends remain unchanged; "Go" trends persist in equities, commodities, the dollar and bitcoin. What is of note, however, is that only the greenback'...
READ MORE
MEMBERS ONLY
Differences Between MACD and ADX Divergences
by Joe Rabil,
President, Rabil Stock Research
In this week's edition of Stock Talk with Joe Rabil, Joe discusses the differences between MACD and ADX divergence, especially when ADX flashes a particular signal. He then discusses the XLK using the Fibonacci Retracement tool. Joe finishes up the show by analyzing the stock requests that came...
READ MORE
MEMBERS ONLY
Is the Stock Market Setting a Trap?
For the past two weeks, the market has been trending lower. With certain sectors sitting in oversold territory, we could be ready for a pop-up in price. However, this is a tricky spot, since a rally would be right into a resistance area.
As seen in the above chart, two...
READ MORE
MEMBERS ONLY

Why We Bought Invesco Agricultural Fund (DBA)
Last Friday, we bought the Invesco Agricultural Fund based on a breakout from a consolidation area. With inflation continuing higher, we see food prices joining for the ride.
One problem with soft commodities is that, when countries need more food, there is no instant fix, as it takes time to...
READ MORE
MEMBERS ONLY
Sector Spotlight: Market Past Top Shifting Towards Early Recession
by Julius de Kempenaer,
Senior Technical Analyst, StockCharts.com
In this edition of StockCharts TV's Sector Spotlight, I take a look at last week's rotations for asset classes and sectors, noticing the improving relative strength for stocks vs. bonds but a general weakening of both stock and bond markets in price terms. The rapid rise...
READ MORE
MEMBERS ONLY
Sector Rotation Model Signals Economy Moving Towards Early Recession
by Julius de Kempenaer,
Senior Technical Analyst, StockCharts.com
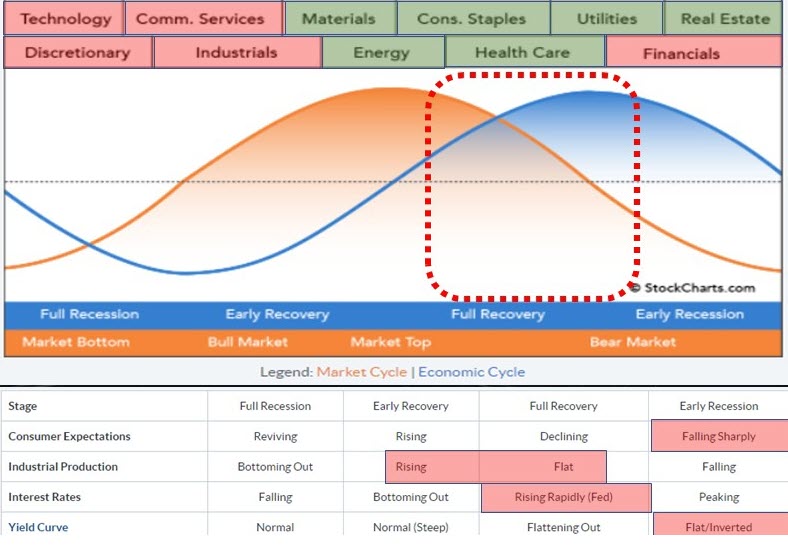
Every quarter, I try to do an update of the Sector Rotation Model. We have the framework as described by Sam Stovall here on the site. The image above shows my interpretation of the various factors that affect this model.
Across the top, you will find the eleven sectors. The...
READ MORE
MEMBERS ONLY
DP TV: Carl's Hedge on Interest Rates
by Erin Swenlin,
Vice President, DecisionPoint.com
by Carl Swenlin,
President and Founder, DecisionPoint.com
On this episode of DecisionPoint, Erin opens the show by letting viewers know that, in the DP Free Trading Room, she had been asked about hedging rising interest rates. Carl reminds viewers of his hedge against rising rates with this ETF he presented weeks ago. In his "Grab Bag&...
READ MORE
MEMBERS ONLY

Has the Bitcoin Bubble Burst?
by Martin Pring,
President, Pring Research
In early December of last year, I wrote an article on whether Bitcoin had reached the tipping point in terms of signaling a peak in the crypto bubble. Some may disagree about the "bubble" label; however, it seems to me that a financial category coming out of nowhere...
READ MORE
MEMBERS ONLY

Bitcoin Scare Tactics and Where It Needs to Hold
As of writing this article, Bitcoin is trading just under 40k. It has failed 3 key points and now people are getting scared. With that said, is this just a quick spook before it gets back on track, or should people give Bitcoin more caution?
In the above chart, there...
READ MORE
MEMBERS ONLY

Whipsaws

by Greg Morris,
Veteran Technical Analyst, Investor, and Author
We think it is a good time to revisit a topic that is always top of mind for tactical money managers and investors in rules-based strategies like trend following; and that is whipsaws.
Whipsaw trades are the one issue that will constantly concern investors using trend following strategies. Whipsaw trades...
READ MORE
MEMBERS ONLY
How To Create An ETF Strategy To Weather The Market Storm Ahead
by Tom Bowley,
Chief Market Strategist, EarningsBeats.com
The U.S. equity market is definitely NOT a one-size-fits-all when developing portfolio strategies. Different market environments require that we be flexible and willing to adjust to both "risk on" and "risk off" environments. I don't think there's much question that right...
READ MORE
MEMBERS ONLY
Here's A Red-Hot Group Threatening A Breakout
by Tom Bowley,
Chief Market Strategist, EarningsBeats.com
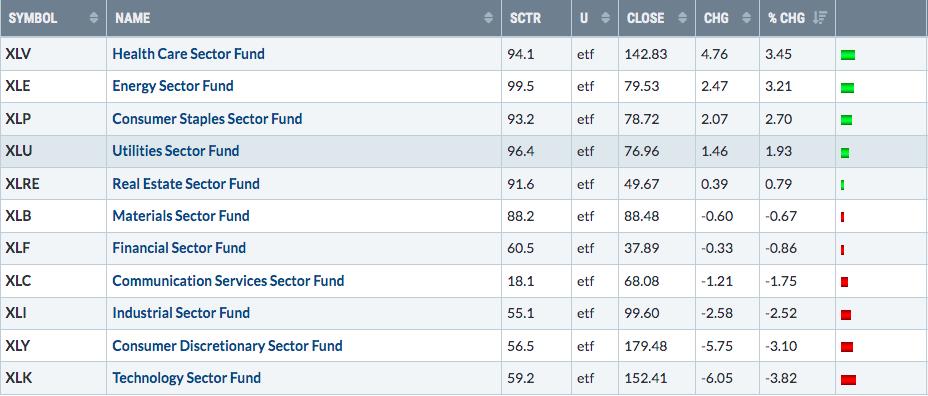
Defensive sectors is where the money is going right now. Last week was a perfect example. Check out the rotation last week:
The four defensive sectors and energy (XLE) finished the week in positive territory. The aggressive sectors and materials (XLB) were lower. That's been the theme in...
READ MORE
MEMBERS ONLY
Week Ahead: NIFTY Likely To Stay Tentative In The Shortened Week; RRG Chart Shows Defensive Stocks Likely To Do Well
by Milan Vaishnav,
Founder and Technical Analyst, EquityResearch.asia and ChartWizard.ae
The beginning of the previous week saw the NIFTY testing important pattern resistance levels. After a strong performance on Monday, the next three days of the week were spent by the NIFTY showing a weak and corrective bais as it came off rapidly from the high levels witnessed at the...
READ MORE
MEMBERS ONLY

Using Sentiment to Measure Short-term Extremes
by Arthur Hill,
Chief Technical Strategist, TrendInvestorPro.com
After a big surge in the second half of March, stocks fell back this week as the S&P 500 declined around 2%. This modest decline is warranted after the March surge, but it was not enough to push sentiment to an extreme. The AAII Bears are back above...
READ MORE
MEMBERS ONLY
Rally Interrupted - Three Charts That Define Last Week And One That's a Killer Hedge
by Mary Ellen McGonagle,
President, MEM Investment Research
The Federal Reserve's confirmation that they'll be taking an aggressive stance with their monetary policy to fight inflation, halted an emerging downtrend reversal in the markets. Prior to comments from Fed Governor Brainard on Tuesday, The S&P 500 and Nasdaq were both trending higher...
READ MORE
MEMBERS ONLY
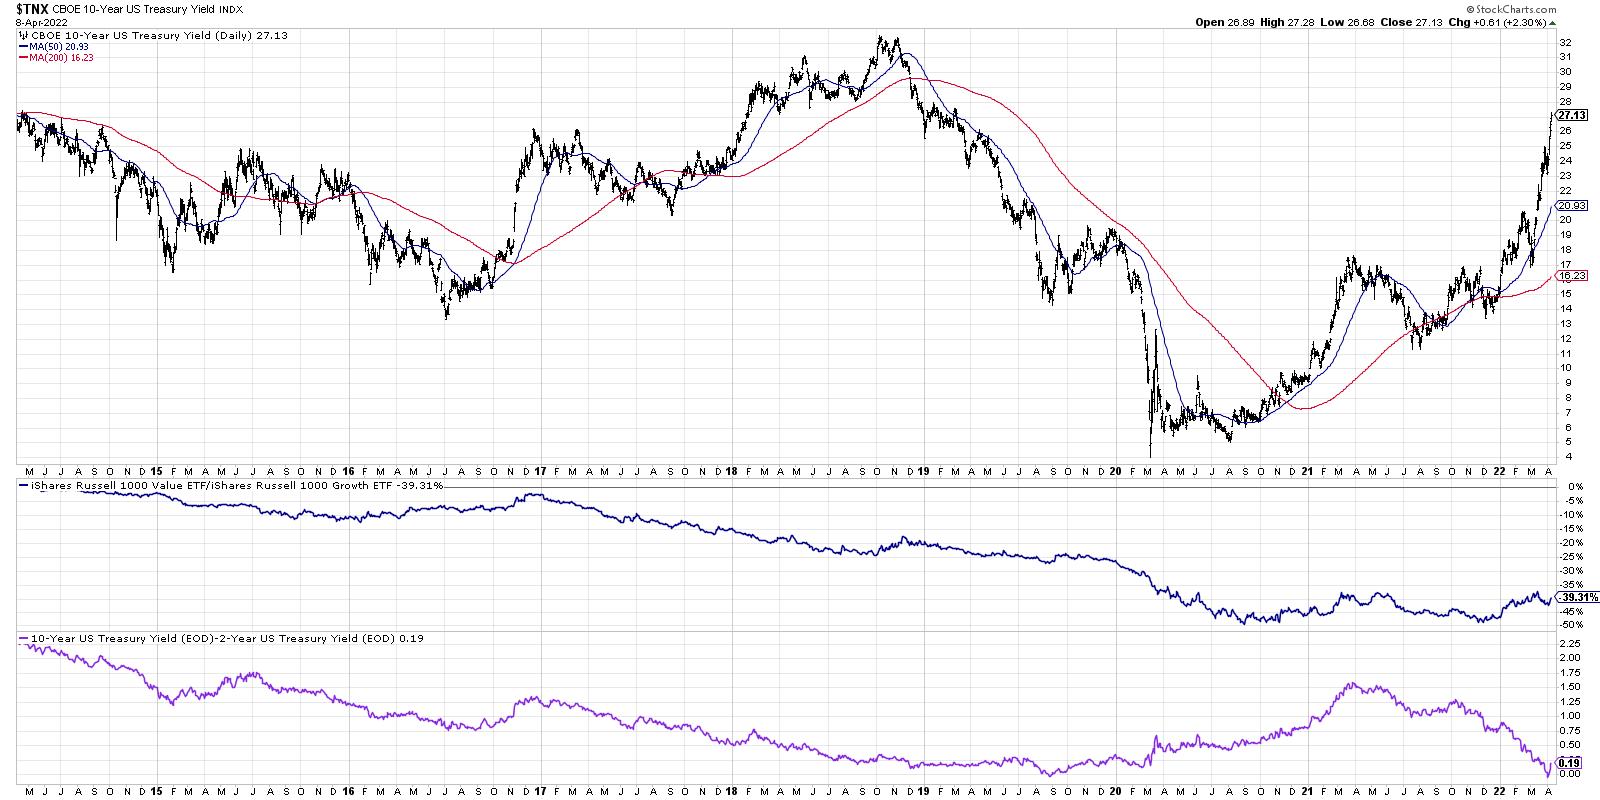
Flailing Financials Finally Finished?
by David Keller,
President and Chief Strategist, Sierra Alpha Research
This week's release of the Fed's March meeting minutes painted the picture of a hawkish Fed committed to raising rates to curb inflation. These latest comments from the Fed helped to push the Ten-Year Treasury Yield ($TNX) higher, finishing the week just above 2.7%.
This...
READ MORE
MEMBERS ONLY

How to Watch for Countertrend Trades Using the Russell 2000 (IWM)
Recently, we have focused on the Russell 2000 (IWM) small-cap index. Since IWM shows a large variety of companies, it gives a great picture of where the overall market is trading and where it could go next.
With that said, paired with our indicators, IWM gives us an edge when...
READ MORE
MEMBERS ONLY
Nasdaq Breaks Key Support! (with Danielle Shay)
by Mary Ellen McGonagle,
President, MEM Investment Research
On this episode of StockCharts TV'sThe MEM Edge, Mary Ellen reviews the break in the Nasdaq and what areas are driving this Index down. She also spoke with special guest Danielle Shay from Simpler Trading about what to be on the lookout for, with stocks due to report...
READ MORE
