MEMBERS ONLY
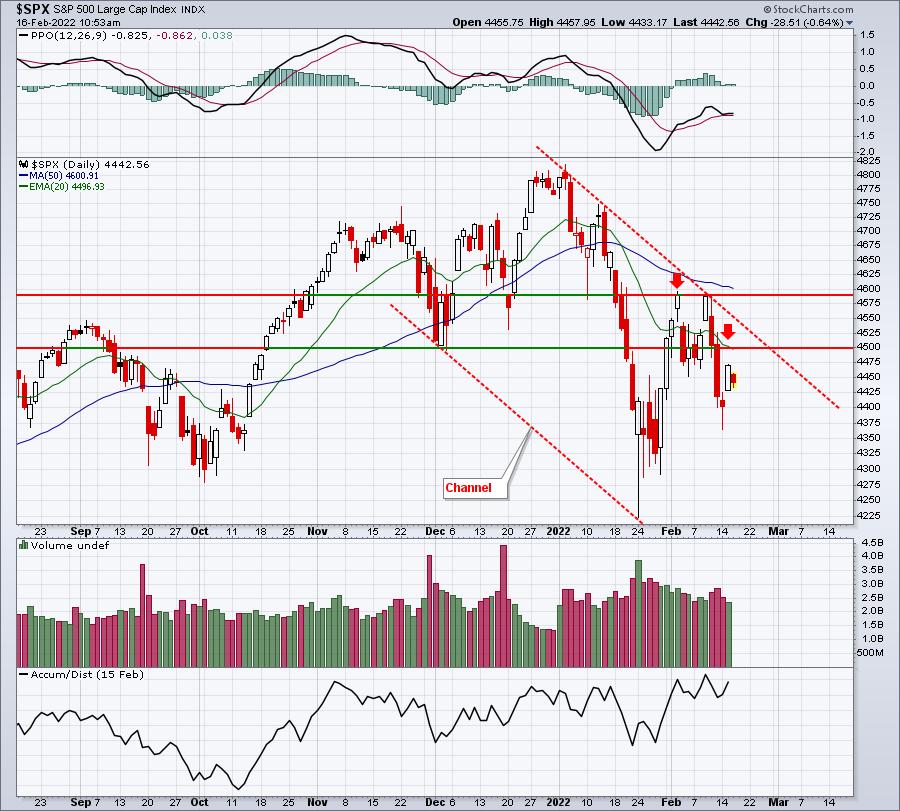
Watching Down Channel for Short-Term Directional Clue

by Tom Bowley,
Chief Market Strategist, EarningsBeats.com
It's options-expiration week so literally anything goes, especially with the Volatility Index ($VIX) remaining so elevated. In the very near-term, I wouldn't be surprised by a quick upside move to channel resistance or even to test the early February high. There's a TON of...
READ MORE
MEMBERS ONLY
Discretionary and Tech Are Crucial for the Direction of the Market

by Julius de Kempenaer,
Senior Technical Analyst, StockCharts.com
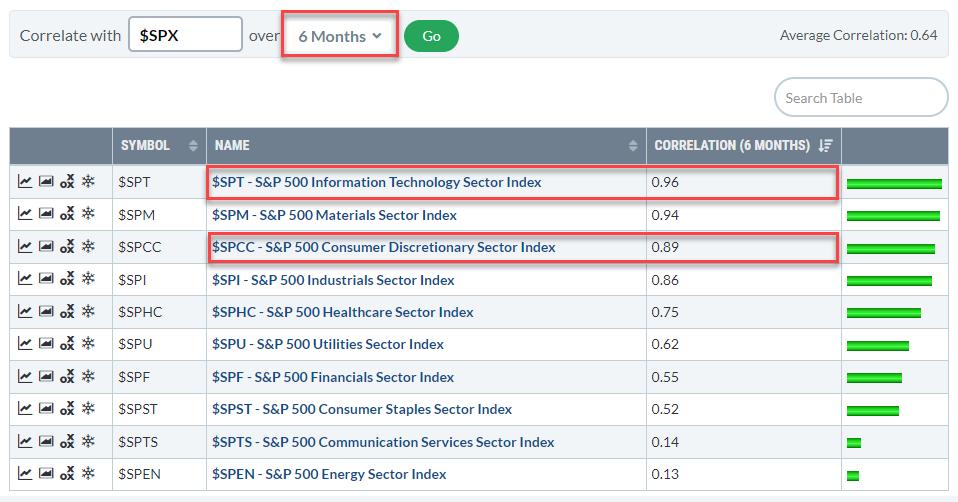
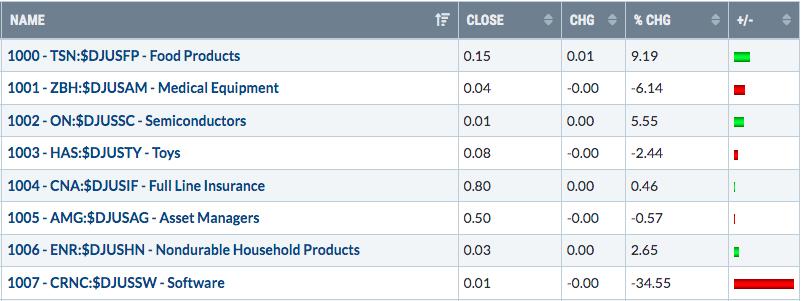
Correlation is a useful metric to use when trying to gauge the direction of the market.
The table above shows the correlations for the 12 sectors against the S&P 500. In this version, I used a 6-month period to calculate the correlation; the drop-down selector allows users to...
READ MORE
MEMBERS ONLY
Is This Another Rally Into Resistance?
Mish's Economic Modern Family, which consists of 7 symbols that help guide us through the market, has many of the same problems the major indices are stuck with currently; namely, fairly tight trading ranges that keep investors worried about quick selloffs and volatile market conditions. With that said,...
READ MORE
MEMBERS ONLY

Will There Be a Bear Market?

by Larry Williams,
Veteran Investor and Author
In this new StockCharts TV special, Larry Williams shares what he thinks is coming up. He walks us through the historical data, shares the points he believes are the most important to take into consideration and goes on record with his answer to the question everyone is asking - are...
READ MORE
MEMBERS ONLY

Sector Spotlight: Old Support Returns as Resistance
by Julius de Kempenaer,
Senior Technical Analyst, StockCharts.com
In this edition of StockCharts TV's Sector Spotlight, I go over last week's rotations in Asset Classes and Sectors and put these into a weekly perspective. In the Asset Class section, I zoom in on Stocks, Bonds and Commodities. In sectors, I look at rotations for...
READ MORE
MEMBERS ONLY

DP TV: This Indicator Called the 2020 Bear Market Low

by Erin Swenlin,
Vice President, DecisionPoint.com

by Carl Swenlin,
President and Founder, DecisionPoint.com
On this episode of DecisionPoint, Carl discusses the three and half "Bubbles" that have been getting bigger and considers what pins might pop them. He also discusses the DecisionPoint outlook on the market, a possible downside exhaustion climax and his thoughts on Gold. Erin shows you the powerful...
READ MORE
MEMBERS ONLY
What to Do Next With No Clear Stock Market Direction
Currently, the market is digesting last Friday's big move and is not giving us any clear directional signs. After the major indices failed to clear key resistance levels last week, the market began to sell off.
Though Monday is showing a continuation from the previous Friday with a...
READ MORE
MEMBERS ONLY
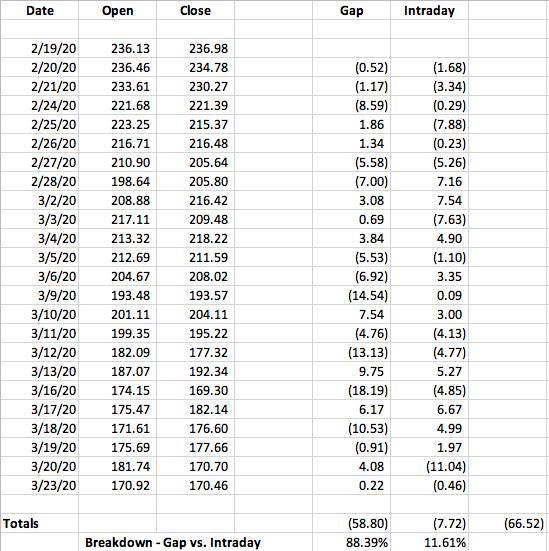
Misunderstanding Average

by Greg Morris,
Veteran Technical Analyst, Investor, and Author
Did you hear about the six-foot tall Texan that drowned while wading across a stream that averaged only 3 feet deep? The "World of Finance" is fraught with misleading information. The use of average is one that needs a discussion.
Figure A shows how easily it is to...
READ MORE
MEMBERS ONLY
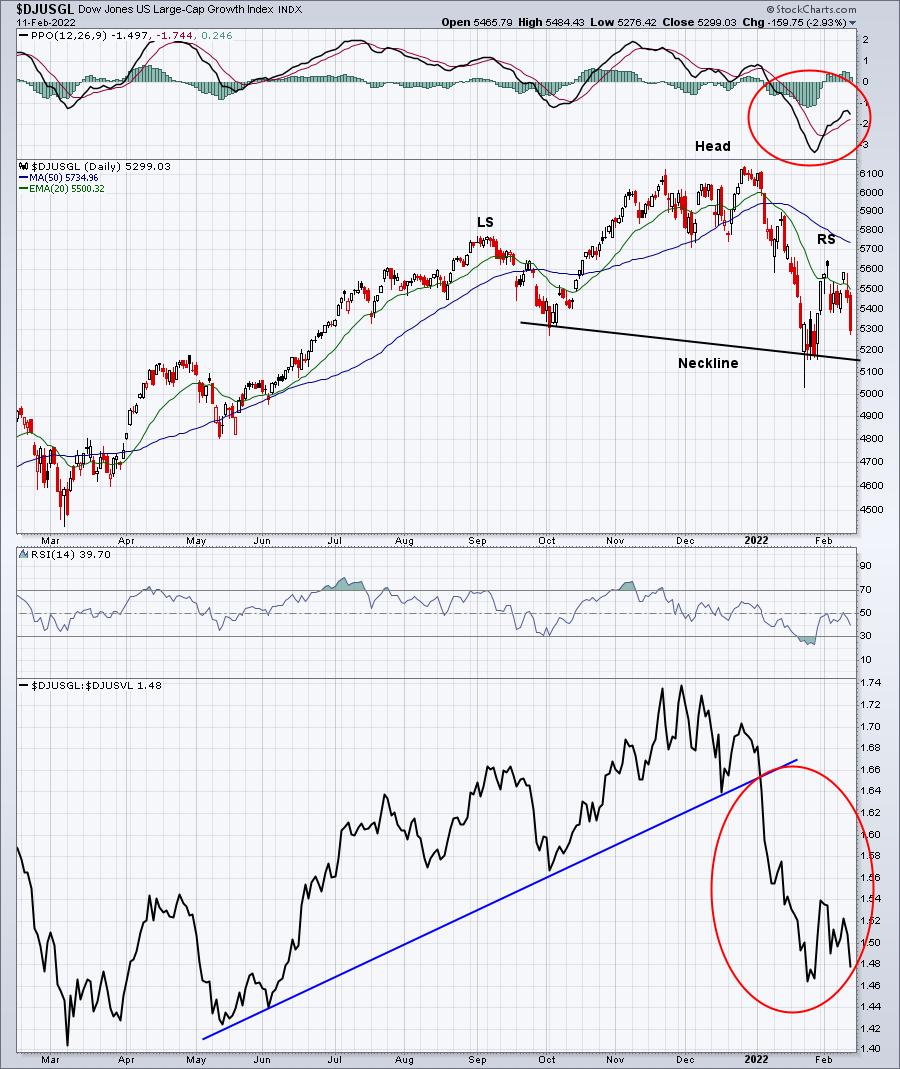
Large Cap Names Adding To List of Big Worries
by Tom Bowley,
Chief Market Strategist, EarningsBeats.com
For the past year, the bulls have been able to hang onto one argument - that the large cap growth stocks continued to outperform their large cap value counterparts, which, in turn, held up our major indices. That may not be the case any longer. The cracks in the large...
READ MORE
MEMBERS ONLY
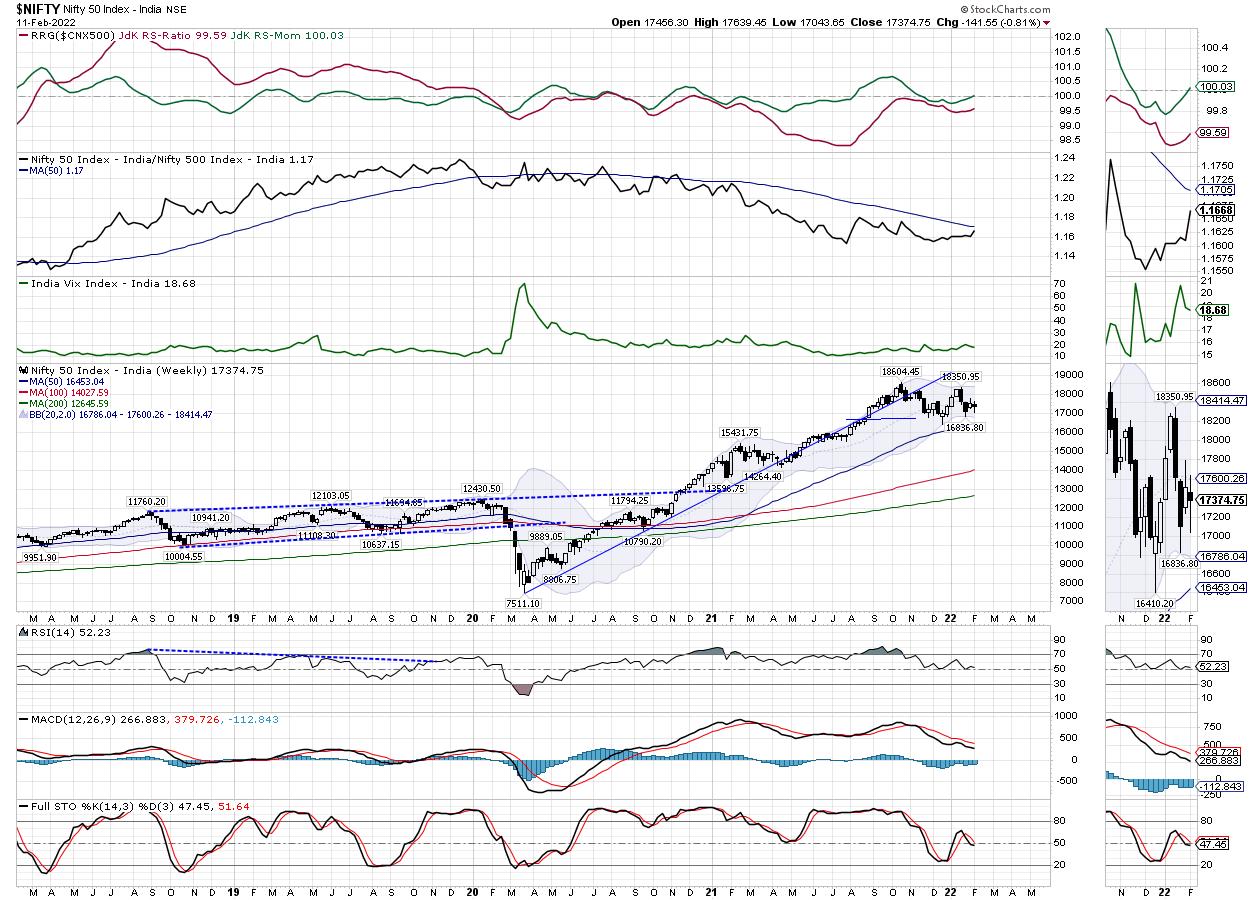
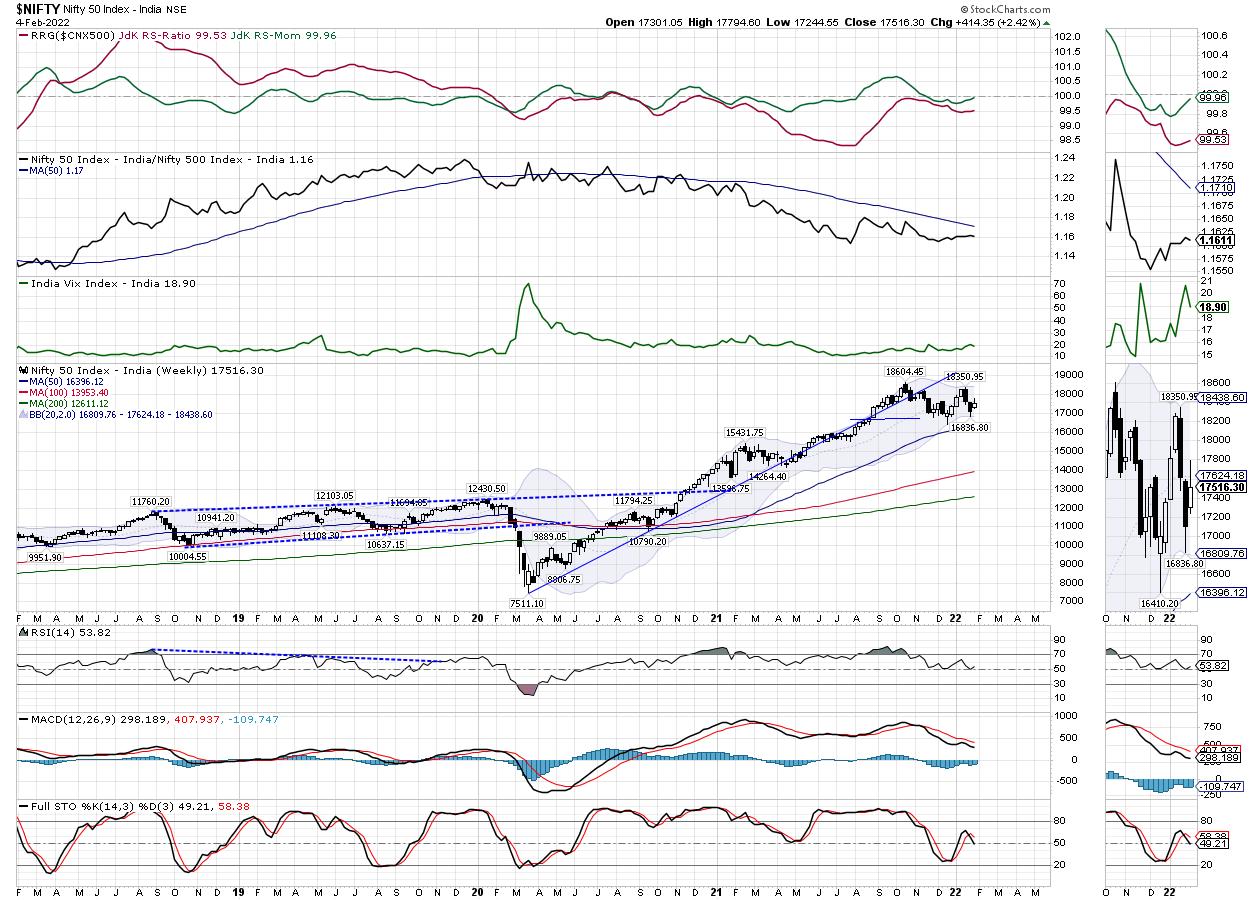
Week Ahead: NIFTY May See Itself Starting To Relatively Outperform The Broader Markets; RRG Chart Shows These Sectors Doing Well

by Milan Vaishnav,
Founder and Technical Analyst, EquityResearch.asia and ChartWizard.ae
Consolidation continued in the Indian equities; despite a wide trading range and some volatile moves, the markets went on to end with just a modest cut. The NIFTY has resisted the 20-week MA, which presently stands at 17604 in the week before this one, and it also resisted this WMA...
READ MORE
MEMBERS ONLY
Vice Stocks That are Tailored for the Current Market Environment

by Mary Ellen McGonagle,
President, MEM Investment Research
I don't have to tell you that these markets have been tough.
Last week was particularly trying, as we were seeing signs of a downtrend reversal before Thursday's high inflation report, coupled with heightened tensions between Russia and Ukraine, pushed the markets back into a downtrend,...
READ MORE
MEMBERS ONLY
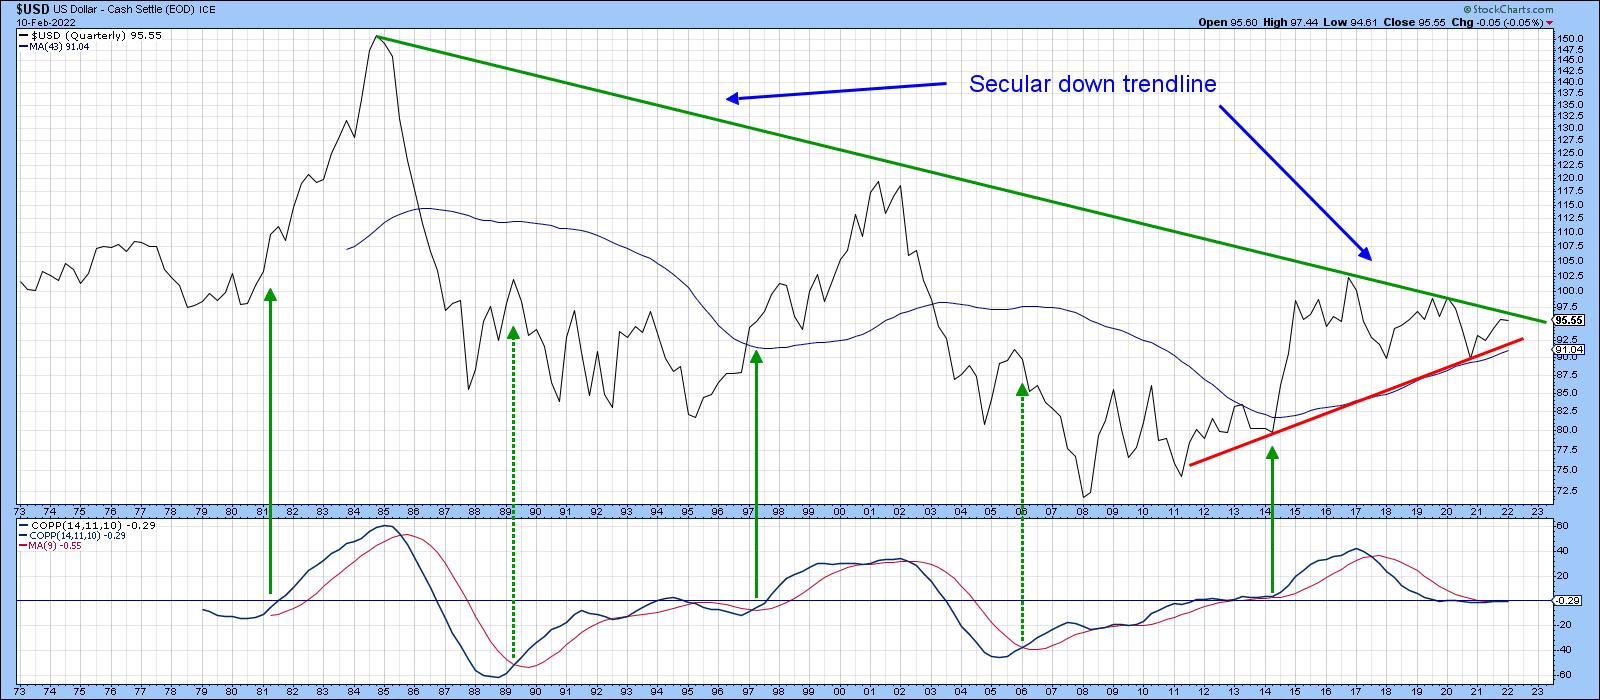
The Effect of this Bearish Weekly Two-Bar Reversal is About to Test the Bull Market Case for the Dollar Index

by Martin Pring,
President, Pring Research
Before we look at the two-bar reversal, let's first review the long-term technical position for the Dollar Index. It's laid out on a quarterly basis in Chart 1, along with a Coppock momentum indicator. The first thing to note is that the Index is positioned below...
READ MORE
MEMBERS ONLY

Bear Market Rules Refresher
by Erin Swenlin,
Vice President, DecisionPoint.com
I must sound like "Debbie Downer", given this is my second ChartWatchers article with "bear market" in the title. I am bearish right now, but had to remind myself of "Bear Market Rules" Thursday after getting a little too bullish on Wednesday.
As with...
READ MORE
MEMBERS ONLY
Sushi Investing, Part 2: How To Sell Equities Before The Expiration Date

by Gatis Roze,
Author, "Tensile Trading"
Within the stock market, selling profitably is considered an art. In the real world, most folks love art and are happy to talk about it. Institutional investors will talk about the "art of the exit" before they buy an equity. So why is it that individual investors deem...
READ MORE
MEMBERS ONLY

Good Stocks for High Inflation
by Mary Ellen McGonagle,
President, MEM Investment Research
On this episode of StockCharts TV'sThe MEM Edge, Mary Ellen reviews where the markets are headed and which areas are poised to weather the increased volatility. She also shares where to reduce your exposure as the Fed begins their interest rate hike cycle.
This video was originally recorded...
READ MORE
MEMBERS ONLY
As the Market's Wild Ride Continued, I Did Some Shopping

by John Hopkins,
President and Co-founder, EarningsBeats.com
I sat down to write my article Friday morning and each time I thought I had the right headline -- I didn't!
You see, it's different when the market is green, the VIX is calm, all is well. It's another thing when the NASDAQ...
READ MORE
MEMBERS ONLY
Taking Profits While the Market Tanks
Both the S&P 500 (SPY) and the Nasdaq 100 (QQQ) failed to clear key resistance areas this past week.
Additionally, the CPI reported that inflation is yet again on the rise, sitting over 7% on a year-over-year basis as talks of war continue to heat up.
None of...
READ MORE
MEMBERS ONLY
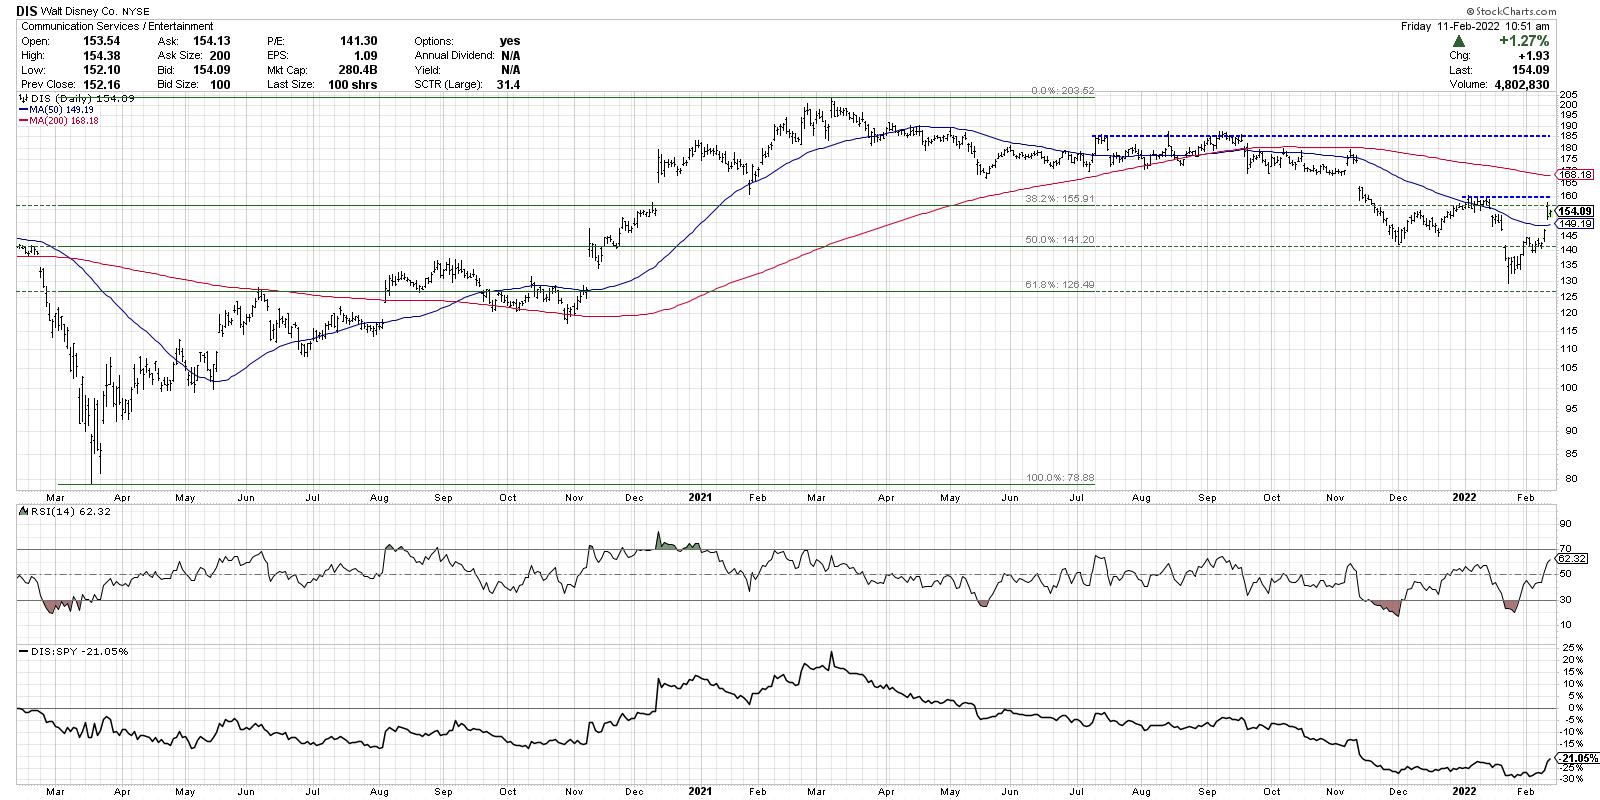
The Indicator to Watch for DIS and $SPX

by David Keller,
President and Chief Strategist, Sierra Alpha Research
The current chart of Walt Disney Co. (DIS) provides a perfect case study on how the Relative Strength Index (RSI) can be used to better understand the underlying trend in a stock.
Disney rallied off its March 2020 low along with most other names, but the real outperformance began in...
READ MORE
MEMBERS ONLY
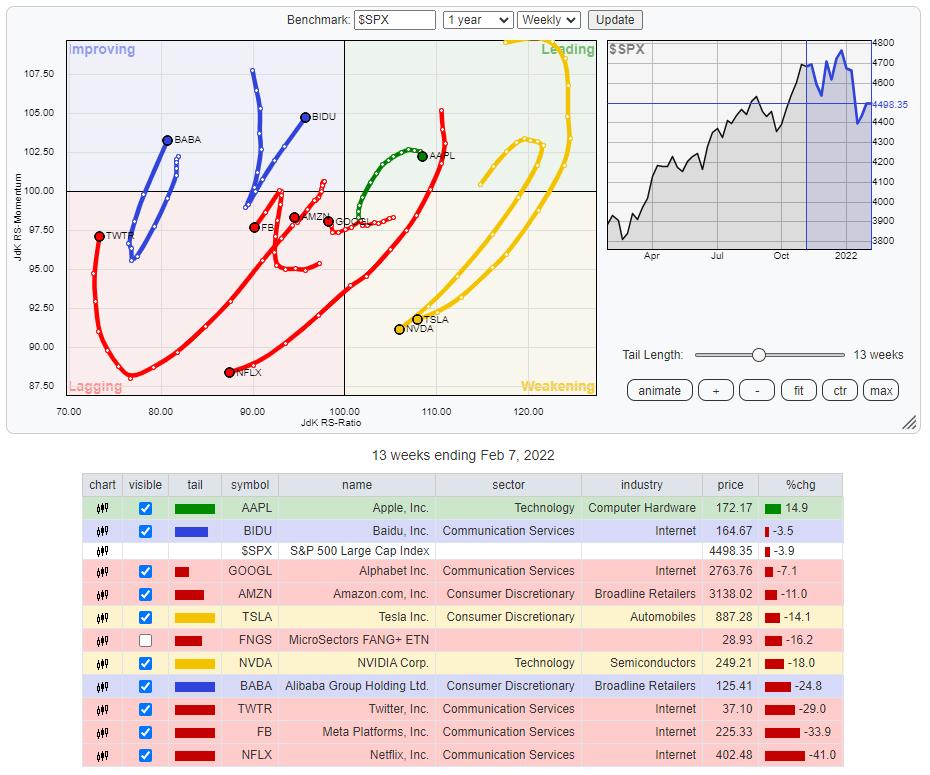
Trouble In FAANG(sta's) Paradise
by Julius de Kempenaer,
Senior Technical Analyst, StockCharts.com
This Relative Rotation Graph shows the rotation for the NYFANG+ members over the last thirteen weeks (quarter). Plotting this universe against the S&P 500 index clearly shows the weakness that crept into this universe recently.
Leading Quadrant
AAPL is the only stock that managed to keep up inside...
READ MORE
MEMBERS ONLY

INFLATION FEARS PUSH BOND YIELDS HIGHER AND STOCKS LOWER --THE DOW AND S&P 500 TRADE BELOW 200-DAY LINES -- THE NASDAQ 100 MEETS RESISTANCE AT ITS RED LINE

by John Murphy,
Chief Technical Analyst, StockCharts.com
STOCKS FAIL TEST OF MOVING AVERAGE LINES... Thursday's CPI report showed January inflation rising 7.5% on an annual basis which was the highest number in four decades (since 1982). That higher inflation number raised prospects for a more aggressive Fed starting next month, and pushed stocks sharply...
READ MORE
MEMBERS ONLY

Where Will Price Go?

by TG Watkins,
Director of Stocks, Simpler Trading
In this week's edition of Moxie Indicator Minutes, TG discusses stressors that are affecting market action. This includes the Fed and rising interest rates. Then, he deep dives into technical analysis, which is telling a different story than the news.
This video was originally broadcast on February 11,...
READ MORE
MEMBERS ONLY

Metals & Mining SPDR Goes for Relative and Absolute Breakouts

by Arthur Hill,
Chief Technical Strategist, TrendInvestorPro.com
It's been a rough year for much of the market, but the Metals & Mining SPDR (XME) is bucking the selling pressure as it challenges its 2021 highs and the price relative breaks out. There is also a big bullish continuation pattern at work. Note that 40% of...
READ MORE
MEMBERS ONLY
The Rebound Looks Highly Orchestrated And Manipulated
by Tom Bowley,
Chief Market Strategist, EarningsBeats.com
I'm not a huge conspiracy theorist, but when it comes to Wall Street and all the TRILLIONS of dollars at stake, I believe anything goes! I especially love studying volatile periods. Are there signals out there to help us identify the REAL moves higher from the FAKE moves?...
READ MORE
MEMBERS ONLY

Chartwise Women: How to Use ETFs During This Volatile Period
by Mary Ellen McGonagle,
President, MEM Investment Research
by Erin Swenlin,
Vice President, DecisionPoint.com
On this week's edition of Chartwise Women, Erin and Mary Ellen talk all about ETFs (exchange-traded funds) and how to use them in volatile periods to buffer yourself.
This video was originally broadcast on February 10, 2022. Click on the image above to watch on our dedicated Chartwise...
READ MORE
MEMBERS ONLY

Energy & Financials Lead While Rates Jump Higher

by Alex Cole,
Co-founder, GoNoGo Charts®

by Tyler Wood,
Co-founder, GoNoGo Charts®
In this week's edition of the GoNoGo Charts show, we have "Go" conditions on the daily chart. US Equities still hovering at inflection point. Overall, we have "NoGo" Conditions for the trend of the S&P 500, but the GoNoGo Oscillator is breaking...
READ MORE
MEMBERS ONLY

Find Key Levels By Using Fibonacci Retracements

by Joe Rabil,
President, Rabil Stock Research
In this week's edition of Stock Talk with Joe Rabil, Joe discusses how he uses the Fibonacci Retracement tool to identify key levels to watch as a stock is pulling back. He shows how he finds confluence among different indicators to zero in on important areas of support....
READ MORE
MEMBERS ONLY
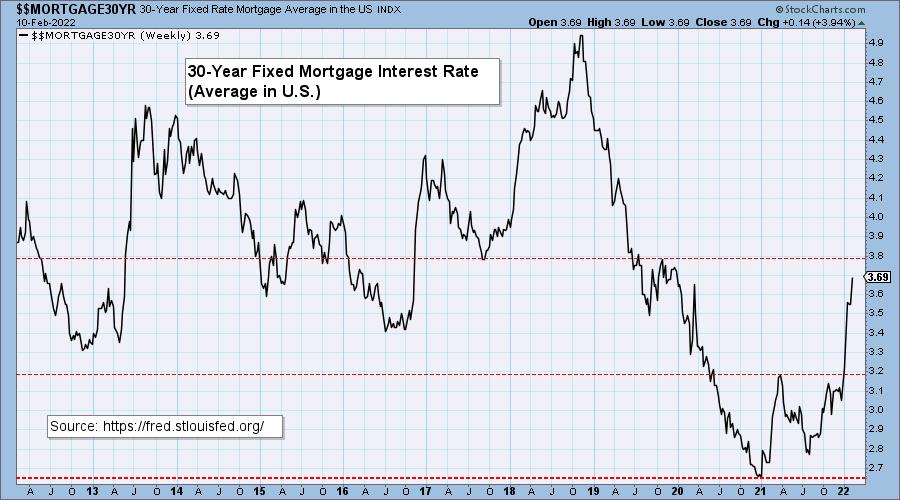
Squeezing the Real Estate Bubble
by Carl Swenlin,
President and Founder, DecisionPoint.com
In a January 20 article Jeremy Grantham proposed that there are currently bubbles in housing, equities, and bonds, and a half-bubble in commodities. In this article I will only address the current housing bubble. An immediate response might be, "What bubble?" We continue to hear how inventories are...
READ MORE
MEMBERS ONLY
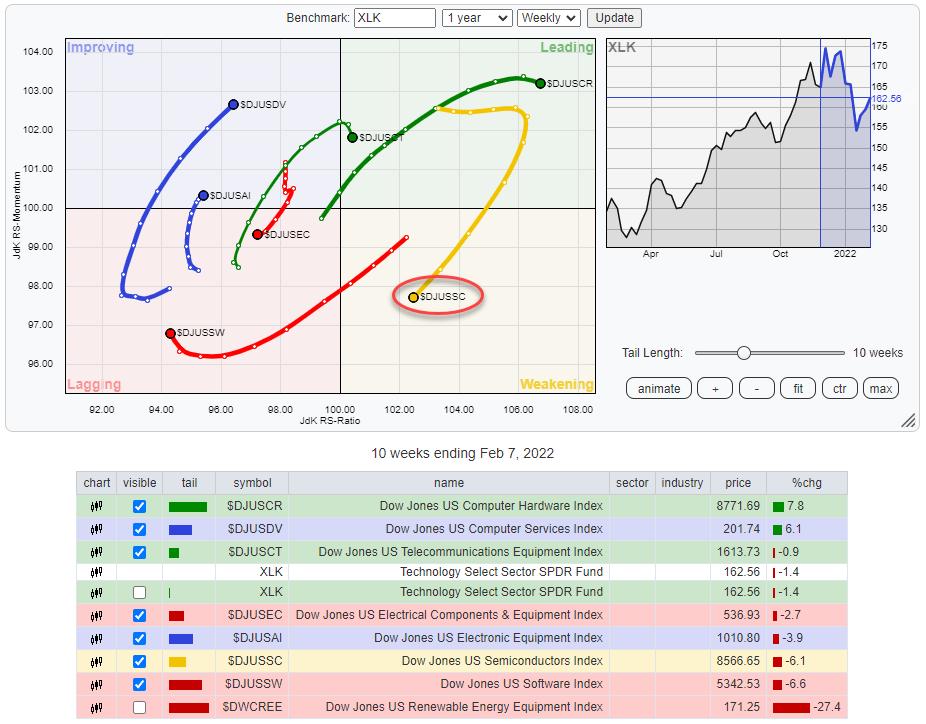
Semiconductors at Risk!
by Julius de Kempenaer,
Senior Technical Analyst, StockCharts.com
The Technology sector is under pressure for a few weeks already. We have seen a few attempts to bounce back but, so far, these have not been very successful.
The Relative Rotation Graph above shows the groups within the technology sector. The Semiconductors group was a major contributor on the...
READ MORE
MEMBERS ONLY
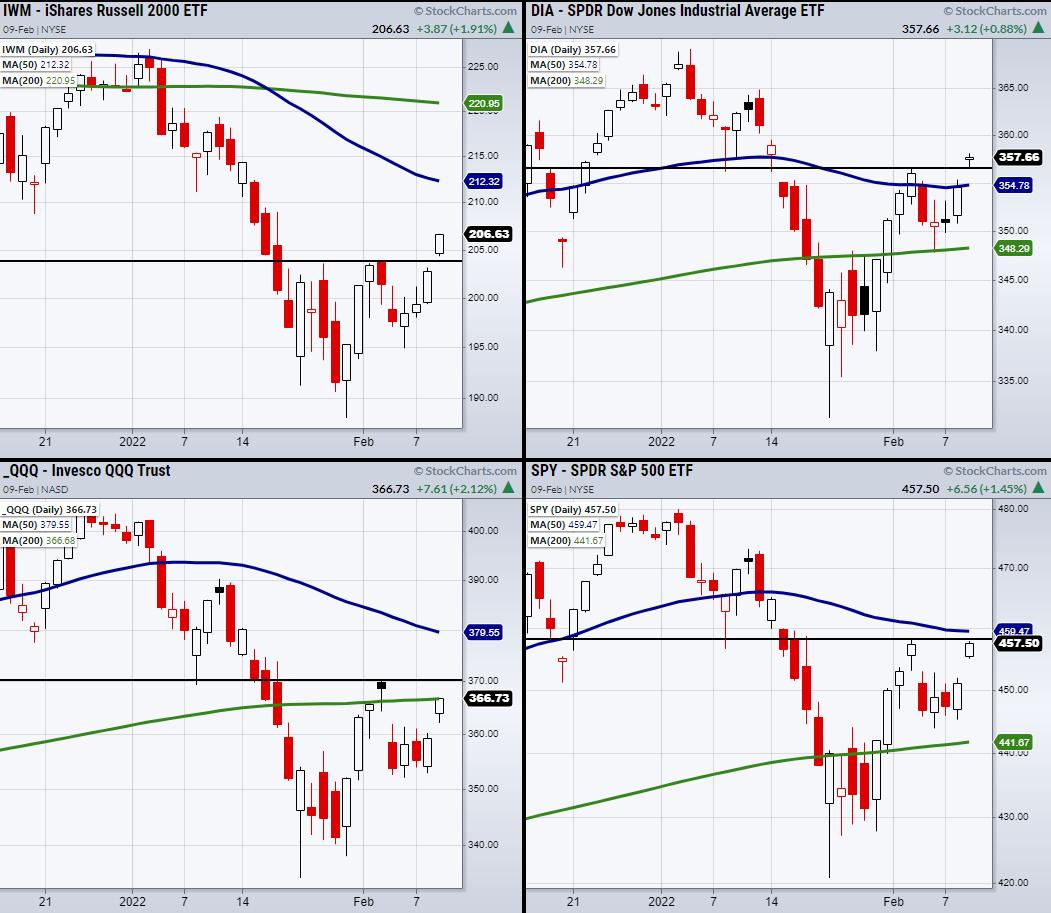
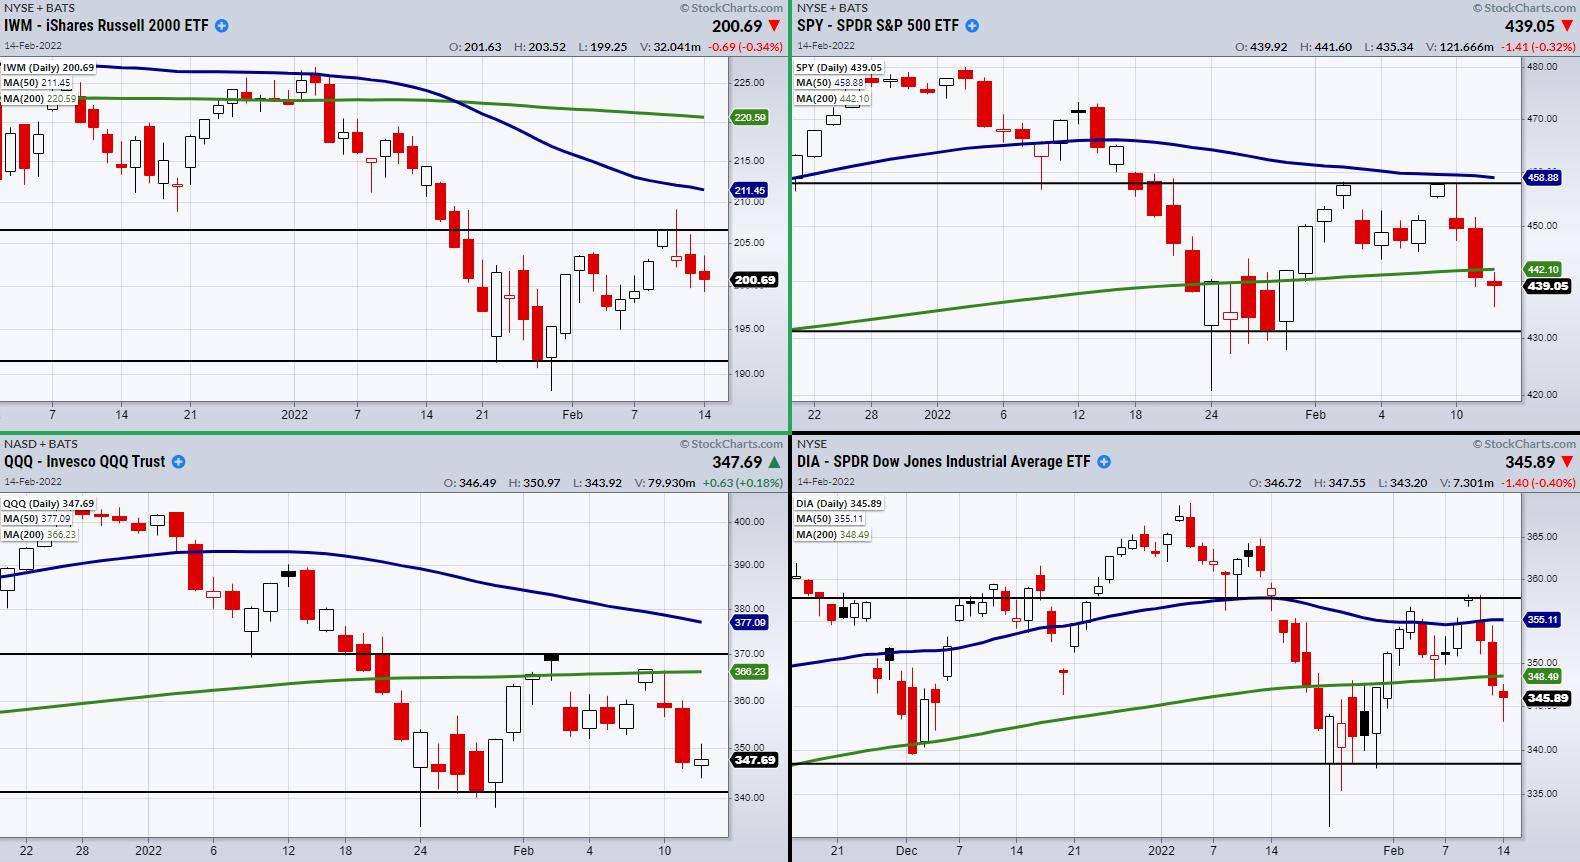
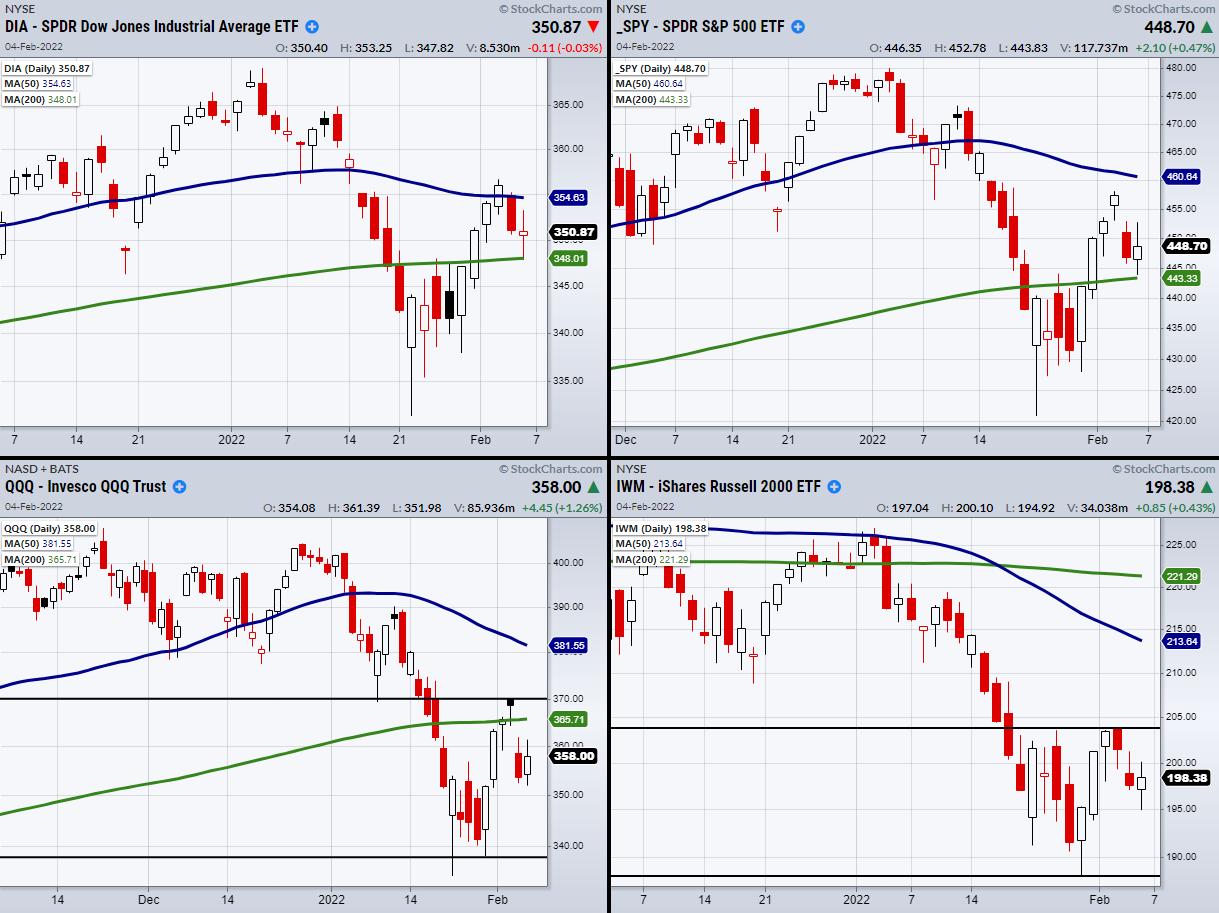
Support and Resistance Levels to Watch for Thursday's Trading Session
Two of the major indices, including the Russell 2000 (IWM) and the Dow Jones (DIA), have cleared key resistance levels. However, the S&P 500 (SPY) and the Nasdaq 100 (QQQ) have yet to clear recent highs or major moving averages. Although Wednesday's price action looks hopeful,...
READ MORE
MEMBERS ONLY

Market Down-Trend Sell Signals + 22 Trading Resolutions, Part 4

by Dave Landry,
Founder, Sentive Trading, LLC
On this week's edition of Trading Simplified, Dave shows the state of the market downtrend and sell signals. There's a new Mystery Chart and a follow up demonstrating methodology in action. He then continues with his 22 trading resolutions for 2022.
This video was originally broadcast...
READ MORE
MEMBERS ONLY
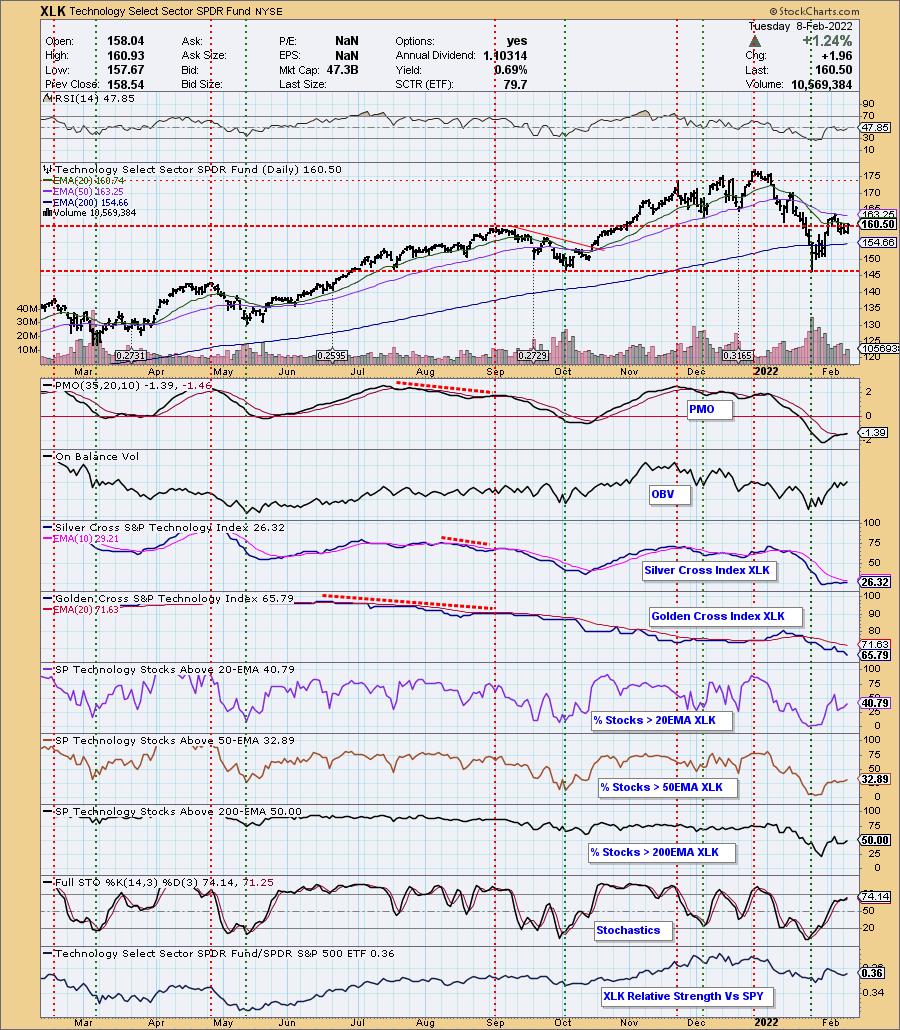
PMO BUY Signals Trigger on Technology and Healthcare Sectors
by Erin Swenlin,
Vice President, DecisionPoint.com
We had two sectors trigger new Price Momentum Oscillator (PMO) BUY signals today, Technology (XLK) and Healthcare (XLV). Let's look "under the hood" to see whether these PMO BUY signals mean more upside for both sectors. On the DecisionPoint.com website, subscribers have access to our...
READ MORE
MEMBERS ONLY

Is the Biotech Space Looking for a Major Price Move?
The past four trading days have held roughly the same price areas within the major indices. Specifically, the S&P 500 (SPY) and the Nasdaq 100 (QQQ) have similar tight price action.
When watching for larger than average price moves, tight or consolidative price action can often lead to...
READ MORE
MEMBERS ONLY
Sector Spotlight: Bonds Take a Nosedive
by Julius de Kempenaer,
Senior Technical Analyst, StockCharts.com
In this edition of StockCharts TV's Sector Spotlight, after last week's look at long-term trends on monthly charts, I focus on daily and weekly rotations as I see them in asset classes and sectors. In the asset class segment, developments in the bond markets play a...
READ MORE
MEMBERS ONLY
Watch for a Breakout Above Monday's Inside Day Chart Pattern
Monday mainly showed consolidation within the major indices. The Russell 2000 (IWM) spent most of its time within Friday's price range, along with the S&P 500 (SPY) and the Nasdaq 100 (QQQ) having inside day chart patterns. Along with the stock markets' inconclusive price action,...
READ MORE
MEMBERS ONLY

The Effect of this Bearish Weekly Two-Bar Reversal is About to Test the Bull Market Case for the Dollar Index
by Martin Pring,
President, Pring Research
Before we look at the two-bar reversal, let's first review the long-term technical position for the Dollar Index. It's laid out on a quarterly basis in Chart 1, along with a Coppock momentum indicator. The first thing to note is that the Index is positioned below...
READ MORE
MEMBERS ONLY
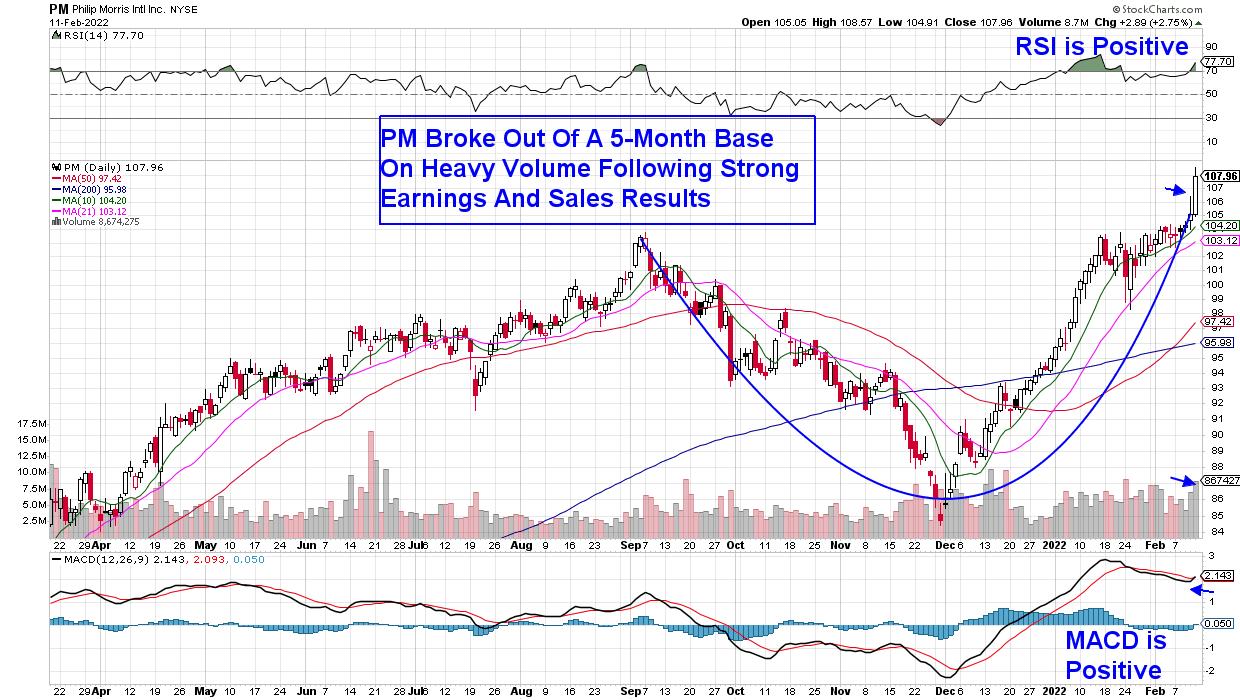
How Do Earnings and Relative Strength Correlate?
by Tom Bowley,
Chief Market Strategist, EarningsBeats.com
I receive dozens of earnings-related questions every quarter from EarningsBeats.com members and non-members alike. They usually revolve around whether "I should hold a stock into earnings?" Let me be clear that, as a short-term trader, I'd be very careful holding any stock into earnings. There...
READ MORE
MEMBERS ONLY
Week Ahead: NIFTY to See Defined Moves Over the Coming Days; RRG Chart Show This Sector Potentially Ending Its Relative Underperformance
by Milan Vaishnav,
Founder and Technical Analyst, EquityResearch.asia and ChartWizard.ae
After two weeks of corrective decline, the Indian equities tried to find a base for themselves, trading in a defined range and ending the week with some gains. The past five trading sessions remained as expected; the NIFTY has slipped below the 20-week MA and resisted to this level during...
READ MORE
MEMBERS ONLY

Don't Let The Market Makers Fool You
by Tom Bowley,
Chief Market Strategist, EarningsBeats.com
As a short-term trader, I've always studied the short-term intraday charts, looking for any possible advantage I can gain. One strategy the market makers employ during uptrends and downtrends is they show traders a morning mirage, which is then followed by afternoon reality. Not every day is alike,...
READ MORE
MEMBERS ONLY
Will We Go Higher From Here?
by Mary Ellen McGonagle,
President, MEM Investment Research
On this episode of StockCharts TV'sThe MEM Edge, Mary Ellen explains whether it's safe to get into these markets and which areas are best positioned as volatility remains high. She also reviews top stock candidates, as well as stocks holding up well after earnings.
This video...
READ MORE
MEMBERS ONLY
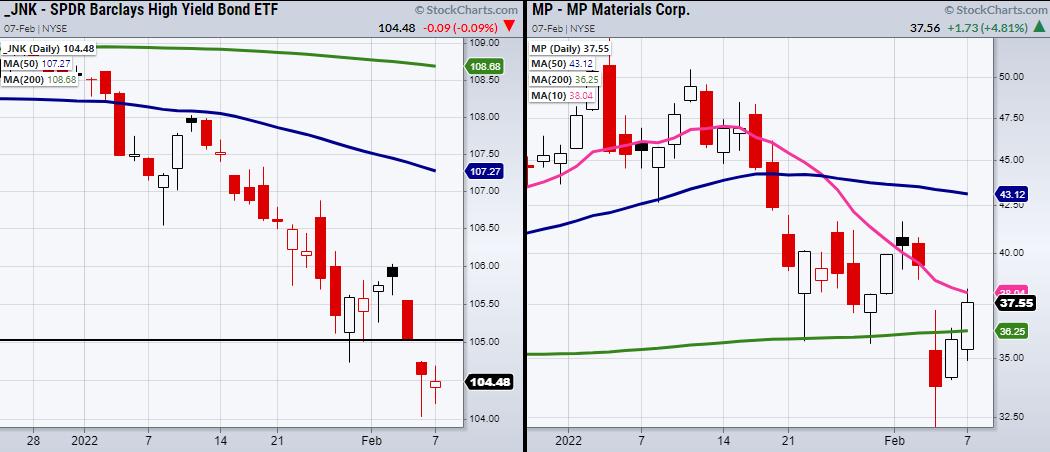
Why High Yield Corporate Debt (JNK) Needs to Fill the Gap
Friday ends on a positive note, with the Dow Jones (DIA) and the S&P 500 (SPY) holding over their 200-day moving averages. Alongside them, Bitcoin has cleared 40k and is currently looking for 41k next. However, High Yield Corporate Debt (JNK) gapped lower Friday, creating a key area...
READ MORE
