MEMBERS ONLY
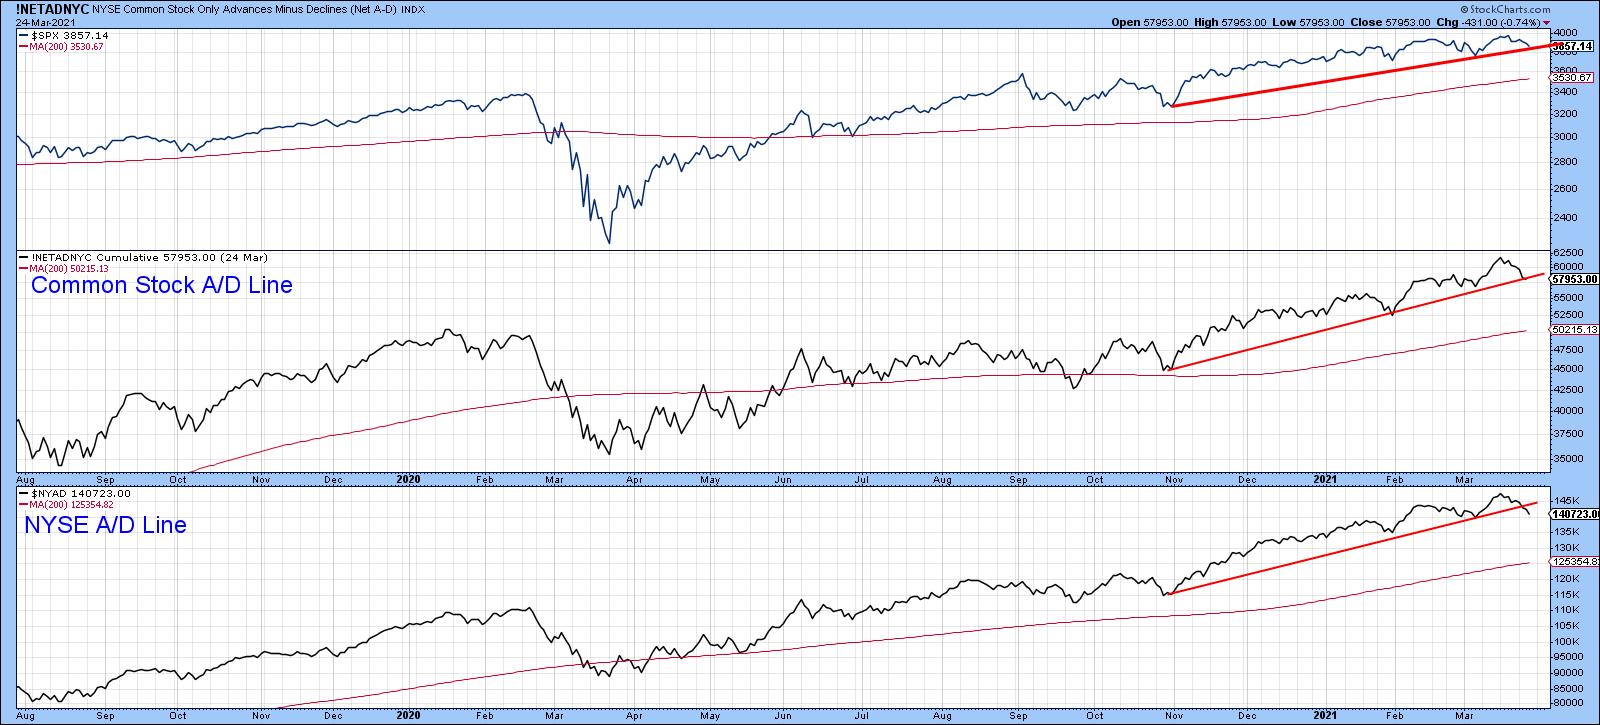
Several Key Indexes Testing Important Support

by Martin Pring,
President, Pring Research
It's never a good idea to try and predict contra-trend moves in a strong equity bull market, because the benefit of the doubt always goes with the prevailing trend. If false moves develop, they have a strong tendency to develop on the downside. That said, several key indexes...
READ MORE
MEMBERS ONLY
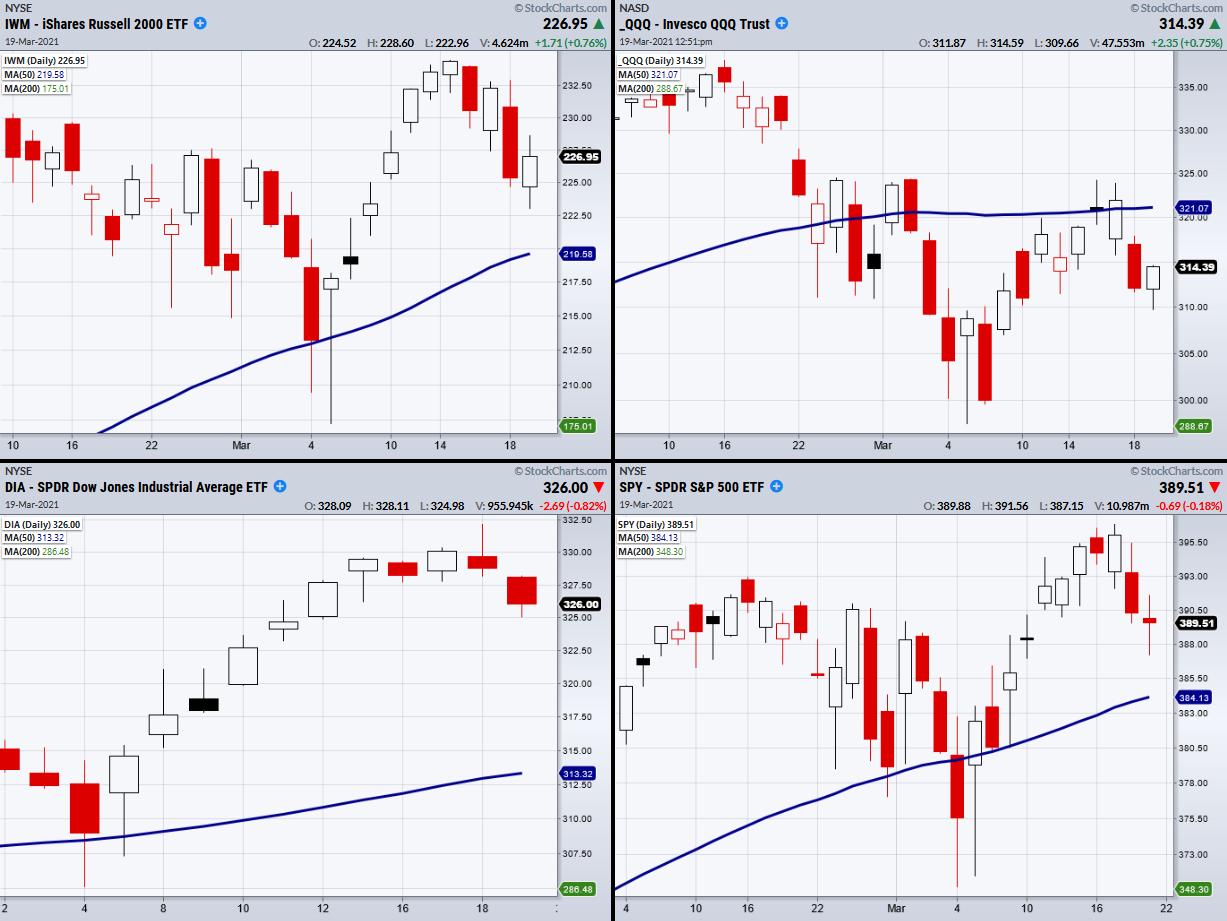
Are We in a Risk On or Off Environment?
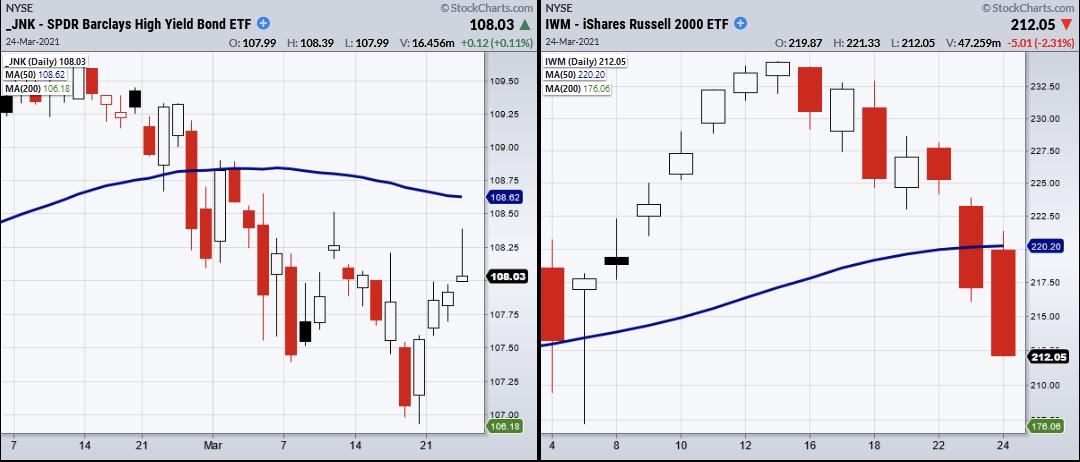
On Wednesday, the Russell 2000 (IWM) confirmed a cautionary phase change, with a second close under the 50-day moving average. A cautionary phase is defined by current price sitting under the 50-DMA, with the 50-DMA over the 200-DMA. Both IWM and Nasdaq 100 (QQQ) are in cautionary phases. This is...
READ MORE
MEMBERS ONLY

DecisionPoint ALERT: The 10-Year and 30-Year Yields Break Support

by Carl Swenlin,
President and Founder, DecisionPoint.com
Flying has been described by pilots as being hours of boredom punctuated by seconds of sheer terror. Attention to detail during the boring hours can possibly reduce the number of terrifying seconds one may be forced to endure. Market analysis requires the same attention to detail, scanning the same set...
READ MORE
MEMBERS ONLY

If I Can Do It, So Can You! (Part 3)

by Dave Landry,
Founder, Sentive Trading, LLC
In this edition of Trading Simplified, Dave continues his discussion "If I Can Do It, So Can You" and shows you some simple things he does and how he does them. This includes "Letting The Ebb & Flow Control Your Portfolio." Also, Dave shows some new...
READ MORE
MEMBERS ONLY

NASDAQ AND TECH STOCKS REMAIN ON THE DEFENSIVE -- SEMICONDUCTOR ETF REMAINS BELOW 50-DAY LINE -- SMALL CAPS WEAKEN

by John Murphy,
Chief Technical Analyst, StockCharts.com
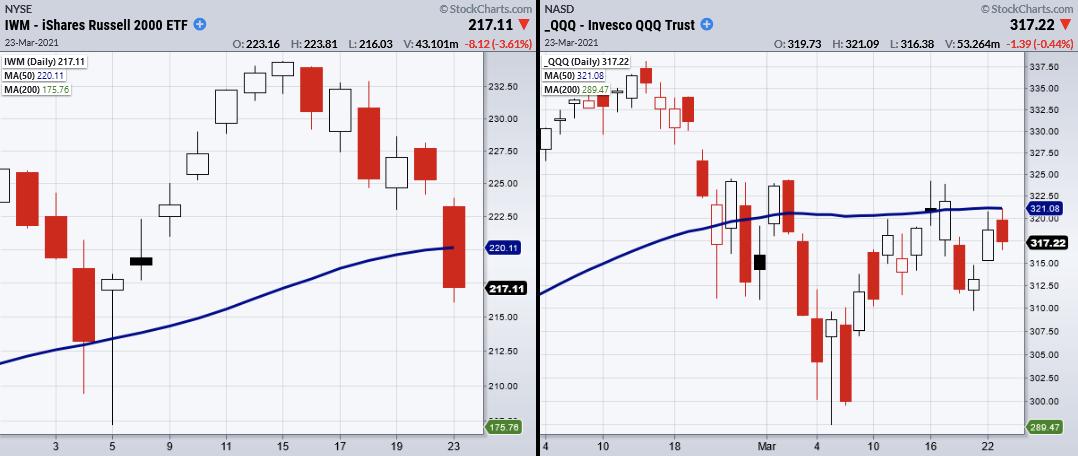
THE NASDAQ MARKET REMAINS ON THE DEFENSIVE...The Nasdaq market remains on the defensive. Chart 1 shows the Invesco QQQ Trust meeting resistance at its 50-day average. That's mainly because of weaker tech stocks. Chart 2 shows the Technology SPDR (XLK) trading below its 50-day line as well....
READ MORE
MEMBERS ONLY

Taking FB and FCX from The RRG L/S Basket

by Julius de Kempenaer,
Senior Technical Analyst, StockCharts.com
The two RRGs above show the long positions in the RRG L/S basket on the left and the short positions on the right. Going over these rotations, combined with the recent performance (dropping around 4% in a few days), two tails stood out.
On the long side, we have...
READ MORE
MEMBERS ONLY

Sector Spotlight: Rising Real Estate
by Julius de Kempenaer,
Senior Technical Analyst, StockCharts.com
Last week, I spent a lot of time on answering a question from the mailbag. This week is all about charts!
In this edition of StockCharts TV's Sector Spotlight, I starting with a look back at the rotations as they unfolded in various asset classes and US sectors....
READ MORE
MEMBERS ONLY
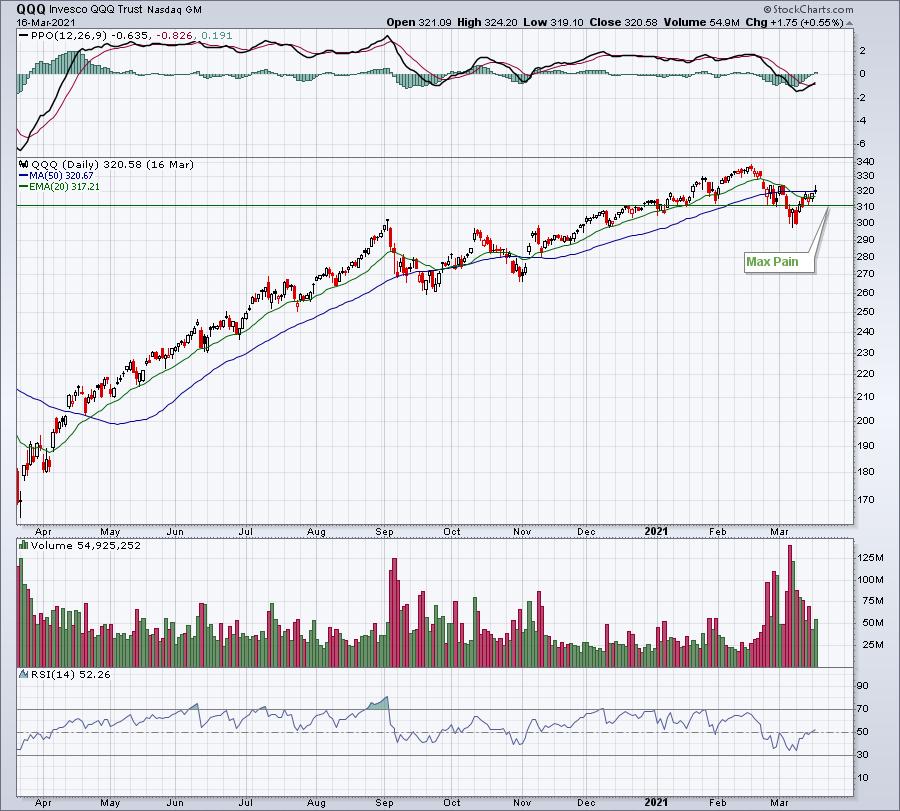
Why the Russell 2000 & Nasdaq 100 Had the Largest Market Impact
On Tuesday, the Nasdaq 100 (QQQ) came close to clearing the 50-day moving average at $321.08. This was the second attempt to clear this moving average, with the first attempt happening last week. Though the QQQs were unable to hold over the 50-DMA, they were able to hold over...
READ MORE
MEMBERS ONLY
Real Nice Stocks in the Real Estate Sector
by Julius de Kempenaer,
Senior Technical Analyst, StockCharts.com
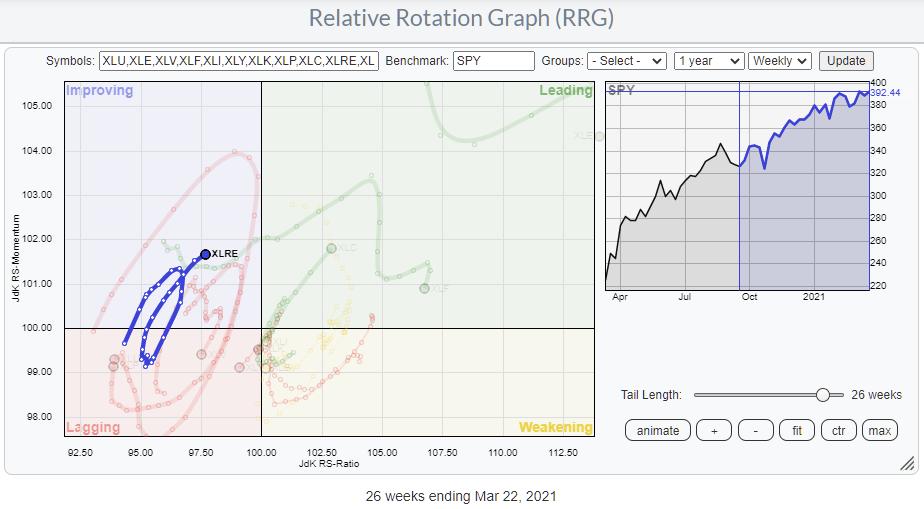
Every last Tuesday of the month in Sector Spotlight, I review the seasonality for US sectors and try to match the historical performance with the current performance as it is playing out on the Relative Rotation Graph.
For March (see episode 68, "Seasonal Surprise for XLRE"), the Real...
READ MORE
MEMBERS ONLY
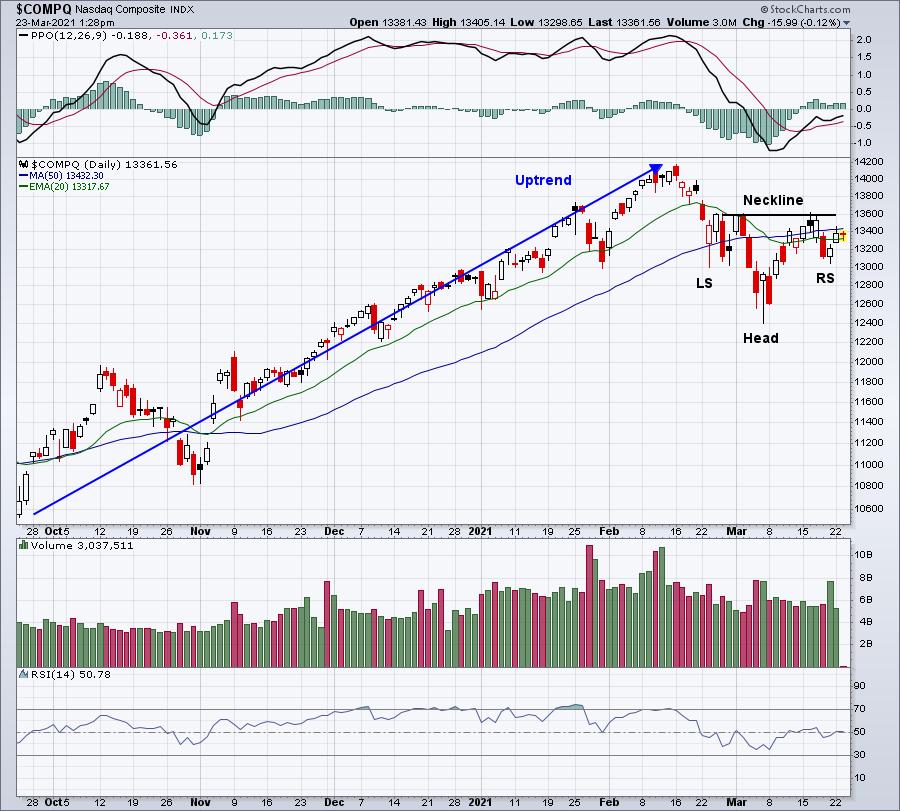
NASDAQ Prepping For Continuation Breakout?

by Tom Bowley,
Chief Market Strategist, EarningsBeats.com
The NASDAQ has been the unwanted third wheel the past month or so as the Dow Jones has moved above 32000 and 33000 and the S&P 500 has approached 4000. Of course, it's all about perspective and the NASDAQ has been the leader since the pandemic...
READ MORE
MEMBERS ONLY
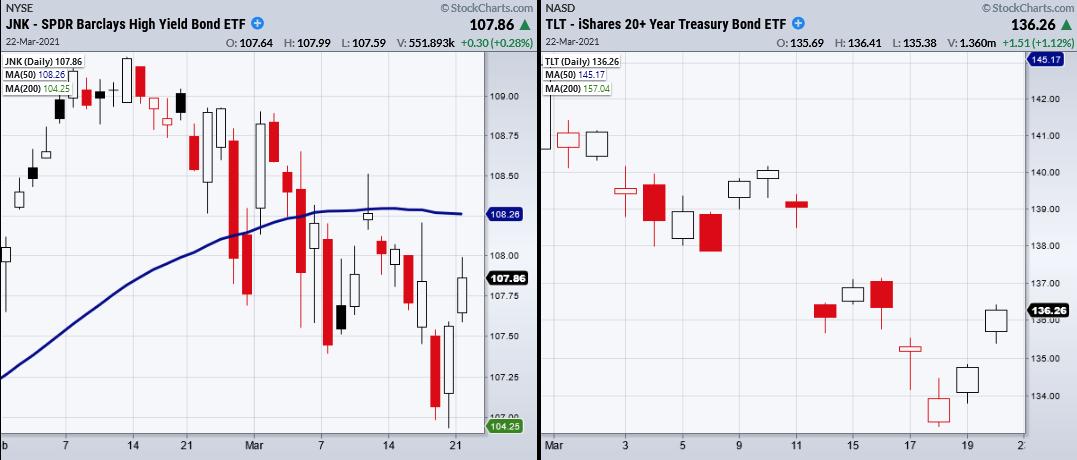
Should We Be Worried About Bond Yields Increasing?
Last week, increasing bond yields had the market worried. Come Monday, the 20+ year treasury bond ETF (TLT) gapped higher and ended the day up 1.12%. This fared especially well for growth stocks as the Nasdaq 100 (QQQ) tests resistance from the 50-day moving average.
But what was the...
READ MORE
MEMBERS ONLY
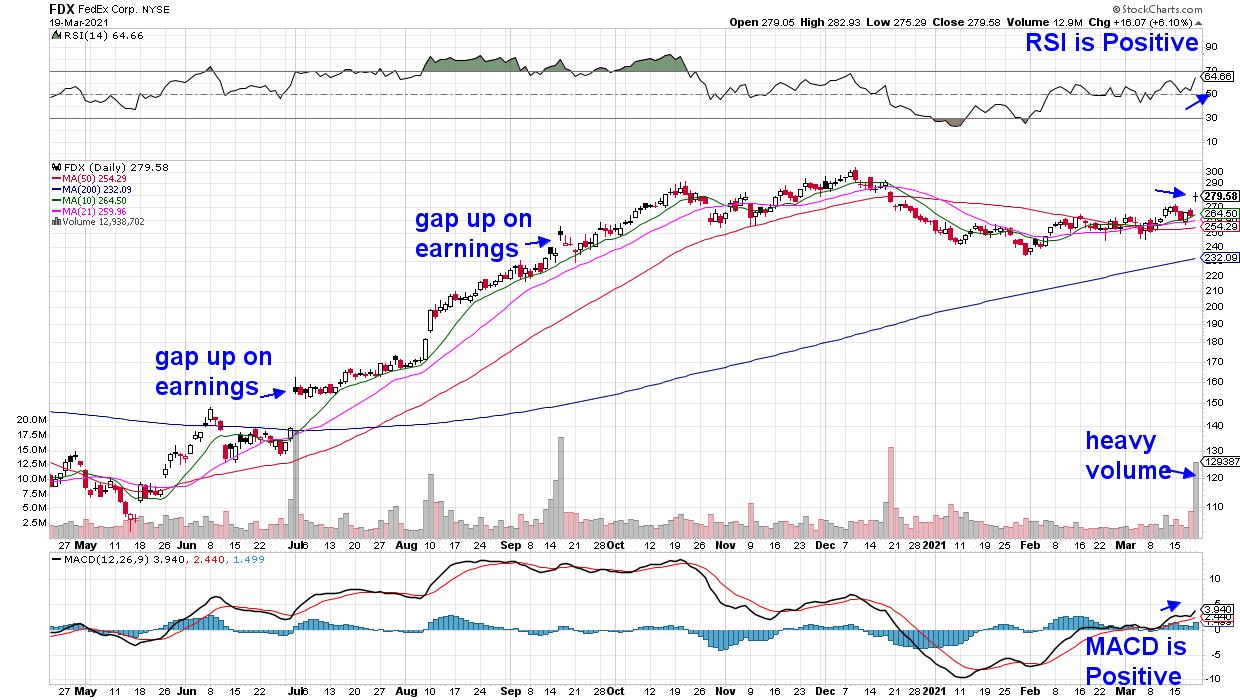
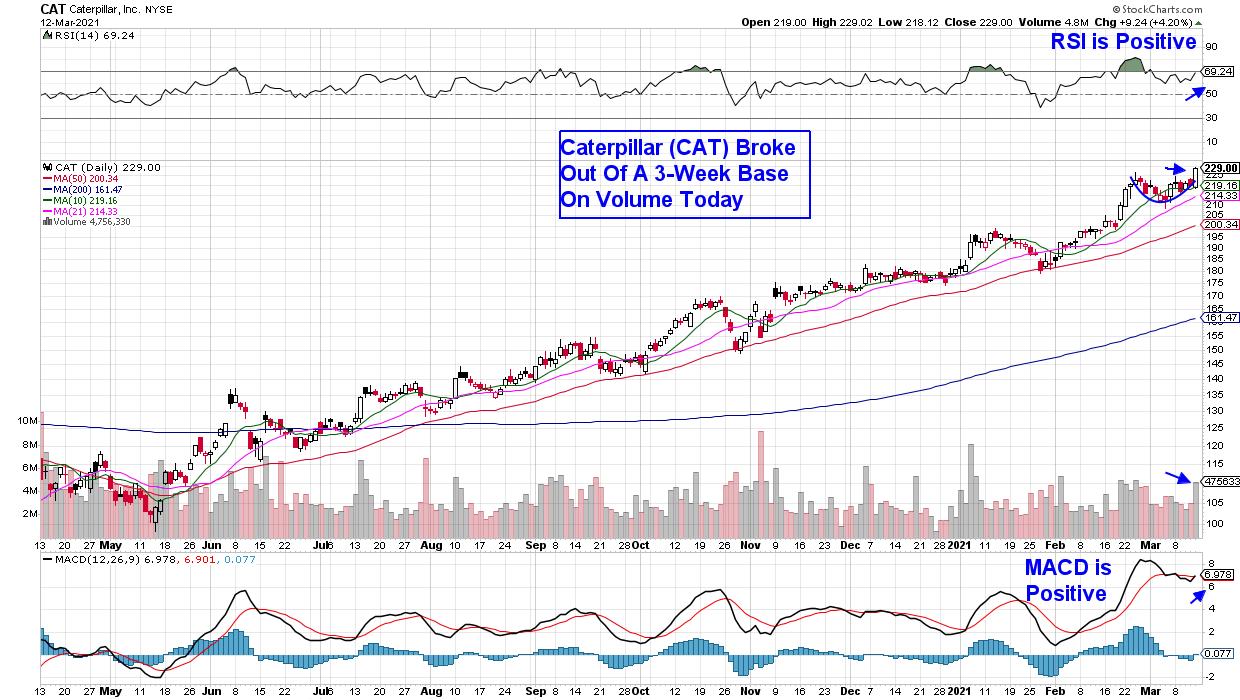
This Household Name Just Had a Bullish Gap-Up on Heavy Volume

by Mary Ellen McGonagle,
President, MEM Investment Research
While the markets were being pushed around last week amid surging interest rates and mixed economic data, a well-known delivery company gapped up in price Friday on very heavy volume. This breakaway gap is a classic breakout that often leads to further upside.
DAILY CHART OF FEDEX CORP. (FDX)
Typically,...
READ MORE
MEMBERS ONLY
Options Expiration Inspires March Madness In Equities
by Tom Bowley,
Chief Market Strategist, EarningsBeats.com
From a short-term trading perspective, options expiration presents a host of opportunities. The market makers were at it again this week, looking under every seat cushion for a few extra bucks. The key is to beat them to the seat cushion. Let's rewind to our EarningsBeats.com March...
READ MORE
MEMBERS ONLY

Week Ahead: NIFTY May Extend Technical Pullback to a Limited Extent; RRG Charts Show These Sectors May Stay Resilient

by Milan Vaishnav,
Founder and Technical Analyst, EquityResearch.asia and ChartWizard.ae
After being heavily spooked by rising bond yields and strengthening the US dollar in consequence, the Indian equity markets remained weak throughout the week, barring the last day where it saw some technical rebound from the short-term oversold levels. The NIFTY moved in a wide 700-point range and, if looked...
READ MORE
MEMBERS ONLY
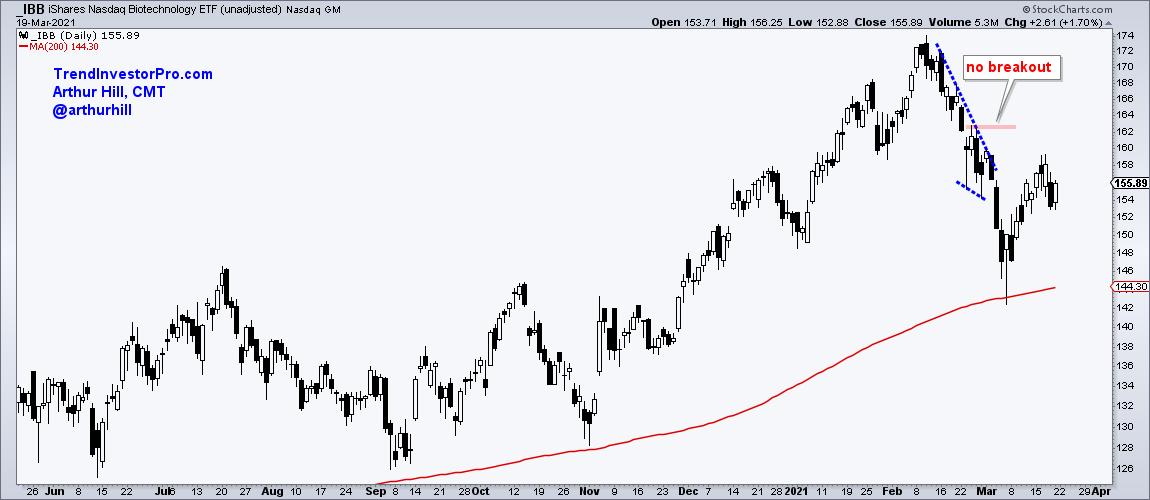
IBB: Still a Correction within a Bigger Uptrend

by Arthur Hill,
Chief Technical Strategist, TrendInvestorPro.com
I wrote about the Biotech ETF (IBB) on February 28th as it pulled back from a new high. The pullback was viewed as a correction within the bigger uptrend, but the correction extended further than expected. At the time, I drew a falling wedge on the chart and marked resistance...
READ MORE
MEMBERS ONLY
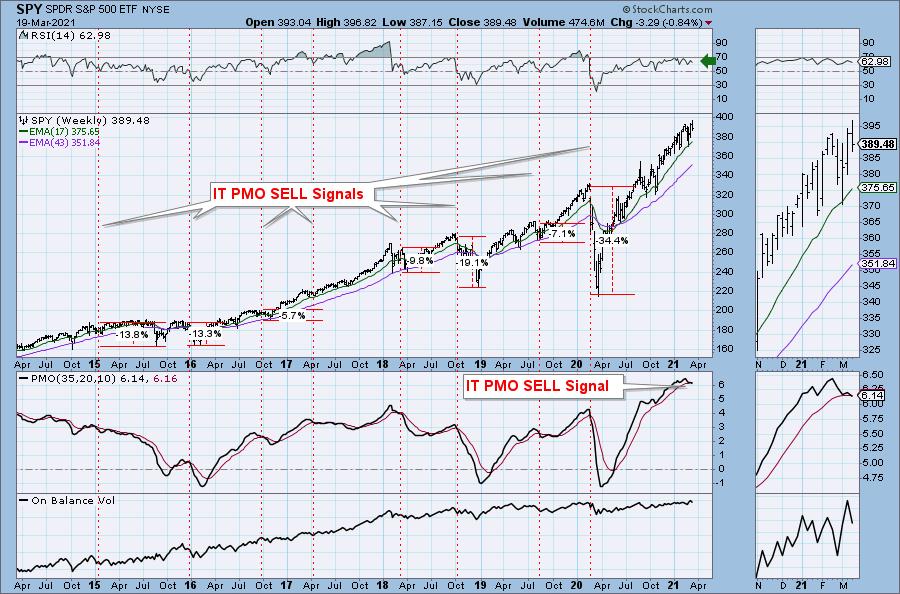
Intermediate-Term Price Momentum Oscillator (PMO) SELL Signal on SPY

by Erin Swenlin,
Vice President, DecisionPoint.com
Today, the weekly PMO crossed below its signal line, which hasn't occurred since the early 2020 bull market top. The chart isn't all bad given the positive RSI and rising OBV. However, this signal should be heeded; they don't happen often and they usually...
READ MORE
MEMBERS ONLY
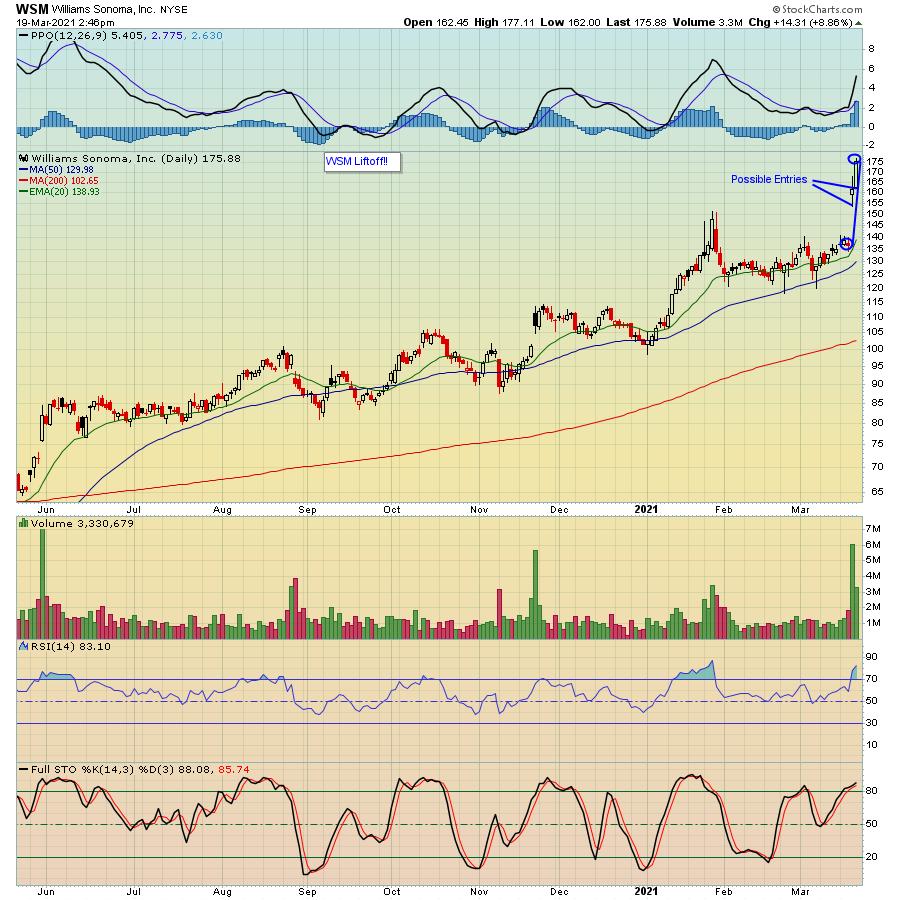
This Company Smashed Earnings Expectations

by John Hopkins,
President and Co-founder, EarningsBeats.com
Williams Sonoma, Inc (WSM) reported their earnings this past week and proved that, even in a choppy market environment, strong earnings can be rewarded. In fact, look at the chart below, which shows the stock spiking a nifty 30% in just two days as traders cheered their performance.
WSM had...
READ MORE
MEMBERS ONLY

Full Steam Ahead for These Stocks!
by Mary Ellen McGonagle,
President, MEM Investment Research
In this episode of StockCharts TV'sThe MEM Edge, Mary Ellen reviews newer areas that are under accumulation as corporate spending is picking up. She also shares attractive stocks within those groups. High inflation and stocks that benefit are also discussed.
This video was originally recorded on March 19th,...
READ MORE
MEMBERS ONLY
When to Trade and When to Do Nothing
The easy answer to this question is if you do not know what to do, you should probably do nothing. But it gets more complicated if you do not know why you should be doing nothing. No one likes to feel as though they are missing out on profits by...
READ MORE
MEMBERS ONLY
Chartwise Women: Strength Within a Weak Market
by Mary Ellen McGonagle,
President, MEM Investment Research
by Erin Swenlin,
Vice President, DecisionPoint.com
In this week's edition of Chartwise Women, Mary Ellen and Erin share ways to easily capture areas of relative outperformance with an eye toward continued upside. They also present their favorite groups, as well as individual stocks, following a review of the broader markets.
This video was originally...
READ MORE
MEMBERS ONLY

10-YEAR YIELD JUMPS TO 14-MONTH HIGH -- WEAK TECH STOCKS WEIGH ON REST OF MARKET -- QQQ LOSES ITS 50-DAY AVERAGE
by John Murphy,
Chief Technical Analyst, StockCharts.com
10-YEAR YIELD SPIKES HIGER... Bond yields continue to spike higher. Chart 1 shows the 10-Year Treasury yield jumping 9 basis points to 1.73% which is the highest level in fourteen months. That's helping lift financial shares, but weighing heavily on technology stocks. As a result, the Nasdaq...
READ MORE
MEMBERS ONLY
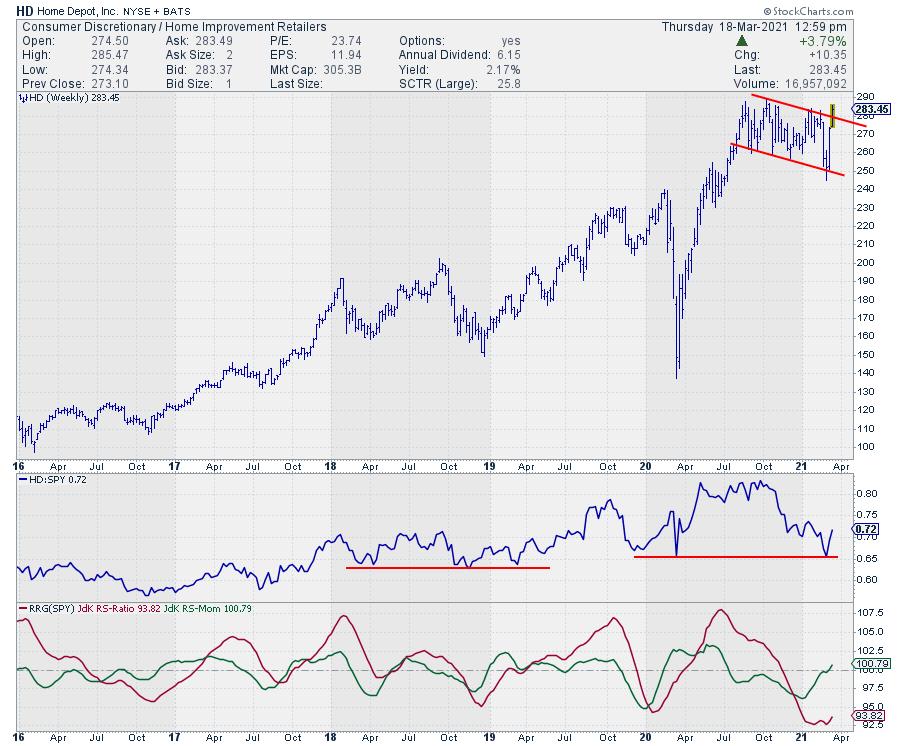
HD Popping From Consolidation and TRV Pushing to New High
by Julius de Kempenaer,
Senior Technical Analyst, StockCharts.com
I started at the Market movers (%up) widget for Dow Jones stocks on my dashboard for today's chart(s). When I requested the RRG for these ten stocks, the RRG below showed up.
These then stocks are all moving higher today, but their relative trends differ significantly, as...
READ MORE
MEMBERS ONLY

My Special Inflationary Indicator
On Wednesday, the Federal Reserve stated that interest rates will continue to stay close to zero, along with a new estimate for the unemployment rate down to 4.5% instead of 5% for the year. Additionally, the GDP estimate was revised to +6.5% from +4.2% for 2021.
Many...
READ MORE
MEMBERS ONLY

STOCKS REBOUND ON DOVISH FED STANCE -- CONSUMER DISCRETIONARY LOOKS STRONGER -- HOMEBUILDERS HIT NEW RECORDS
by John Murphy,
Chief Technical Analyst, StockCharts.com
MARKETS REBOUND... Stocks rebounded following today's dovish Fed statement. In addition, the 10-Year Treasury yield pared some of its earlier gains. Charts 1 and 2 show the Dow and S&P 500 touching new records. Chart 3 shows the Nasdaq Composite trading back above its 50-day moving...
READ MORE
MEMBERS ONLY

Keeping It Simple
by Carl Swenlin,
President and Founder, DecisionPoint.com
There are a lot of people worrying about a major market top, and there are just as many (mostly in the fundamental camp) confident that we're on the verge of another major up leg. We can see the logic of both positions, so how can we sort it...
READ MORE
MEMBERS ONLY
It Pays to Listen When the Database Speaks
by Dave Landry,
Founder, Sentive Trading, LLC
In this edition of Trading Simplified, Dave brings more lessons with the market update. He continues his series "If I Can Do It" with establishing Free Positions and the discussion "Listening to the Database." Dave also presents a Mystery Chart Follow-Up, then brings 3 new Mystery...
READ MORE
MEMBERS ONLY
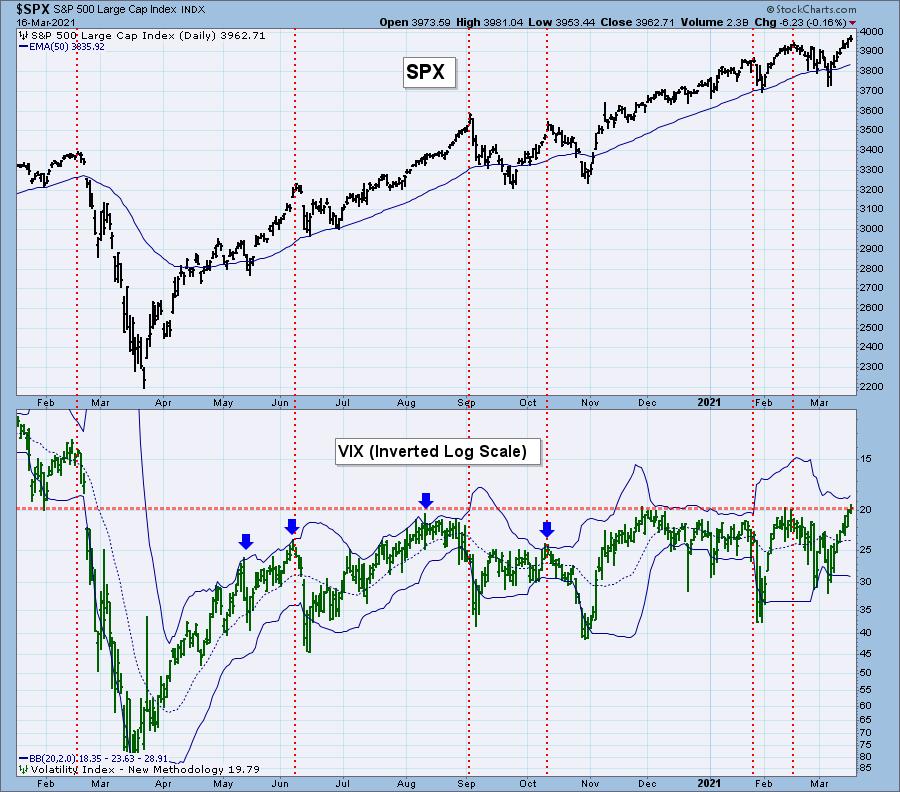
VIX Closes at Lowest Reading Since Beginning of Bear Market Decline!
by Erin Swenlin,
Vice President, DecisionPoint.com
We knew that the VIX readings were sliding lower, but today it finished at 19.79. The VIX has not closed below 20 since the 2020 bull market top.
We invert our VIX because we view the VIX as a sentiment indicator. Sentiment is contrarian, so in order to have...
READ MORE
MEMBERS ONLY
Sector Spotlight: A Scan and a Trading Plan
by Julius de Kempenaer,
Senior Technical Analyst, StockCharts.com
In this edition of StockCharts TV's Sector Spotlight, I begin with a quick look at last week's rotations in asset classes and sectors. Then, I look into the RRG mailbag and present in-depth discussion of a recent 3-part question that came in. All three elements that...
READ MORE
MEMBERS ONLY

Consumer Discretionary Sector Rotating Back Towards Leading; the Equal Weight Sector, That Is...
by Julius de Kempenaer,
Senior Technical Analyst, StockCharts.com
The Equal Weight version of the Relative Rotation Graph for US sectors shows an interesting divergence in rotation for the Consumer Discretionary sector.
Two weeks ago, 3/2, I showed the RRG for small-cap sectors and analyzed the discrepancies between the small-cap and the large-cap sector rotations. Here also, the...
READ MORE
MEMBERS ONLY

The Chart You Need to Stay Bullish

by David Keller,
President and Chief Strategist, Sierra Alpha Research
I have learned over my career to be skeptical. I have learned to question my investment thesis and actively argue the other side of any position to challenge my own analysis. I have learned to actively search out people that disagree with me and try to see what they are...
READ MORE
MEMBERS ONLY

DP TV: Silver Cross Index WARNING SIGN!
by Erin Swenlin,
Vice President, DecisionPoint.com
by Carl Swenlin,
President and Founder, DecisionPoint.com
In this episode of DecisionPoint, Carl and Erin give us a complete market overview, including Dollar, Gold, Gold Miners, Crude Oil and Bonds. Carl specifically addresses problems in crypto right now, as well as a review of valuations as they continue to get more and more overbought. Erin tells you...
READ MORE
MEMBERS ONLY
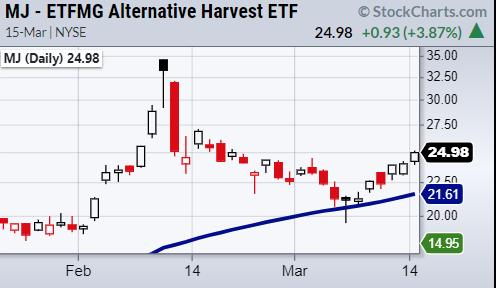
Is the Cannabis Sector Primed for a Move Up?
Cannabis has seen a huge increase this year as the Biden administration took office. Though it is not completely clear if the Federal government will push for widespread legalization, its last bill to further decriminalize cannabis makes it easier for states to push their own legalization agendas. With 11 states...
READ MORE
MEMBERS ONLY

The Idea of Rising Bond Yields May be Getting Too Popular
by Martin Pring,
President, Pring Research
The longer-term indicators have been bullish on bond yields (bearish on prices) for a while now. However, they are now being joined by a number of commentators offering a similar view, which makes me uncomfortable. Don't get me wrong, the indicators are still pointing to a primary yield...
READ MORE
MEMBERS ONLY

Transportation (IYT) and Retail (XRT) Lead the Market Higher
Recently, we talked about Transportation (IYT) and Retail (XRT) sectors as indicators for market strength/weakness. Transportation shows the movement of goods and travel expectations, while retail shows the consumer sentiment side. Both help us understand investor expectations of the economy reopening and therefore help us understand if we are...
READ MORE
MEMBERS ONLY

2 Breakouts That Could Provide Tremendous Upside
by Tom Bowley,
Chief Market Strategist, EarningsBeats.com
We've been in a solid secular bull market for years, but the past couple years have been difficult for sure. Still, we've seen plenty of stocks breaking out over and over again (ie, autos, renewable energy, etc.). But not all stocks have participated, even those in...
READ MORE
MEMBERS ONLY

Applying Multiple Timeframe Analysis to the Healthcare SPDR
by Arthur Hill,
Chief Technical Strategist, TrendInvestorPro.com
As its name suggests, multiple timeframe analysis looks at two or more timeframes to find a setup. Typically, the longer timeframe is used to define the long-term trend and set the trading bias. The shorter timeframe is then used to find setups in harmony with the bigger trend. Nothing is...
READ MORE
MEMBERS ONLY

Week Ahead: NIFTY to Stay Broadly Range-Bound; RRG Looks at These Sectors for Resilient Show
by Milan Vaishnav,
Founder and Technical Analyst, EquityResearch.asia and ChartWizard.ae
In a truncated week, the Indian equities failed to take any directional cues and traded all over the places over for four trading sessions, before ultimately ending the week with a modest gain. The start of the week stayed volatile, with the NIFTY trading in a wide range. However, the...
READ MORE
MEMBERS ONLY
Here's the Top Stock in This Red Hot Index!
by Mary Ellen McGonagle,
President, MEM Investment Research
The Dow Jones Industrial Average powered to its fifth consecutive record high today as investors bought shares of companies that'll benefit from a strong reopening of the U.S. economy. Rising yields have also triggered the recent rotation away from growth-oriented stocks, including large-cap tech-related shares, into more...
READ MORE
MEMBERS ONLY
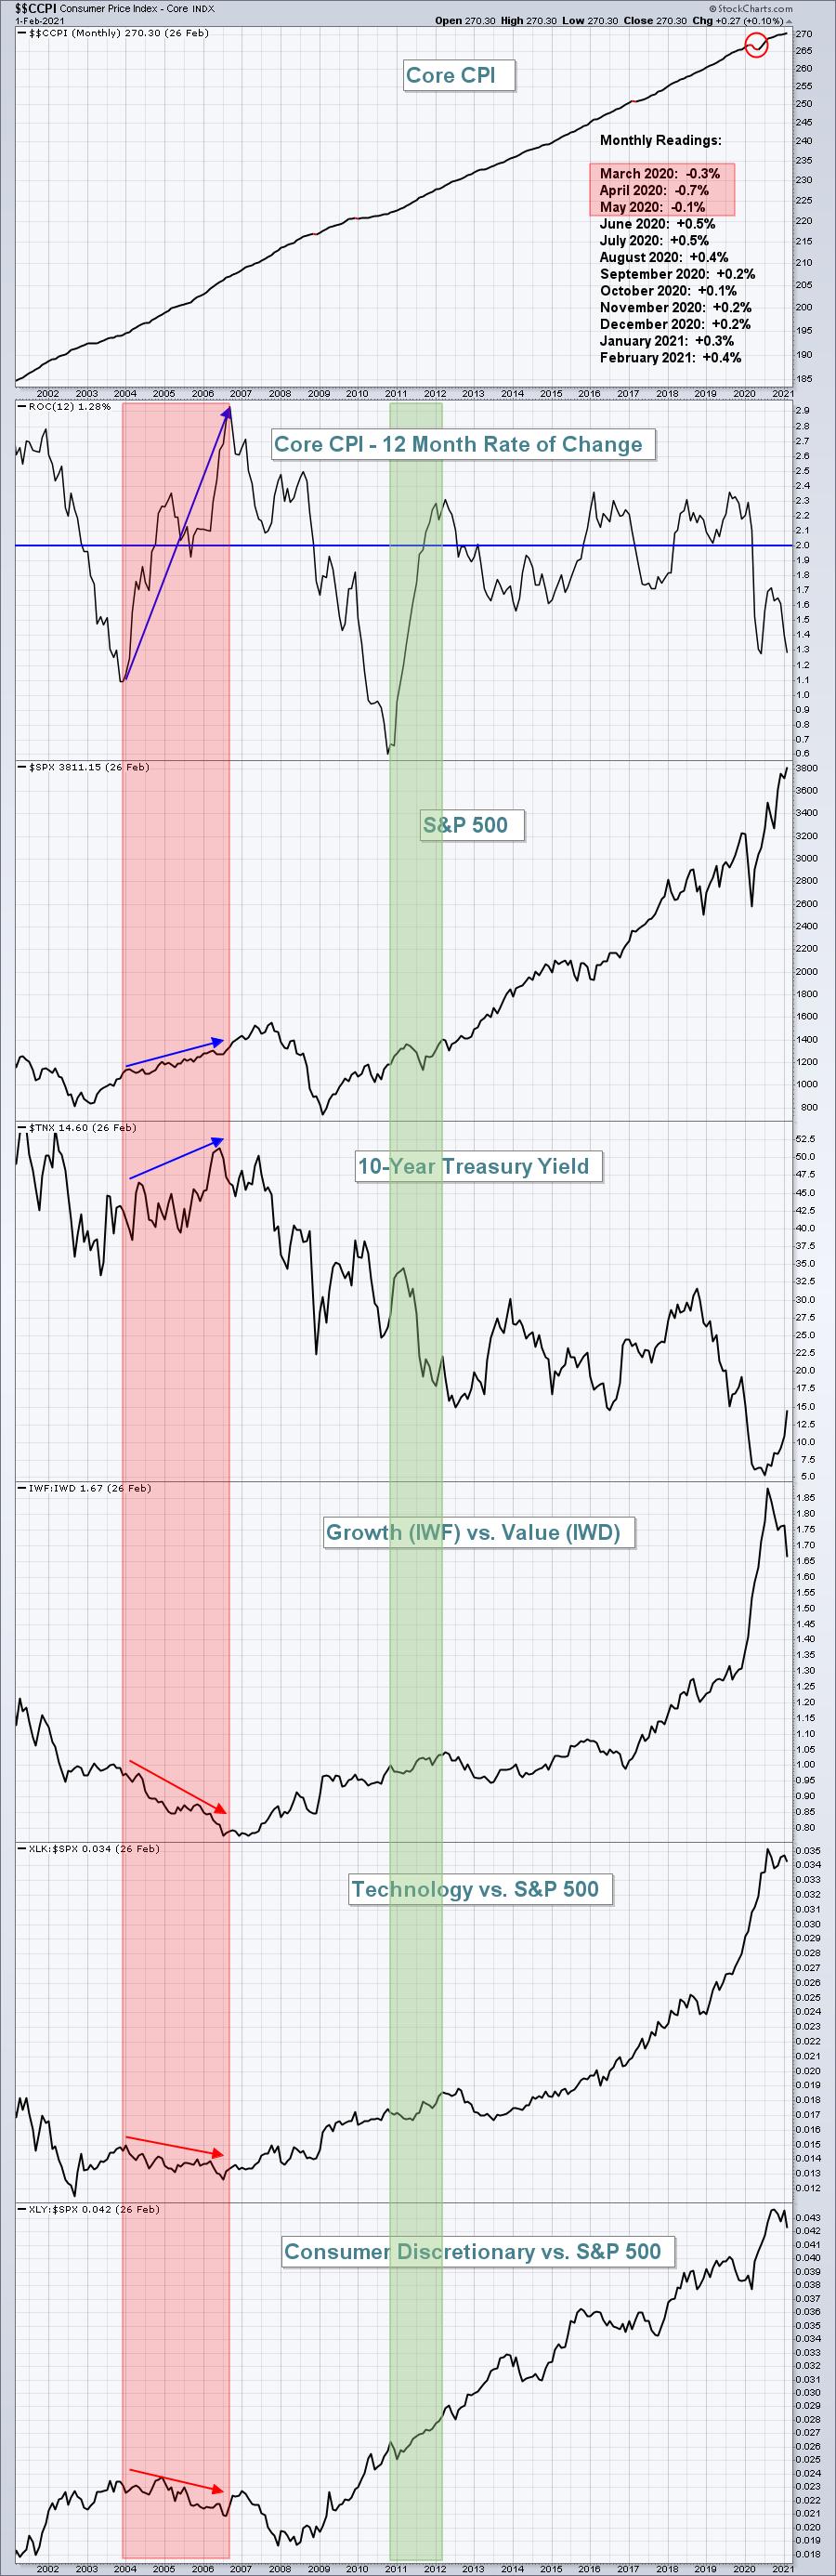
Rising Inflation: It's Coming, But What Impact Will It Have on US Equities?
by Tom Bowley,
Chief Market Strategist, EarningsBeats.com
At the time of my last ChartWatchers article two weeks ago, the 10-year treasury yield ($TNX) had just closed at 1.46% after reaching an intra-week high at 1.61%. Well, we didn't stop there. The TNX had a big day on Friday, gaining nearly 11 basis points...
READ MORE
MEMBERS ONLY
The Chart You Need to Stay Bullish
by David Keller,
President and Chief Strategist, Sierra Alpha Research
I have learned over my career to be skeptical. I have learned to question my investment thesis and actively argue the other side of any position to challenge my own analysis. I have learned to actively search out people that disagree with me and try to see what they are...
READ MORE
