MEMBERS ONLY

Short Term Rotations Put XLC and XLK Back in Favor Again on Relative Rotation Graph

by Julius de Kempenaer,
Senior Technical Analyst, StockCharts.com
The erratic rotations that we discussed last week are still ongoing. Looking back at the rotational action on the RRG for US sectors last week shows that the focus of investors is shifting back to Technology and Communication Services again.
Despite being inside the lagging quadrant, XLK showed the strongest...
READ MORE
MEMBERS ONLY

MAJOR STOCK INDEXES TRADE ABOVE THEIR 50-DAY AVERAGES -- ALL ELEVEN SECTORS ARE IN THE GREEN -- SMALL CAPS AND TRANSPORTS ARE STRONG

by John Murphy,
Chief Technical Analyst, StockCharts.com
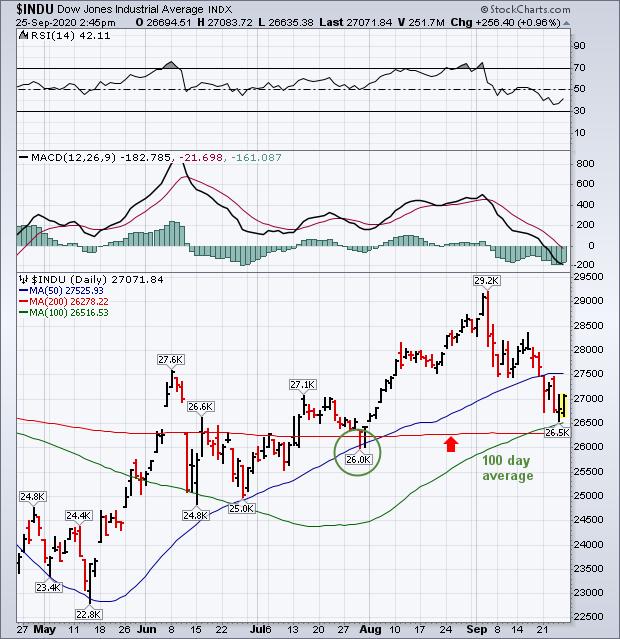
STOCK INDEXES REGAIN THEIR 50-DAY LINES... Global stocks are starting the week on a strong note. The three major stock indexes shown below are all trading above their 50-day moving average lines. That strengthens their short-term trend and puts them in position to regain some ground lost during the month...
READ MORE
MEMBERS ONLY

2 Equity ETFs Holding Up Well in September

by Arthur Hill,
Chief Technical Strategist, TrendInvestorPro.com
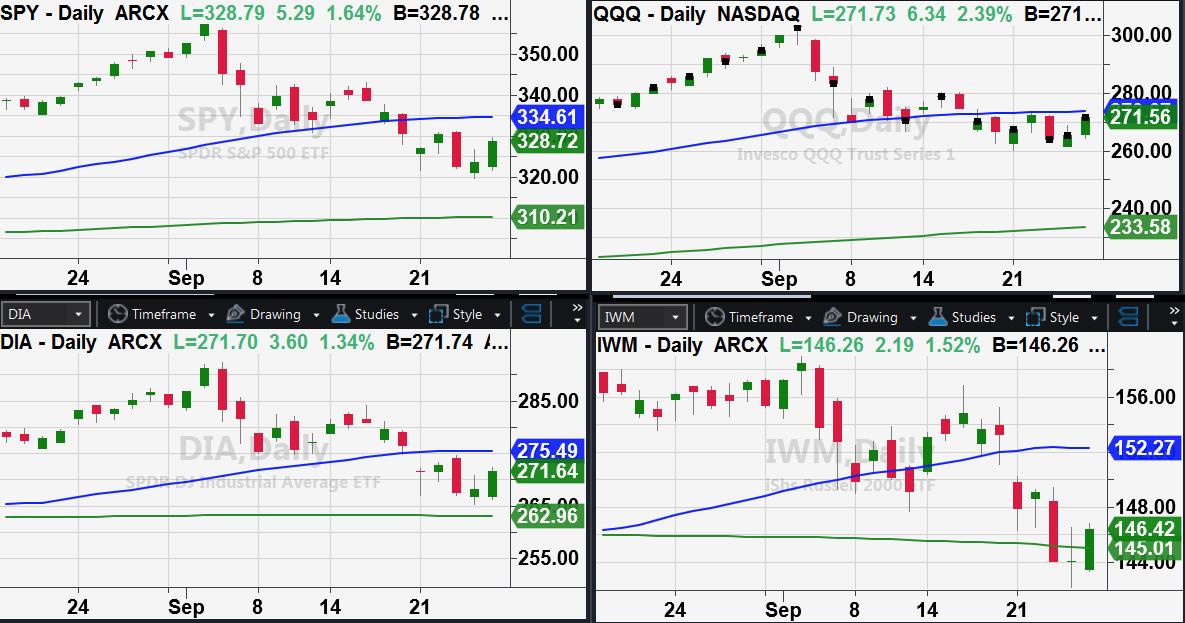
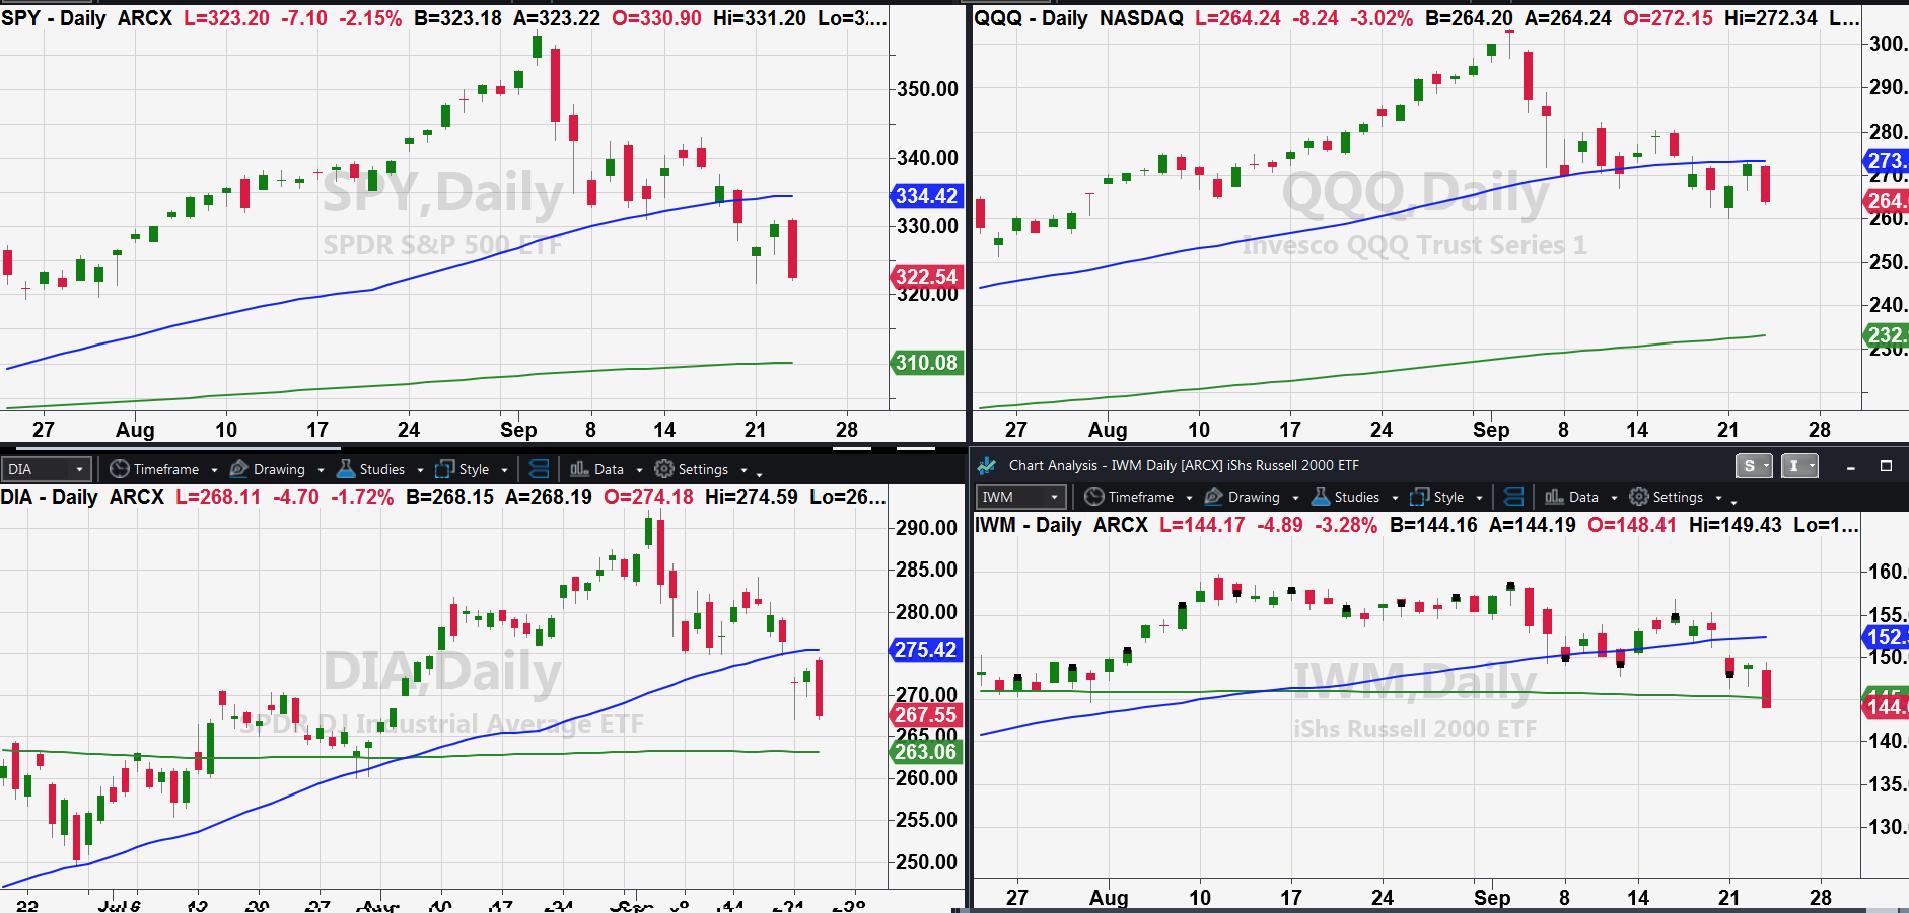
The S&P 500 SPDR is down around 6% this month and QQQ is down around 8%. These two hit new highs on September 2nd, plunged the next three trading days and then worked their way lower. Both are below their 50-day moving averages for the first time since...
READ MORE
MEMBERS ONLY

Bullish Rotation Suggesting Bottom Is In; 2 Downtrend Reversal Candidates

by Tom Bowley,
Chief Market Strategist, EarningsBeats.com
Note
First, just over one year ago, I returned to EarningsBeats.com as its Chief Market Strategist. I want to thank all of you that have supported me in my return. I think we've weathered a brutal year in great fashion. Here are the one year returns on...
READ MORE
MEMBERS ONLY

Crucial Week Ahead: NIFTY Set to Deal with Multiple Important Technical Setups; RRG Chart Points Towards Sector-Specific Moves

by Milan Vaishnav,
Founder and Technical Analyst, EquityResearch.asia and ChartWizard.ae
Unlike the previous week that had stayed uneventful for the markets, the Indian equities witnessed an immensely volatile week that ended this Friday, September 25, 2020. The markets saw a good start to the week, but the second half of the week stayed terribly volatile, with the markets ending with...
READ MORE
MEMBERS ONLY
Applying Moving Averages to the Three Major Stock Indexes
by John Murphy,
Chief Technical Analyst, StockCharts.com
A lot more attention is being paid to moving average lines this month because they help determine where potential support and resistance levels may lie. Two that have been mentioned quite a bit lately are the 50- and 200-day averages. Moves above and below the 50-day lines help determine the...
READ MORE
MEMBERS ONLY
This Red-Hot Area Doesn't Care What's Going On In The Rest Of The Markets

by Mary Ellen McGonagle,
President, MEM Investment Research
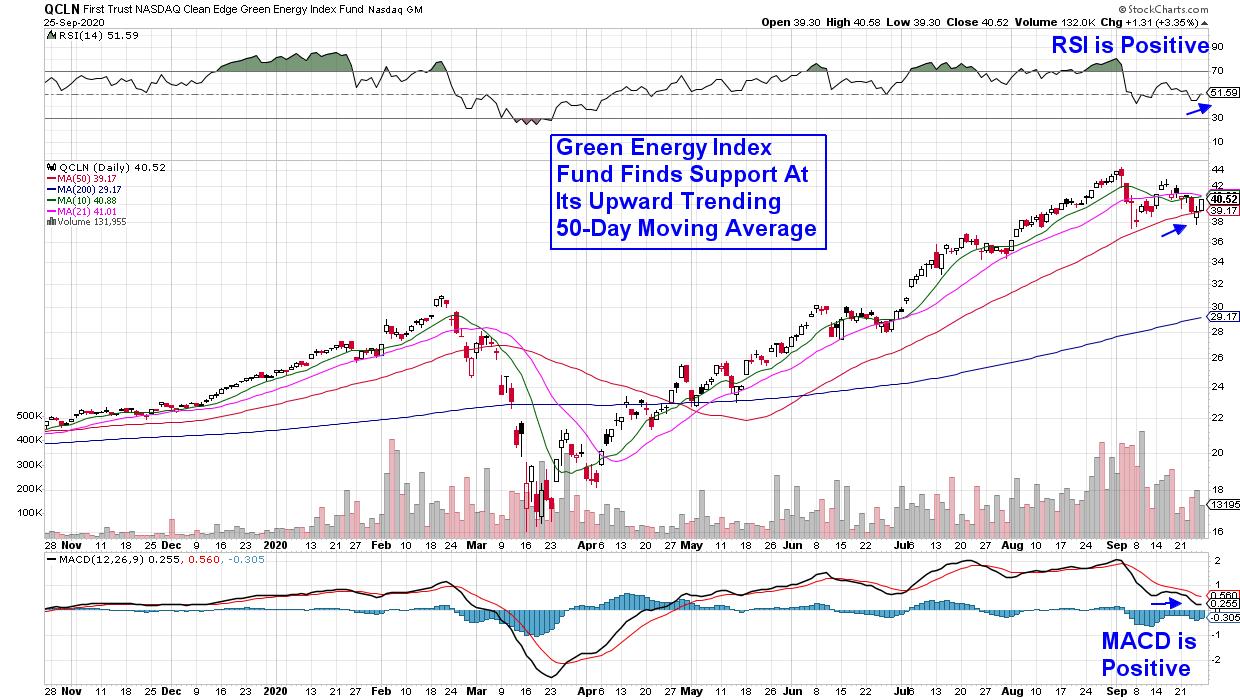
While economic worries have brought the S&P 500 to the brink of a correction this week (defined as a loss of 10% or more from its 52-week high), there's been one area of the market that's holding in remarkably well with several stocks at...
READ MORE
MEMBERS ONLY

Better Routines Lead to Better Results

by David Keller,
President and Chief Strategist, Sierra Alpha Research
A consistent imperfect routine is way better than an inconsistent perfect routine.
When I've worked with investors that are new to technical analysis, I often find that they spend too much time trying to perfect their analytical approach on a particular chart, and way too little time determining...
READ MORE
MEMBERS ONLY
Buy on Rumor? I'm Expecting A BIG Pre-Earnings Surge in These 3 Stocks
by Tom Bowley,
Chief Market Strategist, EarningsBeats.com
Ever heard of the old Wall Street adage, "buy on rumor, sell on news"? You most likely have and, in my opinion, it applies more to earnings season than anything else. Wall Street firms send their analysts out to meet with management teams prior to the end of...
READ MORE
MEMBERS ONLY
Market Indices Phased and Confused
Coming into the weekend, we have more time to look over our charts, gather our thoughts and take a step back to grasp the larger picture. So, let's get right to it!
From bullish to caution. This is the current phase the major indices have recently switched to....
READ MORE
MEMBERS ONLY

Leadership Areas for the Next Leg Up
by Mary Ellen McGonagle,
President, MEM Investment Research
In this episode of StockCharts TV'sThe MEM Edge, Mary Ellen looks at turnaround candidates as the markets begin to stabilize, as well as stocks that are breaking out to new highs. Also, for nimble traders, she shares the art of using intraday charts to profit from stocks that...
READ MORE
MEMBERS ONLY

APPLYING MOVING AVERAGES TO THE THREE MAJOR STOCK INDEXES
by John Murphy,
Chief Technical Analyst, StockCharts.com
DOW AND S&P 500 TRY TO STABILIZE NEAR MOVING AVERAGE LINES... A lot more attention is being paid to moving average lines this month because they help determine where potential support and resistance levels may lie. Two that have been mentioned quite a bit lately are the 50-...
READ MORE
MEMBERS ONLY
What Does It Mean When Sectors Fly All Over the Place?
by Julius de Kempenaer,
Senior Technical Analyst, StockCharts.com
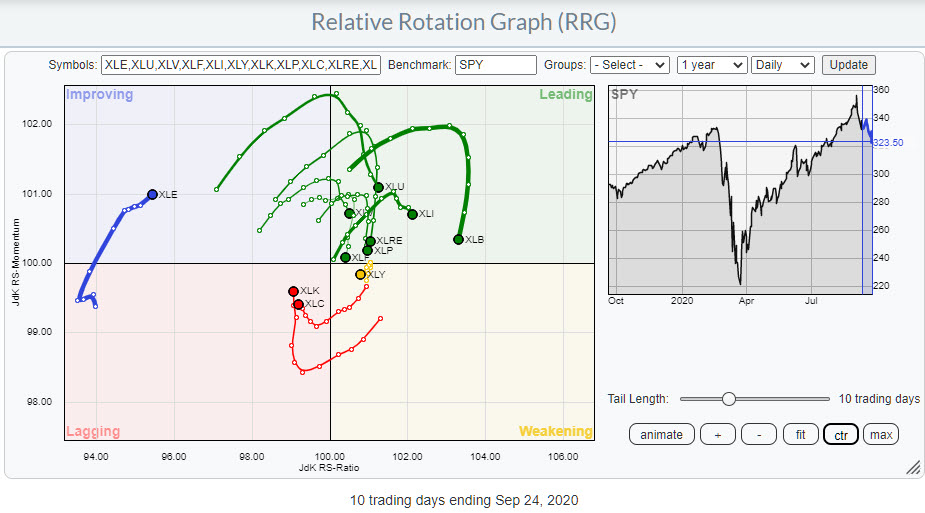
The Relative Rotation Graph above shows the rotation for US sectors on a daily basis over roughly the last two weeks.
The most important observation that we can make from this image is that the rotation currently is very erratic. The tails do not last very long in one quadrant...
READ MORE
MEMBERS ONLY

Navigating Through the Market's Choppy Waters
Today the QQQs, SPY, and DIA, closed near the September 21st lows which we noted as possible support.
While we rallied intraday, we also sold off, giving back most of the days upward progress.
The VXX also failed to break through the 50-DMA to the upside, but It's...
READ MORE
MEMBERS ONLY

Chartwise Women: Get Ready for a Market Recovery
by Mary Ellen McGonagle,
President, MEM Investment Research

by Erin Swenlin,
Vice President, DecisionPoint.com
Draft your dream team of stocks! In this week's edition of Chartwise Women, Mary Ellen and Erin share their best practices to screen for stocks that are more likely to outperform the markets once the downward pressure is lifted. They also outline what signals will tell you when...
READ MORE
MEMBERS ONLY
Breaking Down the Dow Jones Composite Index
by Julius de Kempenaer,
Senior Technical Analyst, StockCharts.com
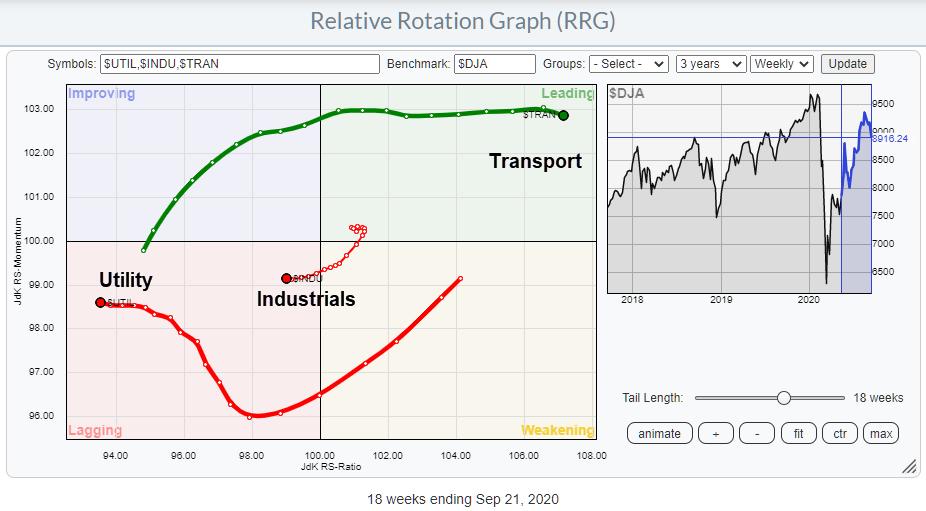
The S&P 500 and the Nasdaq 100 are probably the most discussed charts/indexes. The Dow Jones Industrials is probably the most well known index. From an RRG point of view, the breakdown of the S&P 500 into its sectors is probably the most-watched RRG.
But,...
READ MORE
MEMBERS ONLY

Tesla (TSLA) Is Being Accumulated, Not Distributed - Check Out These 2 Indicators!
by Tom Bowley,
Chief Market Strategist, EarningsBeats.com
I think it's fair to say that most investors look at whether their stock is going up or down in determining whether a stock is being cumulatively bought or sold. That was a big, big mistake back in March as fear-mongering headlines created panic at the opening bell,...
READ MORE
MEMBERS ONLY
Junk Bonds Looking More Like Junk
Let's start with the 4 major indices, the SPY, QQQ, DIA and IWM. They all sold off today, breaking yesterday's lows. Besides IWM, they are still not below their recent low from September 21st. If the indices continue lower, we should keep an eye on those...
READ MORE
MEMBERS ONLY

The Anchored VWAP Reveals "Hidden Support" In The S&P 500, And The US Total Market Is Still King Of The World

by Grayson Roze,
Chief Strategist, StockCharts.com
What a week to be back hosting another episode of "Your Daily Five". As I'm sure you heard, we held a major LIVE event on StockCharts TV yesterday - "Introducing StockChartsACP: The Future of Technical Analysis". Chip, Dave and I sat down for an...
READ MORE
MEMBERS ONLY

STRONGER DOLLAR HURTS PRECIOUS METALS -- STOCK INDEXES BACK OFF FROM 50-DAY AVERAGES AND BROKEN SUPPORT
by John Murphy,
Chief Technical Analyst, StockCharts.com
RISING DOLLAR PUSHES PRECIOUS METALS LOWER... With global stocks on the defensive over the last week, some money has flowed into the relative safety of the U.S. dollar. Chart 1 shows the Invesco Dollar Index (UUP) climbing to the highest level in two months. As usually happens when the...
READ MORE
MEMBERS ONLY

Should You Short Stocks?

by Dave Landry,
Founder, Sentive Trading, LLC
In this edition of Trading Simplified, Dave continues to show his methodology in action using actual trades. He goes on to discuss if you should short stocks and illustrates how his new ACP plugin can be used to identify and get aboard great trends.
This video was originally broadcast on...
READ MORE
MEMBERS ONLY

Running a Scan to Find a Potential Short Squeeze
by Tom Bowley,
Chief Market Strategist, EarningsBeats.com
Short squeezes can result in explosive upside moves. We saw it at the end of 2019 with Tesla (TSLA). Once the stock broke 400, it absolutely flew to the upside. One reason why was that breakout triggered buying from short sellers, who realized that their losses were unlimited as TSLA...
READ MORE
MEMBERS ONLY

Sector Spotlight: Erratic Rotation Signals Uncertainty
by Julius de Kempenaer,
Senior Technical Analyst, StockCharts.com
In this edition of Sector Spotlight, I spend the show talking about current market rotations. I begin with the overview of last week's rotations in asset classes and US sectors, then switch to weekly charts to step away from the erratic daily rotations; this way, I can get...
READ MORE
MEMBERS ONLY
How Long Will the Market Hold its Breath For?
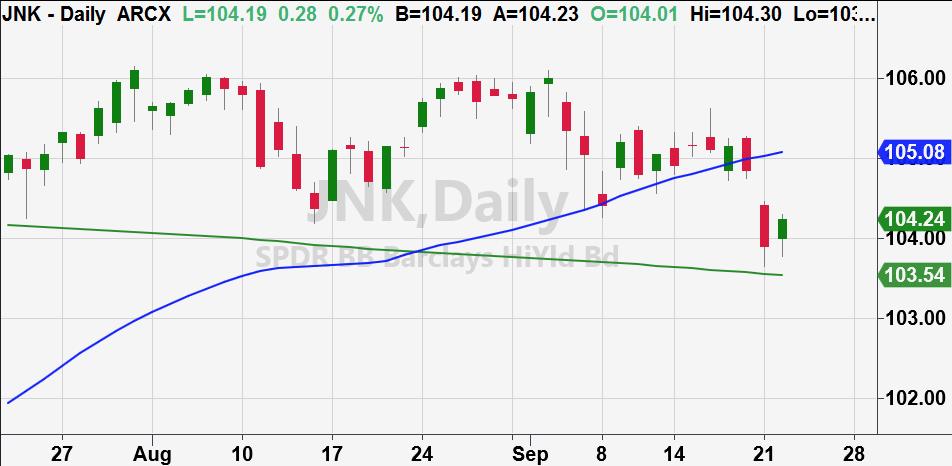
Yesterday, Mish talked about watching junk bonds (JNK) to see if the Fed would continue supporting high risk companies.
Today, JNK had an inside day. This comes after a large red day where JNK gapped lower, breaking its 104.27-106 range. The break also happened to coincide with a major...
READ MORE
MEMBERS ONLY

Is The Bottom In On The NASDAQ?
by Tom Bowley,
Chief Market Strategist, EarningsBeats.com
I believe it could be.
In my Daily Market Report to EarningsBeats.com members, I pointed out a couple very positive short-term developments. First, the S&P 500 pulled back to 3229 yesterday, EXACTLY a 10% correction from its recent all-time high. Extremely bullish sentiment readings suggested that September...
READ MORE
MEMBERS ONLY

DP Show: Hammering Into a Selling Exhaustion?
by Erin Swenlin,
Vice President, DecisionPoint.com

by Carl Swenlin,
President and Founder, DecisionPoint.com
In this episode of DecisionPoint, Carl and Erin talk extensively about the current conditions of the SPY and the climactic indicators that suggest a possible selling exhaustion. Erin discusses the "hammer" candlestick and the implications when considered alongside an exhaustion climax. Carl elaborates on his articleabout the "...
READ MORE
MEMBERS ONLY

Measured Moves in the Market
Coming into Monday, we wrote targets on the S&P 500 and NASDAQ 100. Based on the measured move from the all-time high and the ensuing gap lower (or topping pattern), we shared with you all that the SPY target was 322 and QQQs target was 260.
And wouldn&...
READ MORE
MEMBERS ONLY

S&P Performance Relative to the World Reaches a Crucial Juncture

by Martin Pring,
President, Pring Research
For many years, the S&P Composite (SPY) has outperformed the MSCI World Stock ETF (ACWI). The benefit of the doubt continues to move in favor of the US, but this relationship has reached a crucial juncture point and needs to bounce; otherwise, some serious technical damage will transpire....
READ MORE
MEMBERS ONLY

GLOBAL STOCKS SELL OFF -- DOW AND S&P 500 APPEAR HEADED TOWARD THEIR 200-DAY MOVING AVERAGES
by John Murphy,
Chief Technical Analyst, StockCharts.com
DOW AND S&P 500 HEADING TOWARD 200-DAY LINES... Stocks are selling off all over the world today. With 50-day moving averages having already been broken, 200-day averages are now in play. Chart 1 shows the Dow Industrials approaching their 200-day line (red arrow) which isn't that...
READ MORE
MEMBERS ONLY

Daily Rotations Look Erratic
by Julius de Kempenaer,
Senior Technical Analyst, StockCharts.com
The Relative Rotation Graph above shows the rotation for US sectors on a daily basis at the start of this new week (20.09.21).
The most important observation that we can make from this image is that the rotation currently is very erratic. The tails do not last very...
READ MORE
MEMBERS ONLY

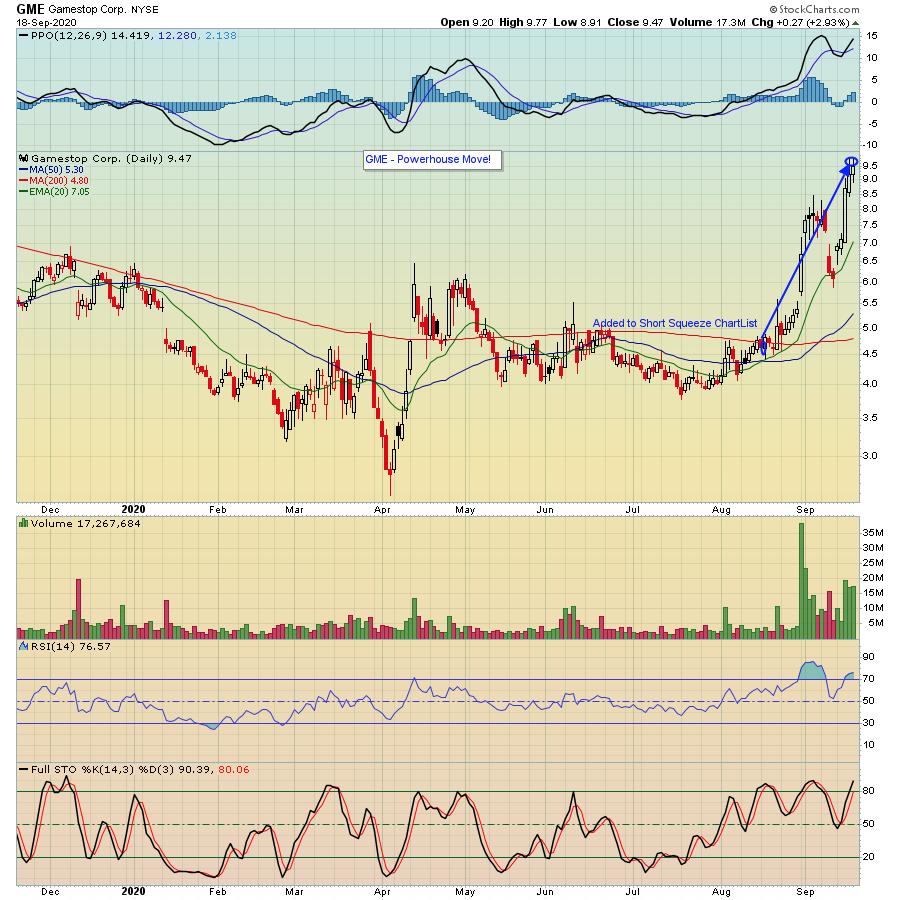
A Massive Short Squeeze Has Sent This Stock Higher By 75% In 3 Weeks!
by Tom Bowley,
Chief Market Strategist, EarningsBeats.com
Stocks that are heavily shorted are stocks that we should generally avoid. There are normally very good reasons, both technically and fundamentally, why a company has so many bets placed against it. Buying stocks that are not performing well simply because they're heavily shorted makes about as much...
READ MORE
MEMBERS ONLY

Week Ahead: Slippery Road Ahead for the NIFTY; RRG Charts Show No Major Shift on the Sectoral Front
by Milan Vaishnav,
Founder and Technical Analyst, EquityResearch.asia and ChartWizard.ae
The week remained largely uneventful for the markets, as they traded in a narrow range and consolidated over the past five days. The trading range also remained very narrow compared to the earlier weeks. The NIFTY witnessed a movement in the band of just 235-odd point while avoiding taking any...
READ MORE
MEMBERS ONLY
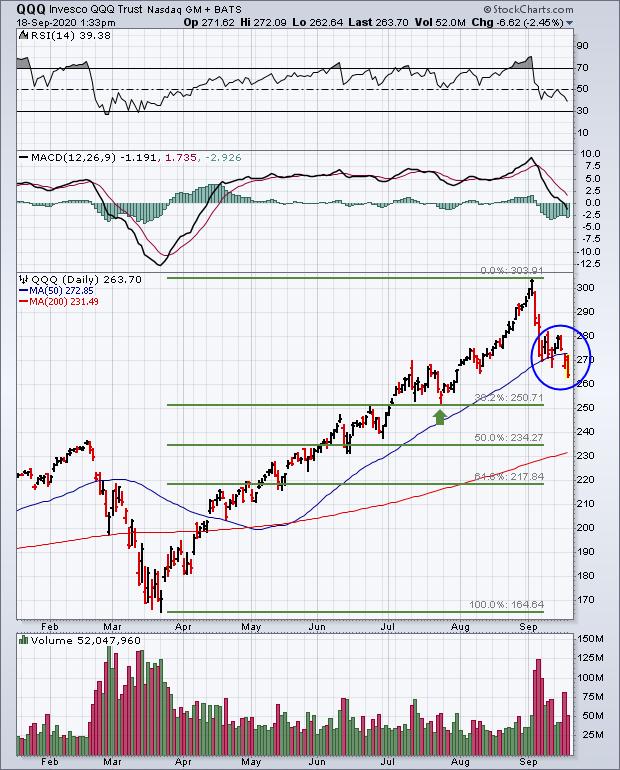
Nasdaq 100 Breaks Short-Term Support as 50-Day Averages Give Way
by John Murphy,
Chief Technical Analyst, StockCharts.com
The daily bars in Chart 1 show the QQQ breaking last week's short-term support and falling further below its 50-day moving average today. The two upper boxes in Chart 1 also show its RSI and MACD lines continuing to decline. That suggests more selling to come. It now...
READ MORE
MEMBERS ONLY

My Pocket Pads Produce Profits: 12 Sample Insights

by Gatis Roze,
Author, "Tensile Trading"
I've written multiple blogs about my pocket pads and how incessantly I jot down great insights and sustaining concepts whenever and however they cross my path. It's been a daily and profitable habit for decades.
Below is a link to a more descriptive past blog about...
READ MORE
MEMBERS ONLY
Profiting on Stocks with High Short Interest

by John Hopkins,
President and Co-founder, EarningsBeats.com
At EarningsBeats.com, we provide our members with various ChartLists of stocks that we believe could give them an upper hand when trading. This includes our Short Squeeze ChartList, which currently has 79 companies that have short percentage of float above 20%. This means that many traders are betting against...
READ MORE
MEMBERS ONLY

Are Growth Stocks Finished?
by Mary Ellen McGonagle,
President, MEM Investment Research
In this episode of StockCharts TV'sThe MEM Edge, Mary Ellen reviews the state of growth stocks and what to be on the lookout for. She also shared top-yielding stocks with highly attractive charts, as well as the best way to screen for candidates in newer, emerging areas of...
READ MORE
MEMBERS ONLY

Time for the Newer Biotech Companies to Wake Up?
With companies like Pfizer (PFE) giving possible hope for an end-of-year vaccine and a recent gap up in IBB (the Nasdaq Biotechnology ETF), now could be a good time to keep an eye on newer issues in this sector.
Large amounts of buying came into IBB on Friday. The price...
READ MORE
MEMBERS ONLY

The Setup to Anticipate the Breakout - XME Example
by Arthur Hill,
Chief Technical Strategist, TrendInvestorPro.com
Chartists are often faced with a choice: wait for the breakout or anticipate using a mean-reversion setup. The Metals & Mining SPDR (XME) broke out of a bullish consolidation this week and the breakout signals a continuation of its long-term uptrend. Chartists keying off the mean-reversion setup could have anticipated...
READ MORE
MEMBERS ONLY
What's a "Pig's Ear" Chart Pattern? + DP "Diamond of the Week"
by Erin Swenlin,
Vice President, DecisionPoint.com
Last week, after presenting a "diamond in the rough" in Wednesday's Diamonds Report, Carl texted me and said that it looked like a "pig's ear" chart pattern. I had never heard him use this term (yes, Dad, never!) and decided to investigate...
READ MORE
MEMBERS ONLY

NASDAQ 100 BREAKS SHORT-TERM SUPPORT AS 50-DAY AVERAGES GIVE WAY -- S&P 500 ALSO TURNS DOWN
by John Murphy,
Chief Technical Analyst, StockCharts.com
NASDAQ 100 TURNS DOWN... The daily bars in Chart 1 show the QQQ breaking last week's short-term support and falling further below its 50-day moving average today. The two upper boxes in Chart 1 also show its RSI and MACD lines continuing to decline. That suggests more selling...
READ MORE
