MEMBERS ONLY
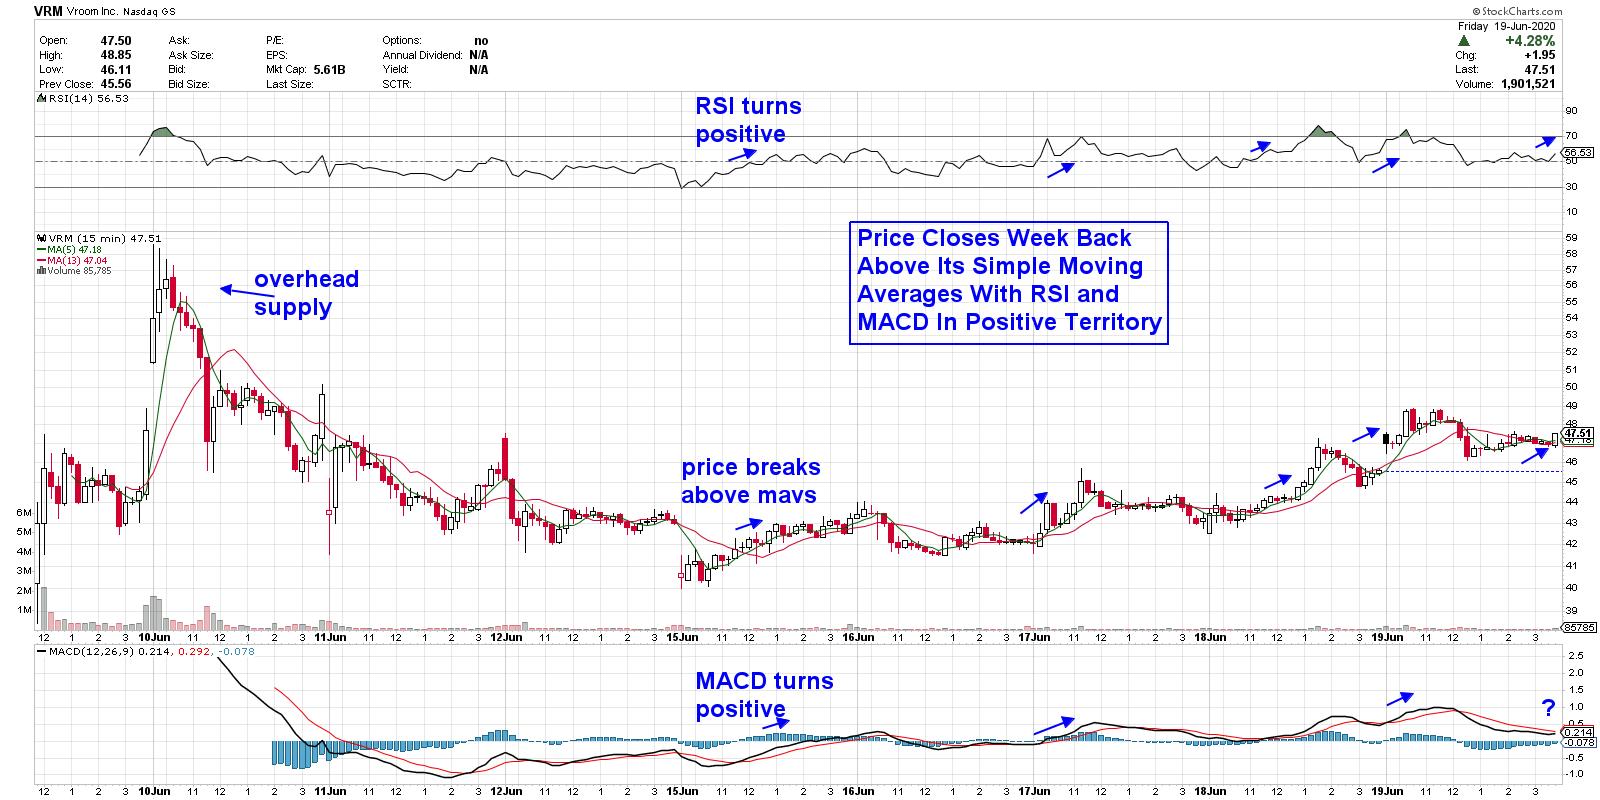
Turtle Soup Scan Triggers 29 Alerts, VRSN Ticks All The Boxes!

by Julius de Kempenaer,
Senior Technical Analyst, StockCharts.com
One of the scans that I run on a daily basis is my scan for "Turtle Soup" Buy signals. Actually, I have two versions of that scan - one that runs at last day's close and one that runs on last intraday update.
For the scan...
READ MORE
MEMBERS ONLY

DP Show: Market Bias Impacts Index Price

by Erin Swenlin,
Vice President, DecisionPoint.com

by Carl Swenlin,
President and Founder, DecisionPoint.com
In this episode of DecisionPoint, Erin reviews the Nasdaq 100's PMO BUY Signal and its whipsaw back into a SELL signal on Wednesday. Carl showed us his new "market bias" view of the Swenlin Trading Oscillators (STOs) and IT Breadth/Volume (ITBM/ITVM). The shift is...
READ MORE
MEMBERS ONLY
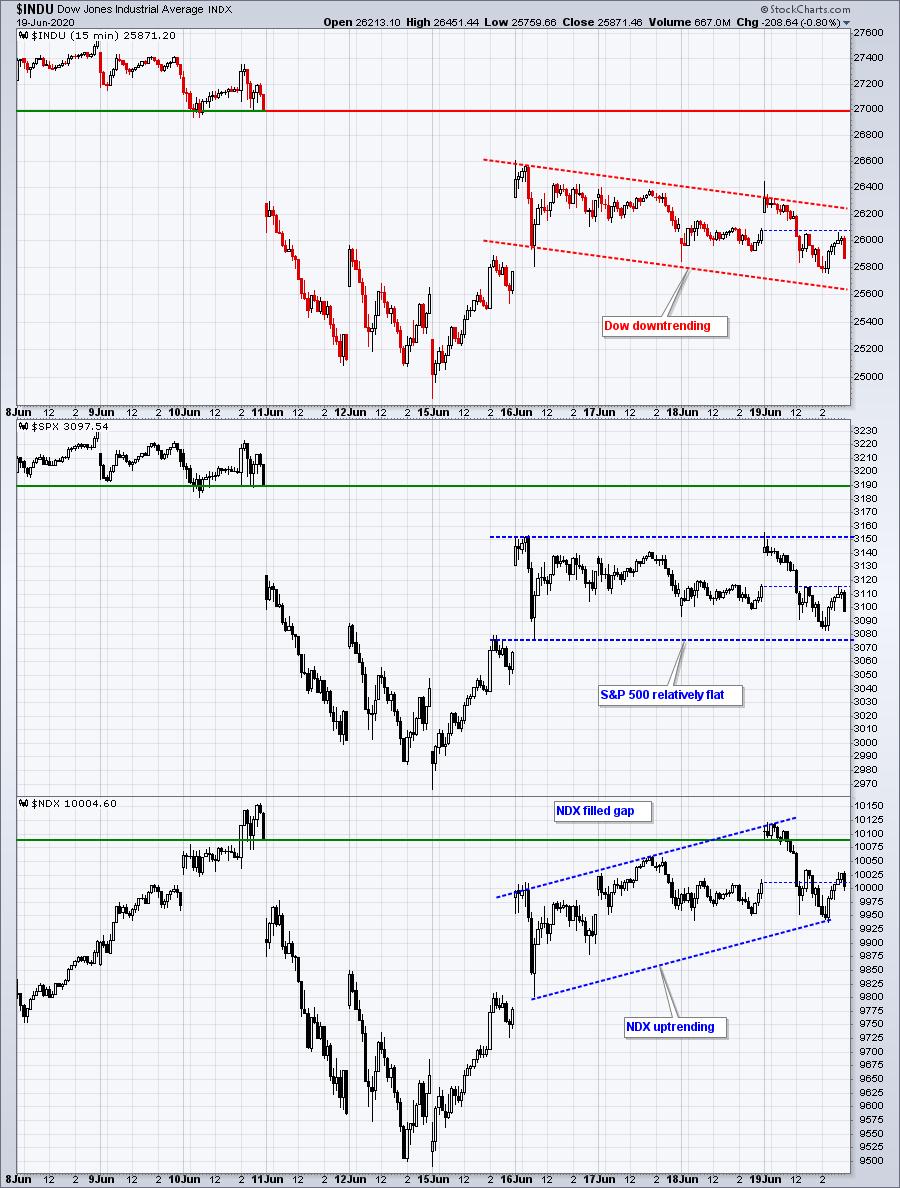
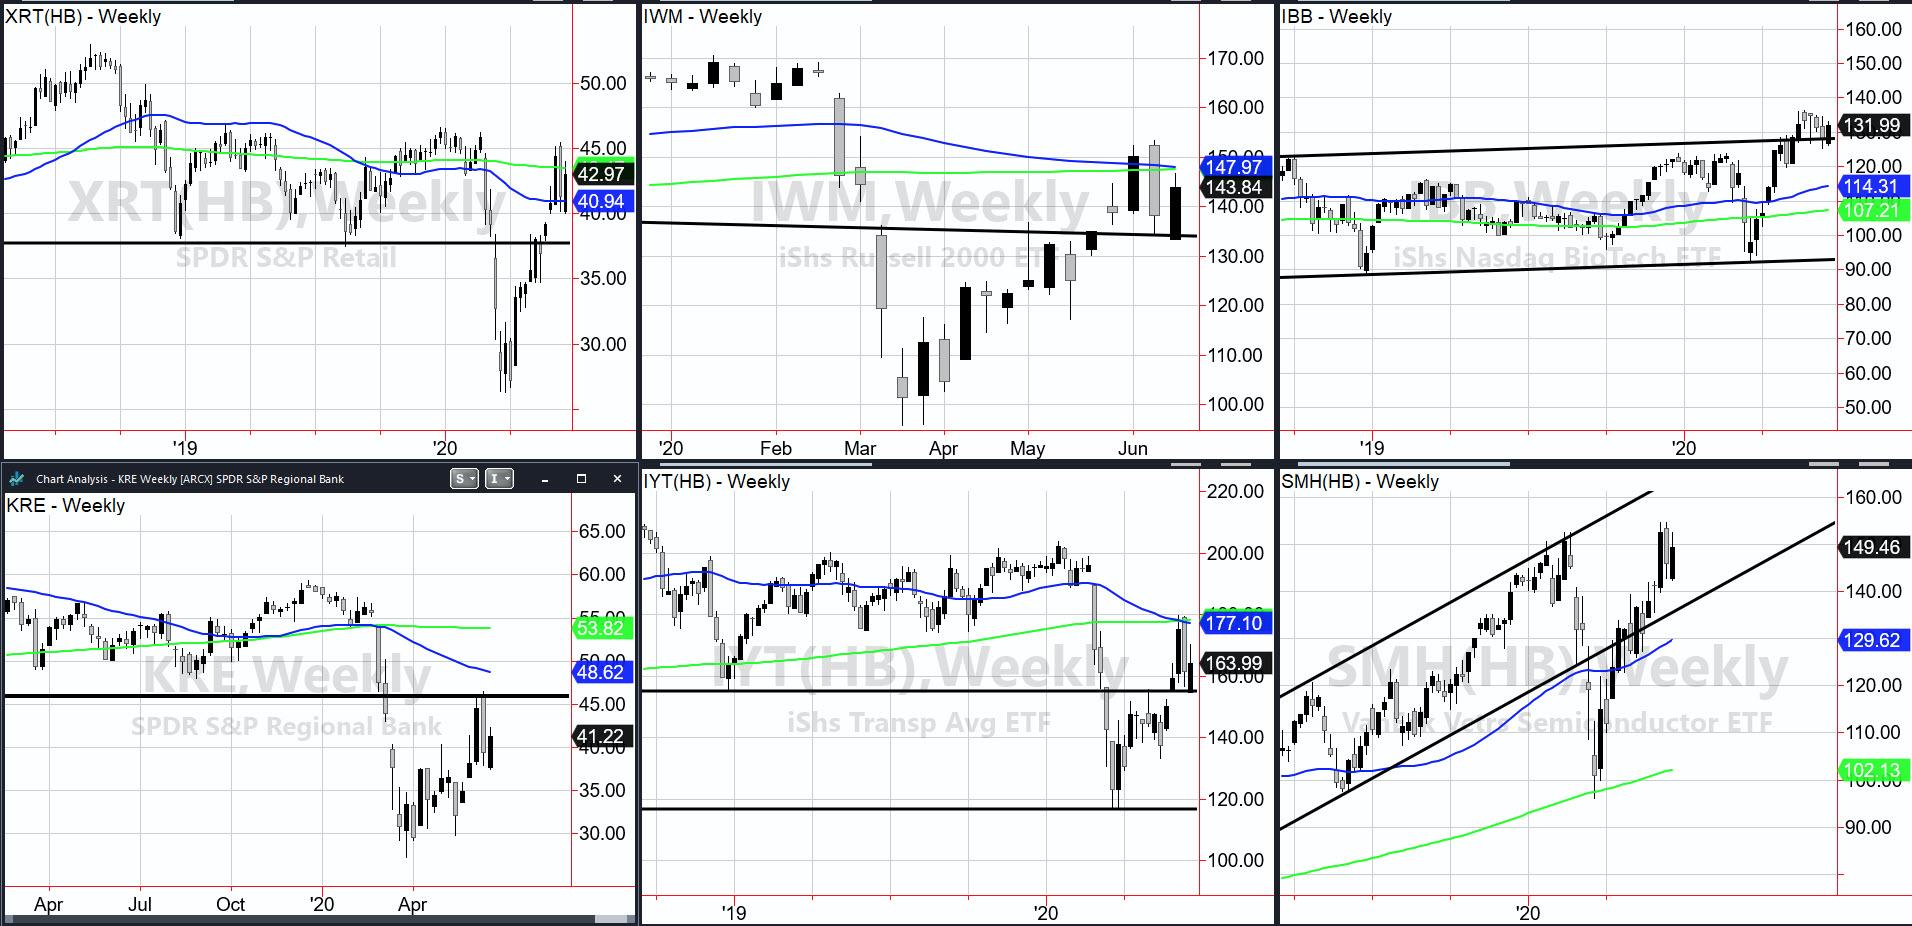
Economic Modern Family - Is the Music Over?
Yesterday, we heard a discordant orchestra. Today, the crescendo that had built up in NASDAQ turned into decrescendo. And while NASDAQ sold off hard, the rat-a-tat of the Russell 2000, Retail, Regional Banks and Granny Retail sectors from yesterday, sounded more like cymbal crashing today.
However, this level of volatility...
READ MORE
MEMBERS ONLY

Serious Life-or-Death Business!

by Dave Landry,
Founder, Sentive Trading, LLC
In this edition of Trading Simplified, Dave concludes his series "What's Standing Between You and Your Longer-Term SUCCESS!" and reveals a few plugins that are coming soon to the StockChartsACP platform.
This video was originally broadcast on June 24th, 2020. Click anywhere on the Trading Simplified...
READ MORE
MEMBERS ONLY

Sector Spotlight: Sector Rotation Using Breadth Data
by Julius de Kempenaer,
Senior Technical Analyst, StockCharts.com
On this episode of Sector Spotlight, I perform a quick overview of asset class and sector rotation, then focus in on plotting breadth data on Relative Rotation Graphs. After the break, I answer two questions from the RRG mailbag.
This video was originally broadcast on June 23rd, 2020. Click anywhere...
READ MORE
MEMBERS ONLY

Assessing Market Bias
by Carl Swenlin,
President and Founder, DecisionPoint.com
Years ago it occurred to me that we should consider market "bias" when interpreting the condition (overbought/oversold) of market indicators. Here is how bias works:
BIAS = BULLISH: Overbought conditions may not impede upward price progress. Conditions become oversold well above the bottom of the normal range. Bullish...
READ MORE
MEMBERS ONLY
Economic Modern Family Acts Tone-Deaf
I hear a symphony..
Only there are some discordant notes.
On the one side of the orchestra, we have NASDAQ FAANG and Tech building to a crescendo. On the other side, we have the Russell 2000, Retail Regional Banks and Granny Retail sounding more like a rat-a-tat-tat, then quiet. Therefore,...
READ MORE
MEMBERS ONLY

Gold Moves to a New High; Will the Breakout Hold?

by Martin Pring,
President, Pring Research
* Long-Term Gold Charts Give Perspective
* Gold vs. the Dollar
* Gold vs. Gold Shares
* Short-Term Gold Position
* Conclusion
Long-Term Gold Charts Give Perspective
Gold broke out to a new recovery high on Tuesday and looks set to gain more ground, all with a favorable background from the long-term trend.
Chart 1...
READ MORE
MEMBERS ONLY
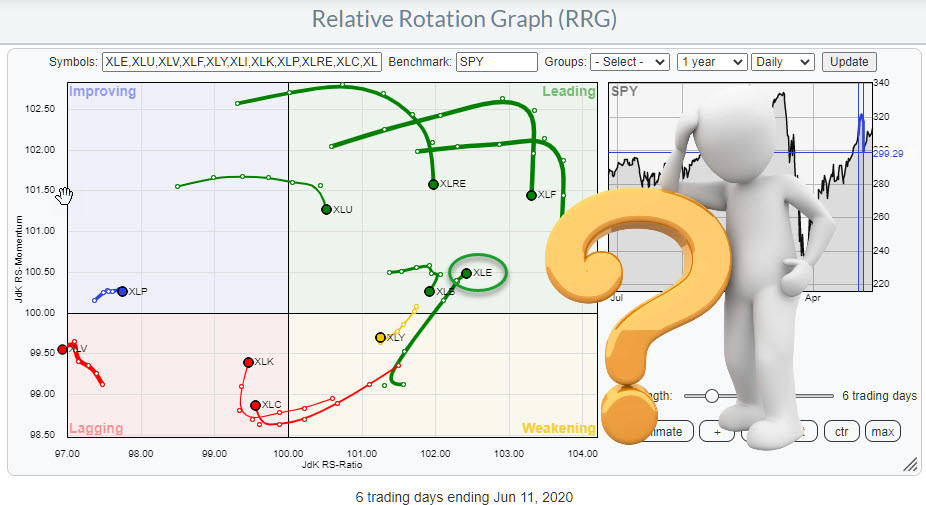
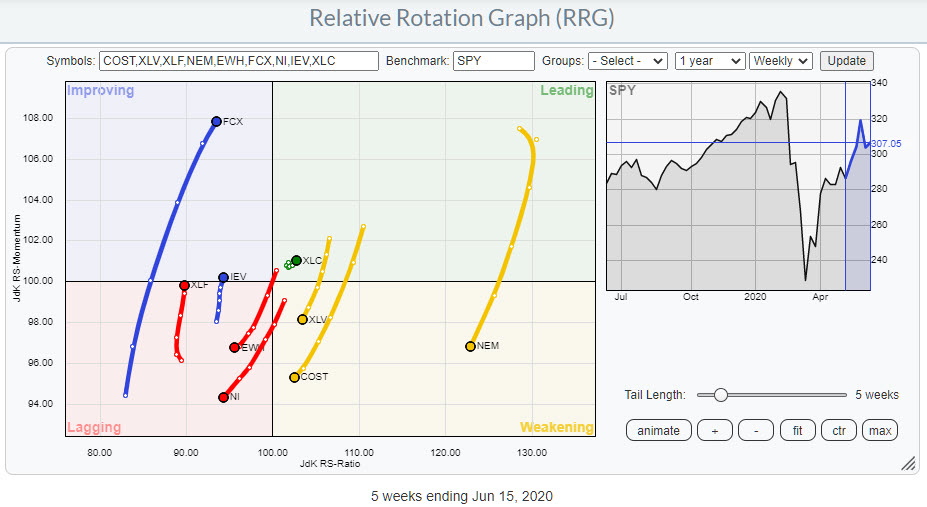
XLE is Down 9%, But Still Moving Up Into the Leading Quadrant.... Why?
by Julius de Kempenaer,
Senior Technical Analyst, StockCharts.com
This question was forwarded to me by Dave Keller after he received it in the mailbag for his show The Final Bar.
"The RRGs attached all make sense except for XLE. It was down nearly 9% the last two days, but the RRG has it moving up from weakening....
READ MORE
MEMBERS ONLY
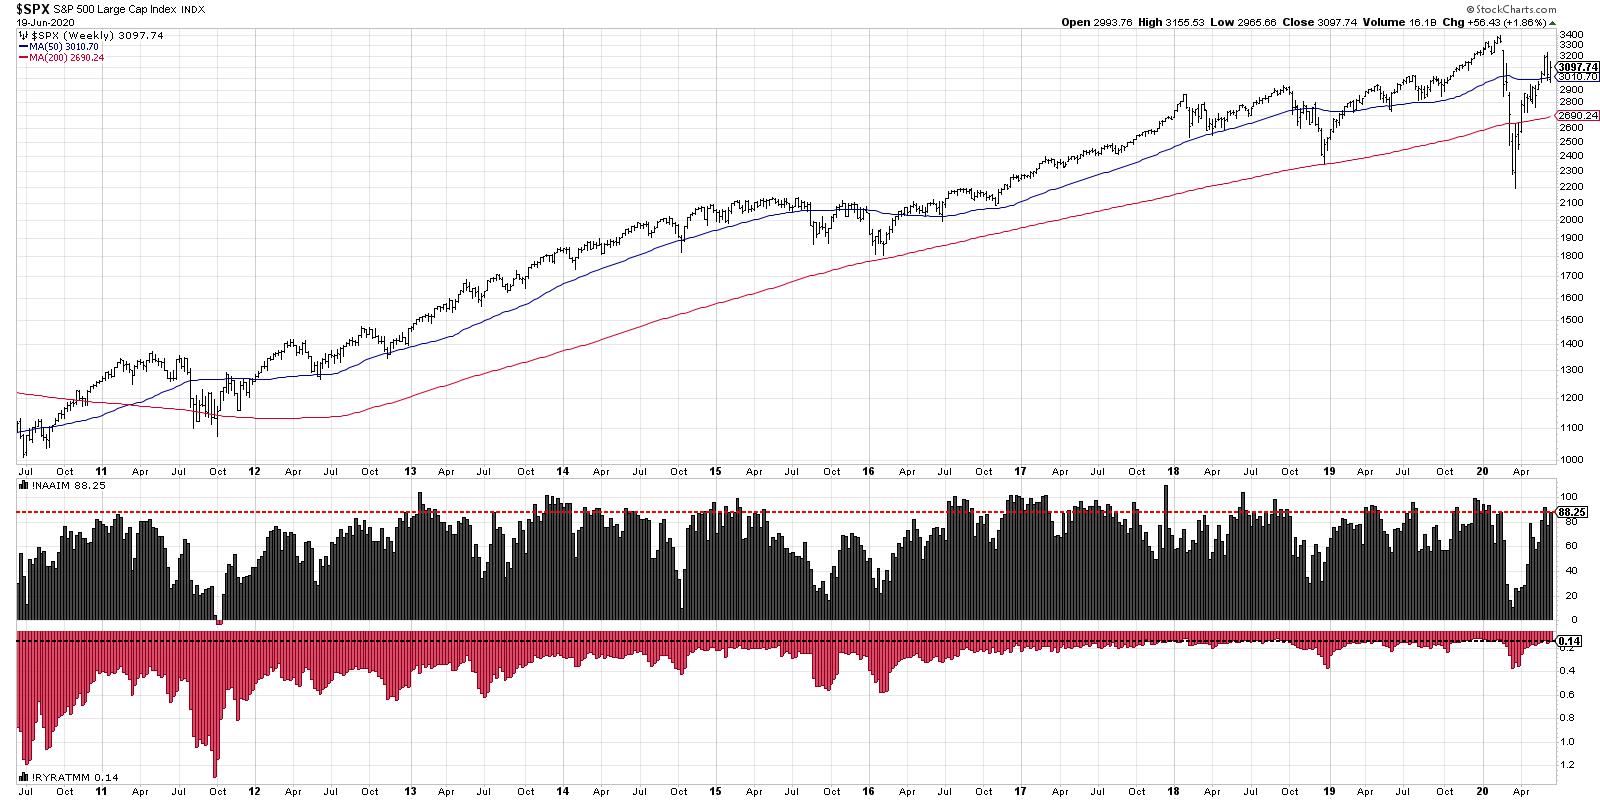
Extremes in Sentiment Mean Extreme Bullishness

by David Keller,
President and Chief Strategist, Sierra Alpha Research
When I'm prioritizing information to help me understand the broad market environment, I tend to consider this as the order of importance:
1. Price
2. Breadth
3. Sentiment
I've found sentiment readings such as the American Association of Individual Investors (AAII) and Investors Intelligence (II) surveys...
READ MORE
MEMBERS ONLY

The Market Will Not Go Down Unless...
The market will not go down unless...
* The death rate from COVID-19 spikes - not simply the number of cases.
* The dollar keeps failing while the yuan grows in demand.
* The civil unrest surges to the point of riots, hence unavoidable disruption.
* War breaks out in North Korea or Middle...
READ MORE
MEMBERS ONLY
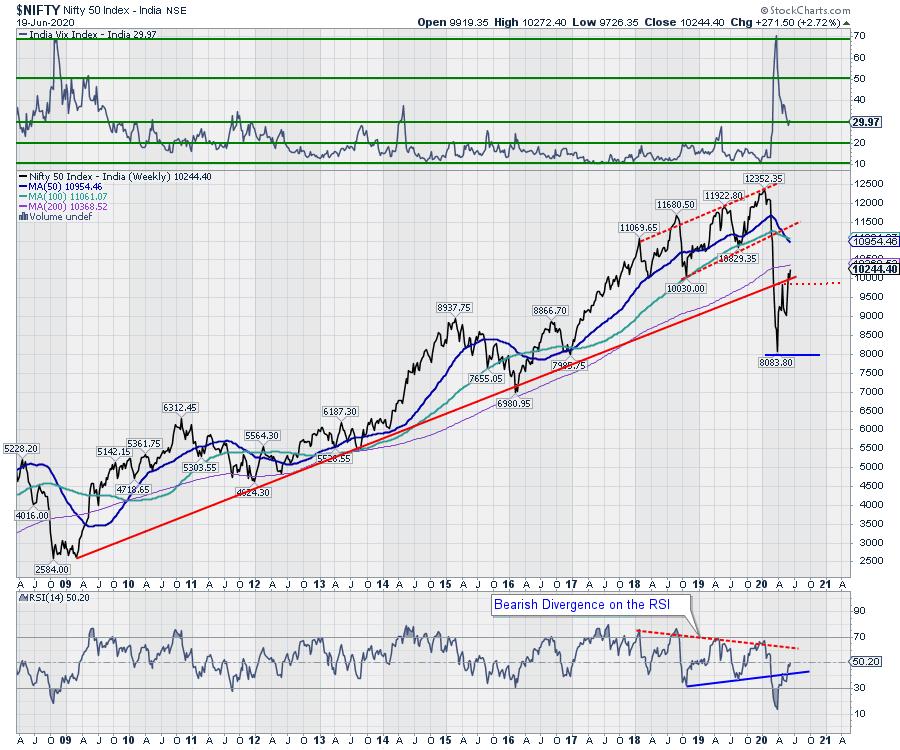
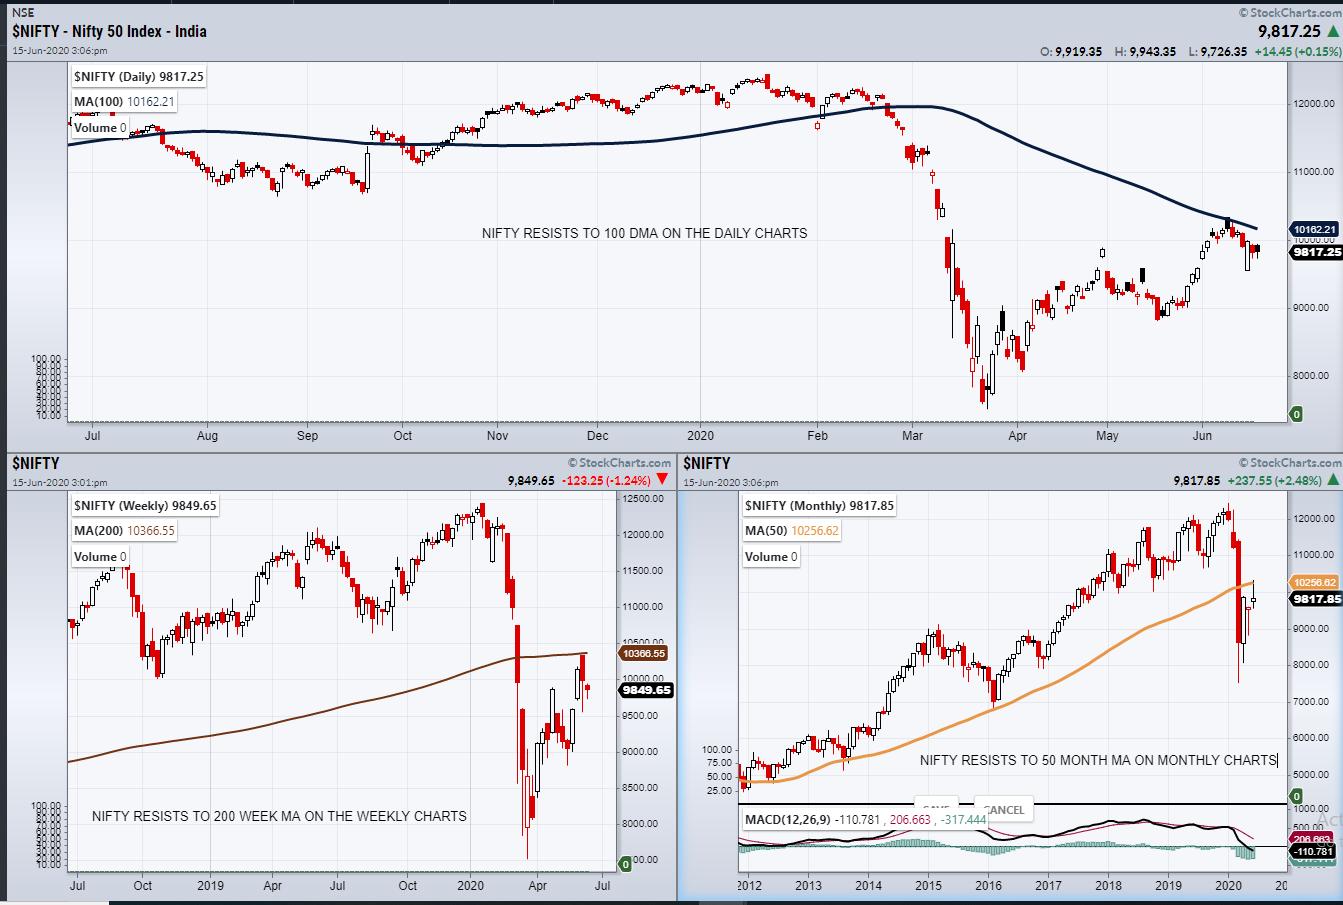
Week Ahead: NIFTY in Striking Distance of this Critical Resistance; RRG Charts Sectors Moving on Expected Lines

by Milan Vaishnav,
Founder and Technical Analyst, EquityResearch.asia and ChartWizard.ae
After taking a breather during the week before this one, the Indian equity markets moved higher again and closed the week with decent gains. The trading range remained less wide than in the previous week. The earlier week had seen the NIFTY oscillating in a 784-point wide range; this time,...
READ MORE
MEMBERS ONLY

Power Charting TV: Wyckoff Method Checklist for a Peak.

by Bruce Fraser,
Industry-leading "Wyckoffian"
* Wyckoff Method Checklist for a Peak (Video and Chart Update)
* Crypto Currency & the Wyckoff Method. Alessio Rutigliano Presents on Power Charting
* Wyckoff Market Discussion (WMD) 200th Episode Video and a Special Offer
A series of market conditions have come together this last week to suggest the exhaustion of the...
READ MORE
MEMBERS ONLY
Stocks of these Companies are Seeing a Surge in Demand Despite an Uncertain Market

by Mary Ellen McGonagle,
President, MEM Investment Research
The markets have been able to climb a wall of worry over the past 3 months in a move that's pushed the Nasdaq to a new high in price, with the S&P 500 within 6% of its peak reached in mid-February.
The significant rally over the...
READ MORE
MEMBERS ONLY
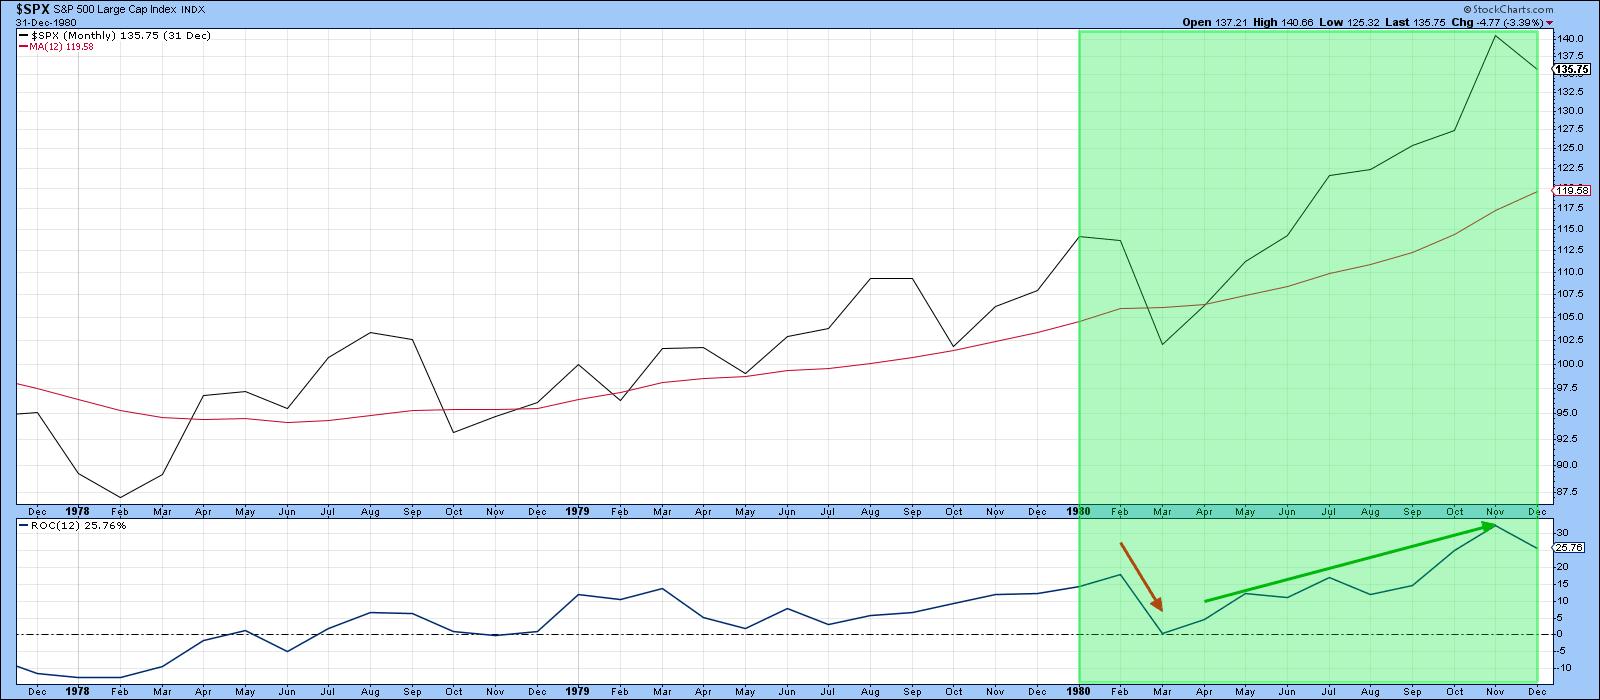
Is Twenty-Twenty Nineteen-Eighty Déjà vu All Over Again?
by Martin Pring,
President, Pring Research
The simple answer to the question posed in the title is "No!". However, there are a number of interesting parallels that have implications for 2020 and beyond. Let's see what they are.
The Decennial Cycle and Years Ending in a "0"
According to the...
READ MORE
MEMBERS ONLY
Extremes in Sentiment Show Bullish Tilt
by David Keller,
President and Chief Strategist, Sierra Alpha Research
When I'm prioritizing information to help me understand the broad market environment, I tend to consider this as the order of importance:
1. Price
2. Breadth
3. Sentiment
I've found sentiment readings such as the American Association of Individual Investors (AAII) and Investors Intelligence (II) surveys...
READ MORE
MEMBERS ONLY
Wall Street Is POURING Money Into This Industry Group, Don't Miss Out!

by Tom Bowley,
Chief Market Strategist, EarningsBeats.com
I am constantly performing research, using my analytical skills to uncover the best stock market opportunities. At EarningsBeats.com, we have a proven process of identifying leading stocks in leading industries. It all starts with fundamental research, which helps us to limit the number of stocks in our trading universe...
READ MORE
MEMBERS ONLY

Can Markets Trade Higher in the Face of Viral Surge?
by Mary Ellen McGonagle,
President, MEM Investment Research
In this episode of StockCharts TV'sThe MEM Edge, Mary Ellen examines what to be on the lookout for in the broader markets. She also highlights ways to take advantage of the downtrend reversal in select Healthcare stocks, as well as news-related stocks poised to trade higher.
This video...
READ MORE
MEMBERS ONLY

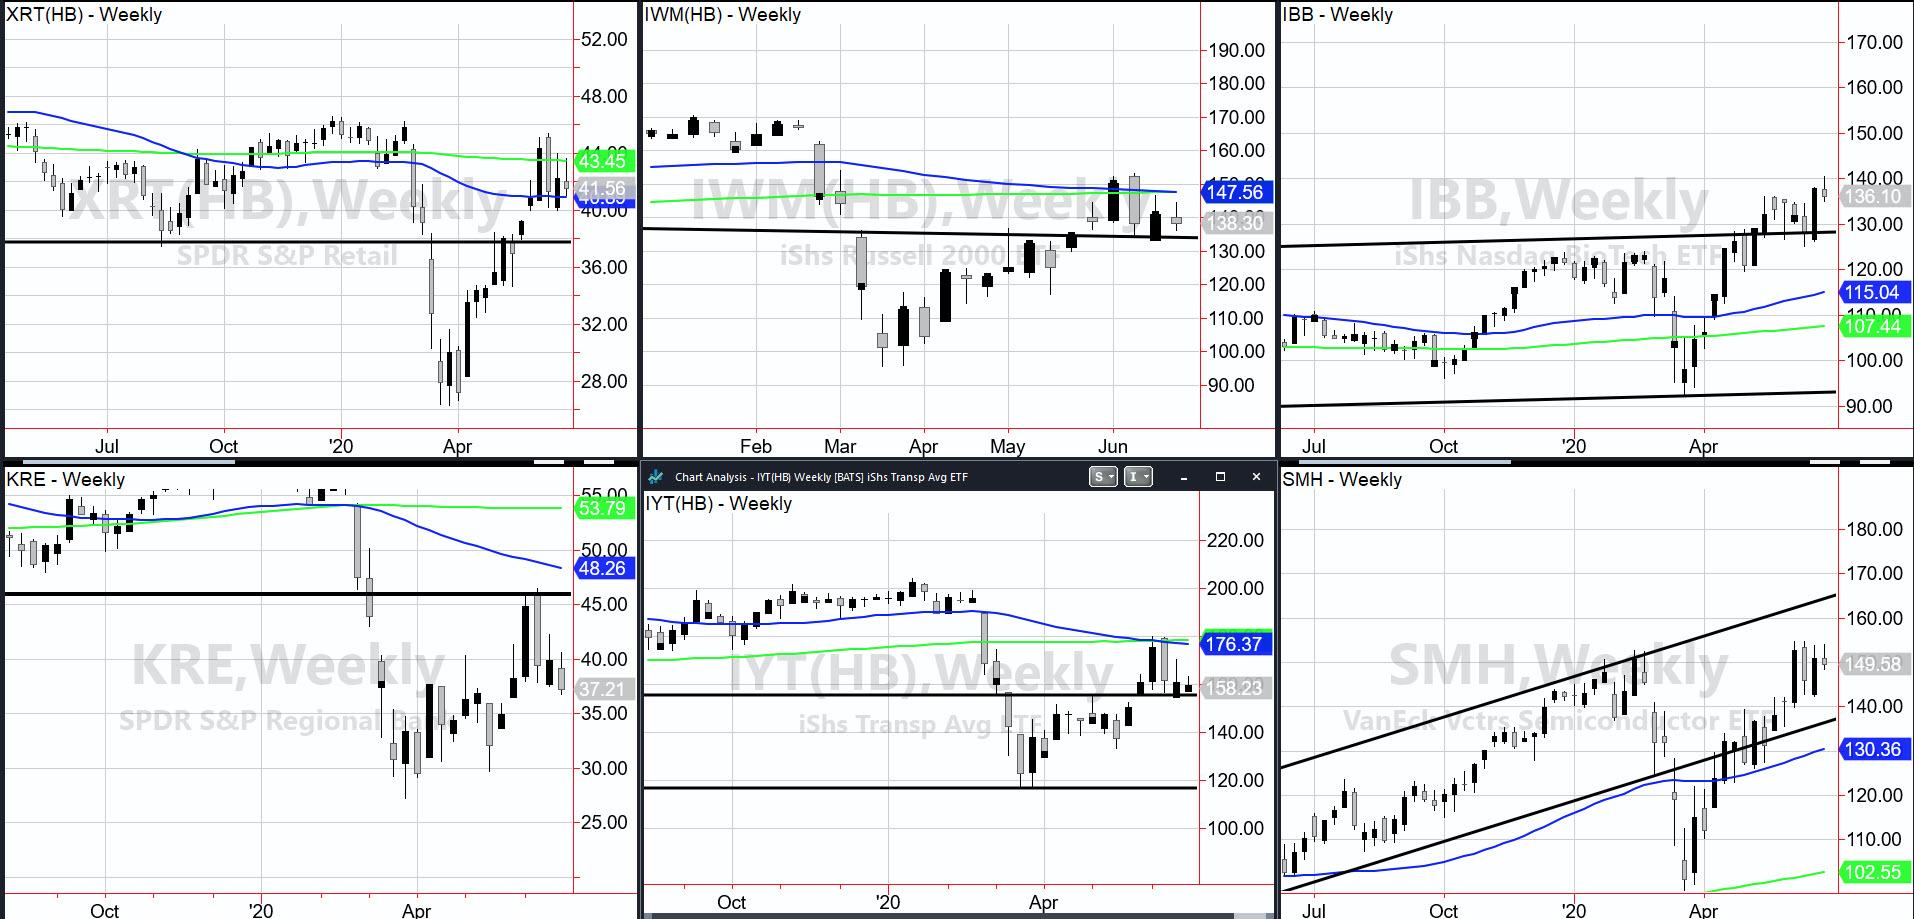
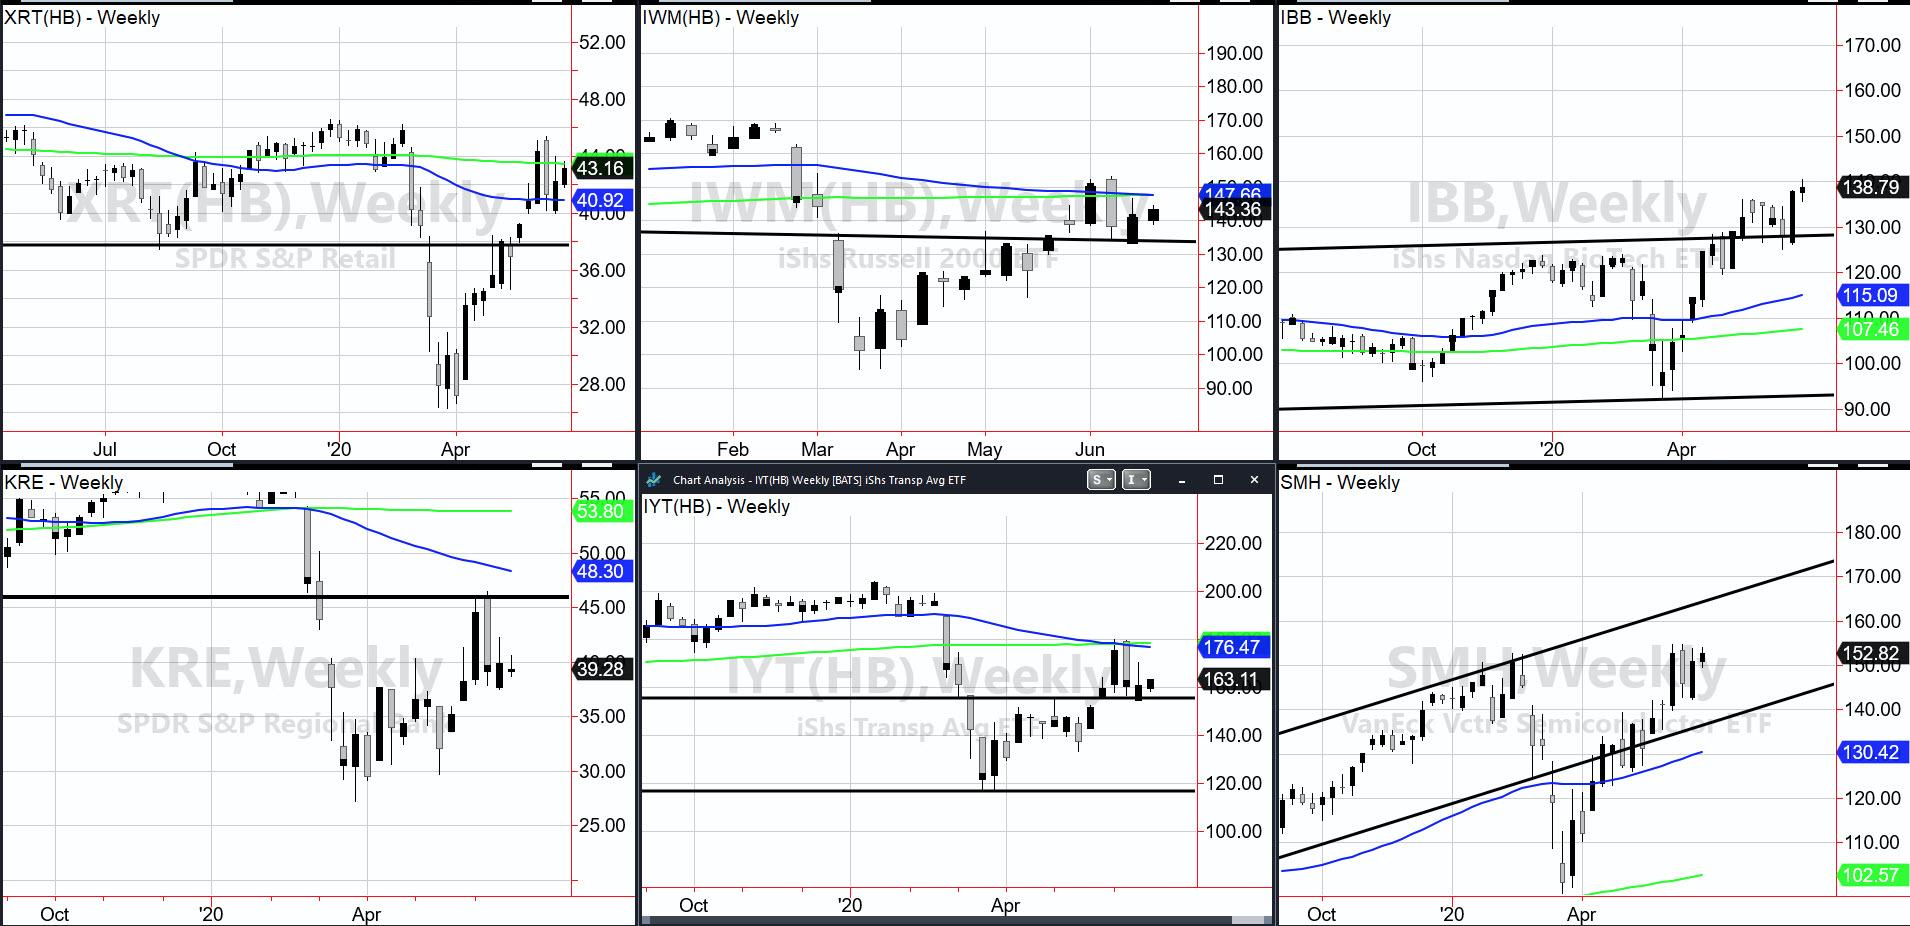
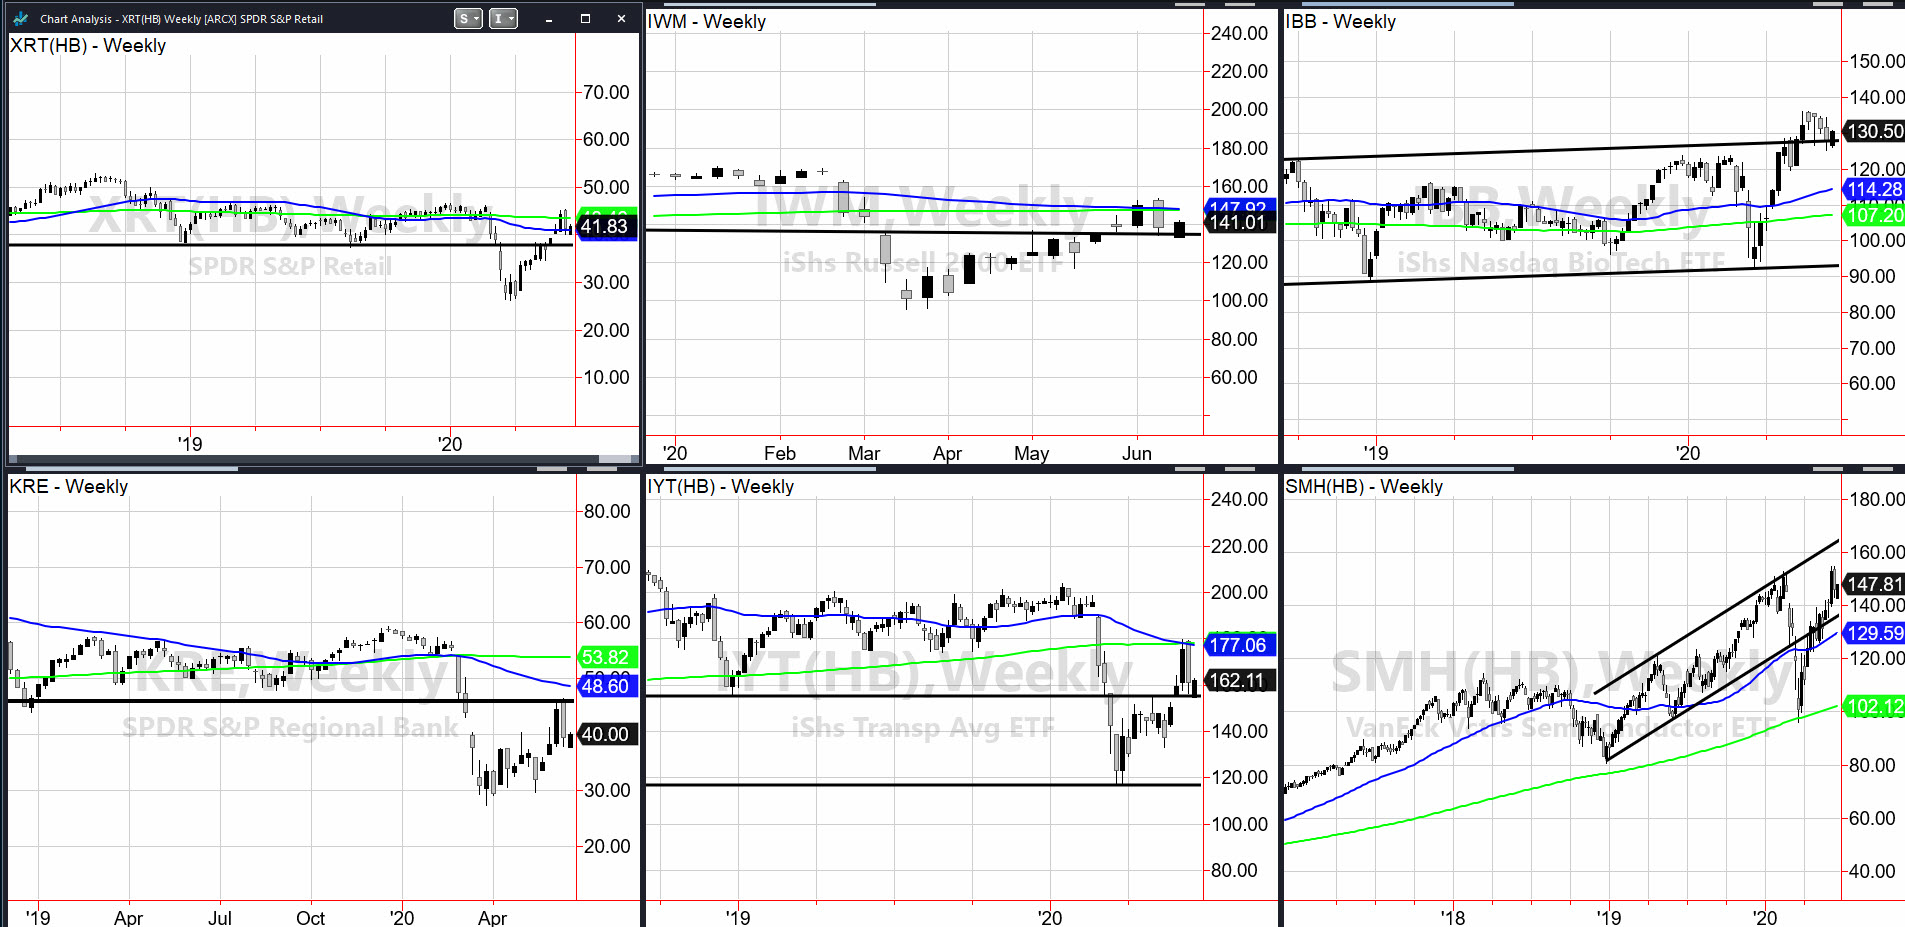
Five Themes to Trade in the Market
Without a doubt, our Economic Modern Family continues to give us reasons for concern.To end the week, Regional Banks (KRE), Transportation (IYT) and the Russell 2000 (IWM) not only all failed to clear their upper ranges and moving averages, but they all also sold off to close beneath their...
READ MORE
MEMBERS ONLY
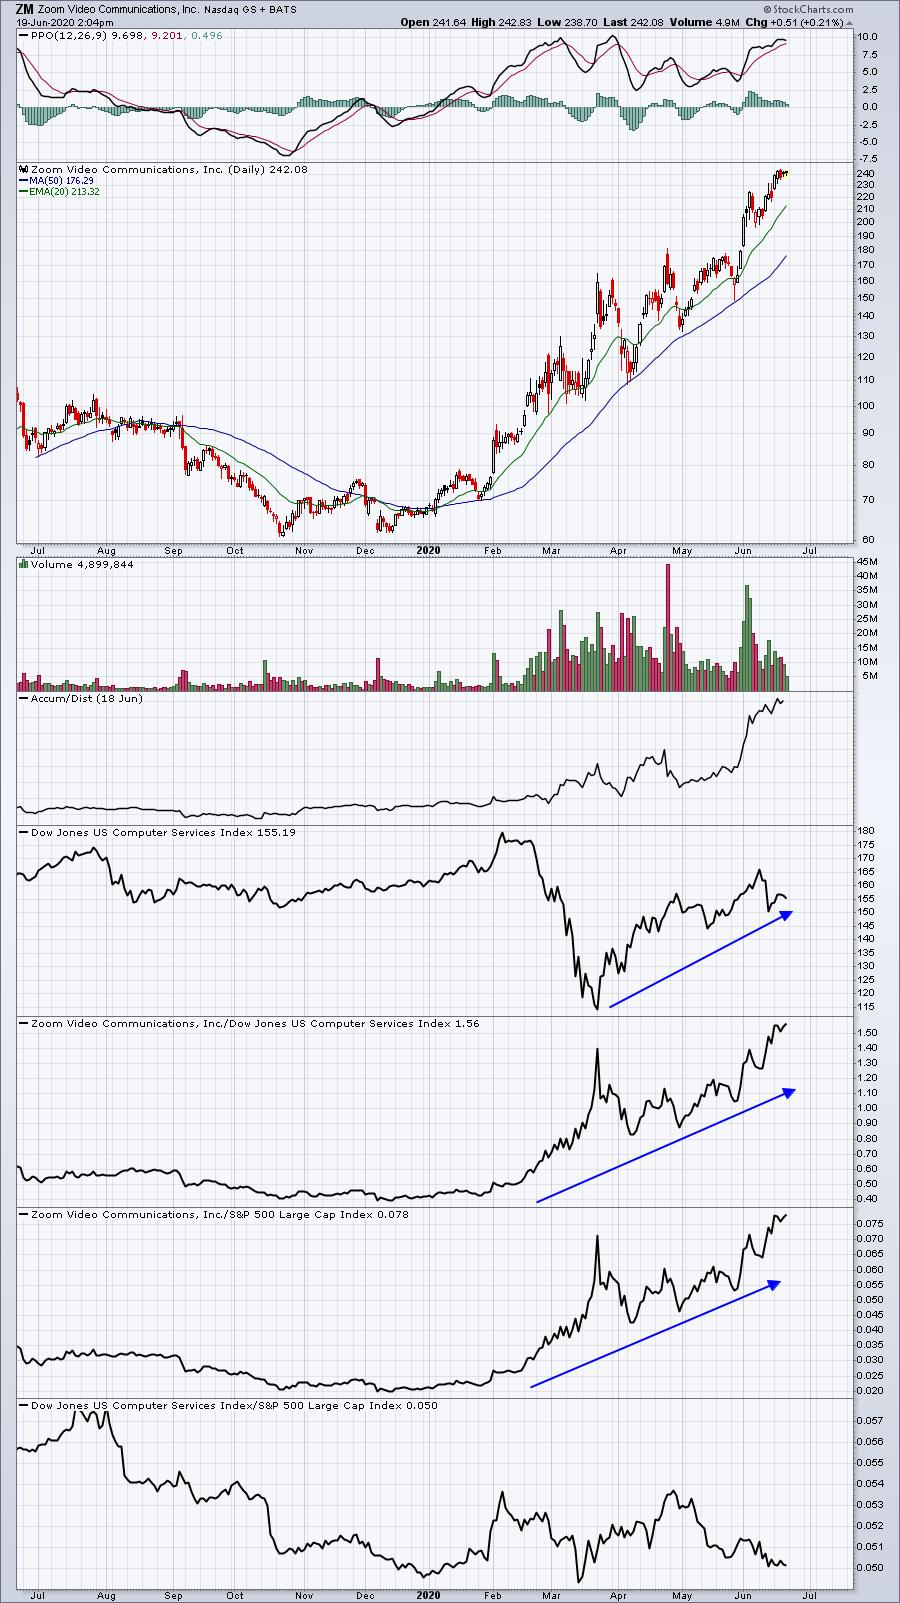
Zoom (ZM) Helps To Lead Our Model Portfolio To Nearly 100% Gain In 19 Months
by Tom Bowley,
Chief Market Strategist, EarningsBeats.com
I think most market participants would agree that the past 19 months, which has included 2 cyclical bear markets, have been trying, to say the least. At the time our Model Portfolio was created on November 19, 2018, the S&P 500 stood at 2690.73. At Thursday'...
READ MORE
MEMBERS ONLY

Where Wall Street Meets Broad Street - Using Breadth Data to Confirm Sector Rotation
by Julius de Kempenaer,
Senior Technical Analyst, StockCharts.com
Technical analysts use a lot of breadth data in their work, which is understandable as it can give us a lot of useful information about how a market as a whole, usually a broad index level, behaves. Plus, it can help us to find developments "under the hood"...
READ MORE
MEMBERS ONLY

Is Twenty-Twenty Nineteen-Eighty Déjà vu All Over Again?
by Martin Pring,
President, Pring Research
* The Decennial Cycle and Years Ending in a "0"
* 1980 and 2020 Both Experienced Recessions
* Further Out, Things are More Problematic
* China Technology Breaks to the Upside
The simple answer to the question posed in the title is "No!". However, there are a number of interesting...
READ MORE
MEMBERS ONLY

DP Show: PMO SELL Signals Despite Bullish Bias
by Erin Swenlin,
Vice President, DecisionPoint.com
by Carl Swenlin,
President and Founder, DecisionPoint.com
In this episode of DecisionPoint, Carl and Erin review four new Price Momentum Oscillator (PMO) SELL signals on four of the major market indexes. Even the Nasdaq 100's new highs didn't prevent that PMO SELL signal. Erin discusses climactic indicators and how they can be leading...
READ MORE
MEMBERS ONLY
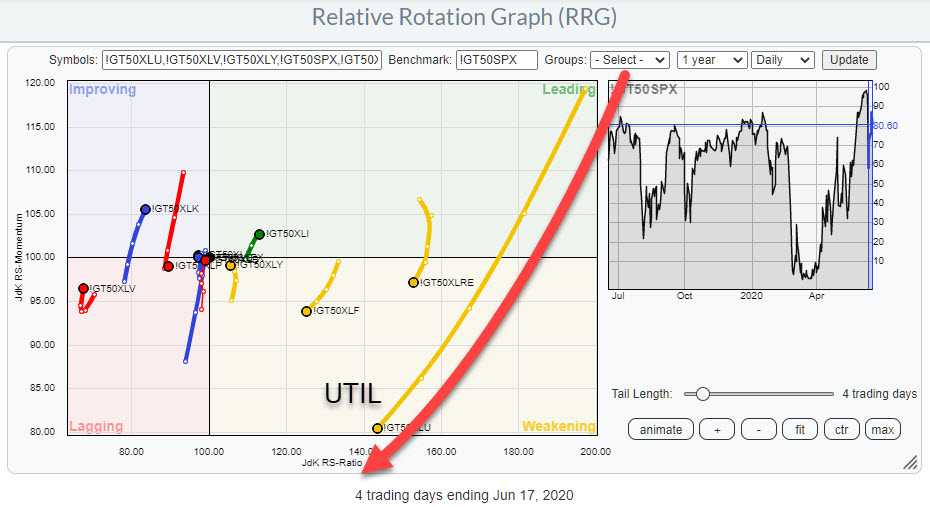
(Sector) Breadth Confirms Weak Rotation for Utilities
by Julius de Kempenaer,
Senior Technical Analyst, StockCharts.com
Relative Rotation Graphs are not just good for showing you the relative rotation based on price, but can also help you to see the relative development (rotation) of breadth on a sector level. There are many measures for breadth available in the StockCharts.com database, including several breadth indexes that...
READ MORE
MEMBERS ONLY

The Elephant in the Market
"I don't see us wanting to run through the bond market like an elephant snuffing out price signals, things like that." - Powell
Powell is referring to the Fed's plan to expand its purchase of bonds beyond ETFs and into individual issues.The implication...
READ MORE
MEMBERS ONLY
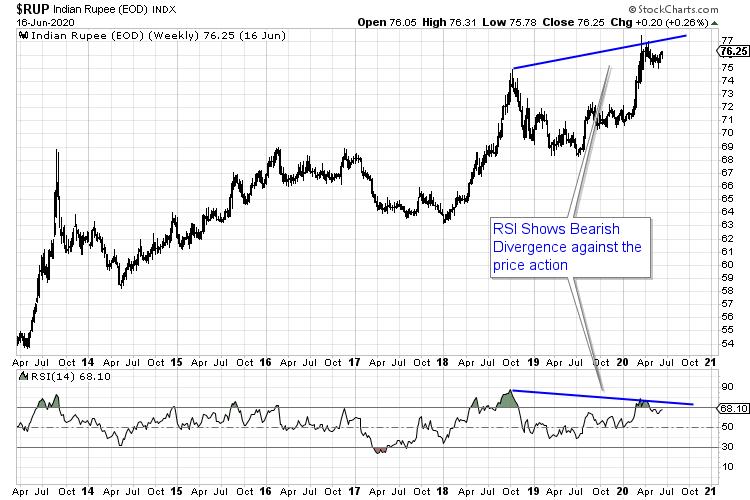
Why INR Is Resilient Against USD
by Milan Vaishnav,
Founder and Technical Analyst, EquityResearch.asia and ChartWizard.ae
Despite rising over 20% from the low point seen in March 2020, the Indian equity markets have continued to underperform their global peers. The figures of the recent giant short-squeeze speak for itself. The headline index NIFTY50 has returned 12.99% over the past three months. However, on a year-to-date...
READ MORE
MEMBERS ONLY

Discovering Long-Term SUCCESS!
by Dave Landry,
Founder, Sentive Trading, LLC
Initial success doesn't necessarily equate to long-term success! In this edition of Trading Simplified, Dave explains how you can use trading psychology to discover ways to go from being a "trader for now" to being a "trader for life." Important lessons to learn including...
READ MORE
MEMBERS ONLY

Sector Spotlight: Steepening Yield Curve a Threat?
by Julius de Kempenaer,
Senior Technical Analyst, StockCharts.com
On this episode of Sector Spotlight, I work my way through the Investment pyramid, introducing a new universe for commodity sub-indexes. In particular, I highlight the steepening of the yield curve, which could be a threat for the S&P.
This video was originally broadcast on June 16th, 2020....
READ MORE
MEMBERS ONLY
Market - Is That the Best You Got?
Jerome Powell's talking points today:
* "Millions" of people will not return to work for some time because of the aftershocks to businesses from the health scare.
* Fed has not committed to the hotly debated concept of yield curve control to lower interest rates further.
* Struck a...
READ MORE
MEMBERS ONLY
Three Stocks That Tell You Everything
by David Keller,
President and Chief Strategist, Sierra Alpha Research
I've often said that by looking at individual stocks, you can get a deeper level of understanding of what's moving the overall equity markets. While some investors insist that "a rising tide lifts all boats" and you're better off just following the...
READ MORE
MEMBERS ONLY
Some Long and Short Ideas from RRG
by Julius de Kempenaer,
Senior Technical Analyst, StockCharts.com
In my weekly Sector Spotlight show on StockCharts TV, I present a segment on pair-trading ideas from time to time. This initially started out as 1-1 pair trades ideas, later changing to a basket of long ideas vs. a basket of short ideas.
In the episode that I recorded yesterday...
READ MORE
MEMBERS ONLY
Let the Economic Modern Family Be Your Guide
After the Fed announcement that they will be buying corporate bonds, the market took off.
As mentioned in the weekend daily, we must go back to the stick in the mud, i.e. the NASDAQ 100 and its island top. Until the price trades up to 244.51 or the...
READ MORE
MEMBERS ONLY

My Daily Five: Island Reversal on VTI, The "Market Mindset Meter", Summer Seasonality And Two Of The "10 I'm Stalking" This Week

by Grayson Roze,
Chief Strategist, StockCharts.com
Today, I kicked off the week by hosting another episode of "Your Daily Five", one of our newest series on StockCharts TV where we bring you a concise, action-packed daily rundown of the five most important charts that you need to be watching. Weekdays at 1:00pm ET,...
READ MORE
MEMBERS ONLY
Special Note: Why This Humble Indicator Should Not Be Ignored
by Milan Vaishnav,
Founder and Technical Analyst, EquityResearch.asia and ChartWizard.ae
Moving Averages are one of the most simple and age-old tools within a technician's toolkit.
This humble indicator is nothing more than a smoothing tool, used for smoothing the price data to form a trend following indicator. It does not predict price direction, just the current trend and...
READ MORE
MEMBERS ONLY
7 S&P 500 Stocks That I'm Stalking Right Now
by Tom Bowley,
Chief Market Strategist, EarningsBeats.com
If you're just showing up at 9:30am ET and deciding last minute which stocks to trade, I think you're doing yourself a major disservice. You also are likely allowing the market to dictate to you which stocks you're interested in. There may be...
READ MORE
MEMBERS ONLY
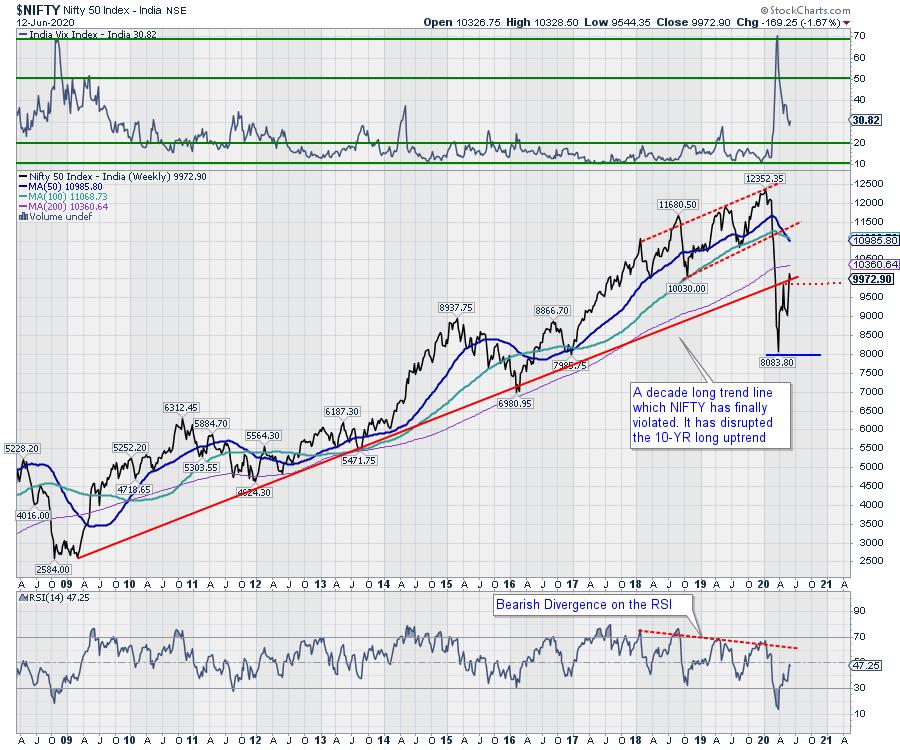
Week Ahead: NIFTY Likely to Struggle At Higher Levels; RRG Chart Shows Rotation Changing Hands
by Milan Vaishnav,
Founder and Technical Analyst, EquityResearch.asia and ChartWizard.ae
After a strong gain of 5.86% in the week prior to this past one, the NIFTY took a breather after rising nearly 1000 points over the past couple of days following a strong liquidity gush fueled by global risk-on environment. The past couple of days stayed volatile, especially the...
READ MORE
MEMBERS ONLY

Catch "The Pitch", Featuring Greg Schnell, Julius de Kempenaer and Mary Ellen McGonagle, Hosted By Tom Bowley
by Grayson Roze,
Chief Strategist, StockCharts.com
We're back with another new edition of The Pitch, this month featuring Greg Schnell, Julius de Kempenaer and Mary Ellen McGonagle, hosted by Tom Bowley. Each analyst has come prepped with their five most compelling stock picks for the current market environment. And with volatility continuing to dominate...
READ MORE
MEMBERS ONLY

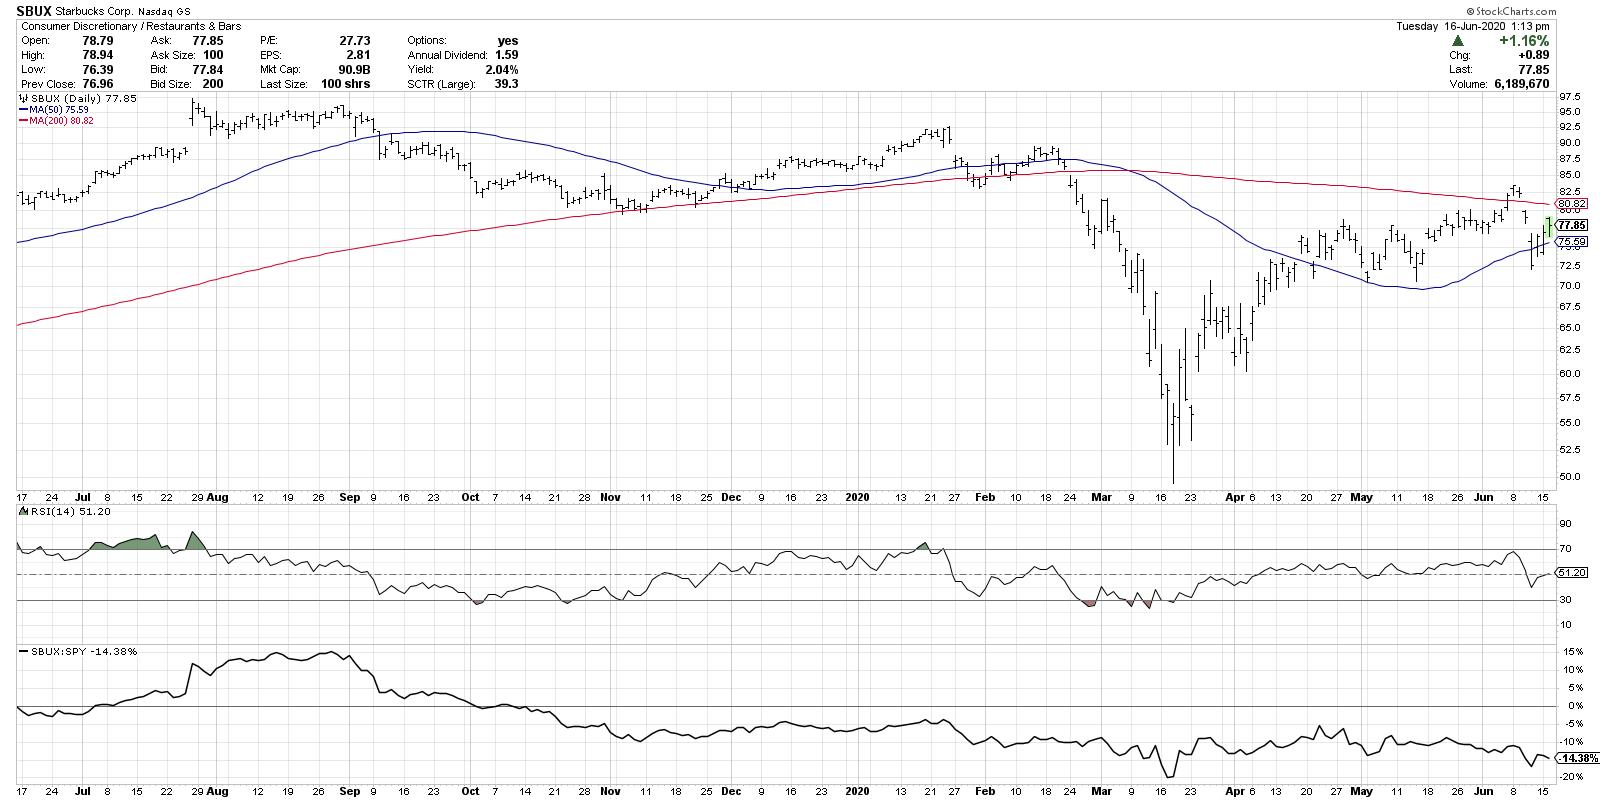
Peter Lynch's Radar: Stage #2

by Gatis Roze,
Author, "Tensile Trading"
Years ago, Peter Lynch (of Fidelity Magellan fame) preached that when looking for investment ideas, stock pickers should look closely where they shop and find those new alluring products and retail stores that held the most promise. Times change, of course, and the retail glass on the street is not...
READ MORE
MEMBERS ONLY

More Downside Ahead?
by Mary Ellen McGonagle,
President, MEM Investment Research
In this episode of StockCharts TV'sThe MEM Edge, Mary Ellen reviews the status of the broader markets and what to be on the lookout for. She also discusses early recovery plays in China that are now also taking place in the United States.
This video was originally recorded...
READ MORE
MEMBERS ONLY
How to Set Up Scans to Find Excellent Trading Opportunities

by John Hopkins,
President and Co-founder, EarningsBeats.com
Every day, there are thousands of companies to select from when looking for trading candidates. This includes companies in different sectors, of different sizes and with different prices. That's a lot of companies to choose from, so how does one go about zeroing in on the ones that...
READ MORE
