MEMBERS ONLY
Here's The Driving Force Behind My Bullishness

by Tom Bowley,
Chief Market Strategist, EarningsBeats.com
Market Recap for Monday, August 26, 2019
All eleven sectors advanced on Monday as U.S. equities staged a rally following Friday's selloff. It wasn't overly impressive in my view as most of the gains came at the opening bell. There wasn't much follow...
READ MORE
MEMBERS ONLY
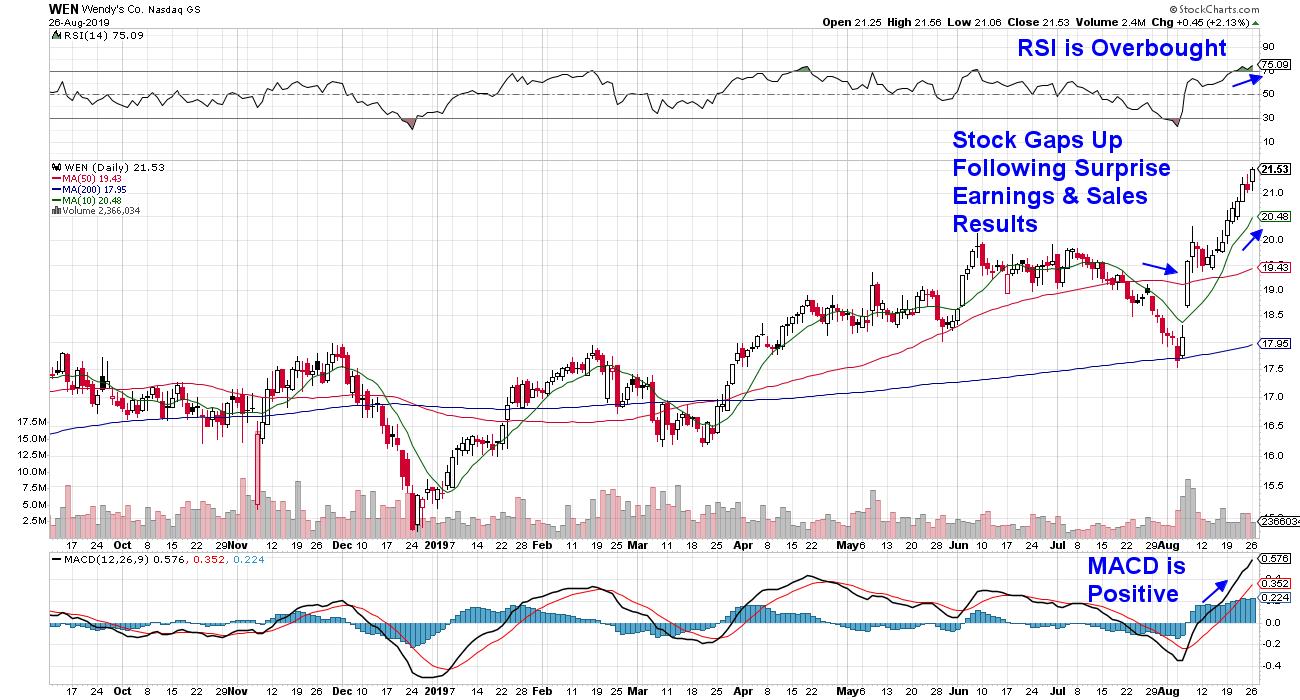
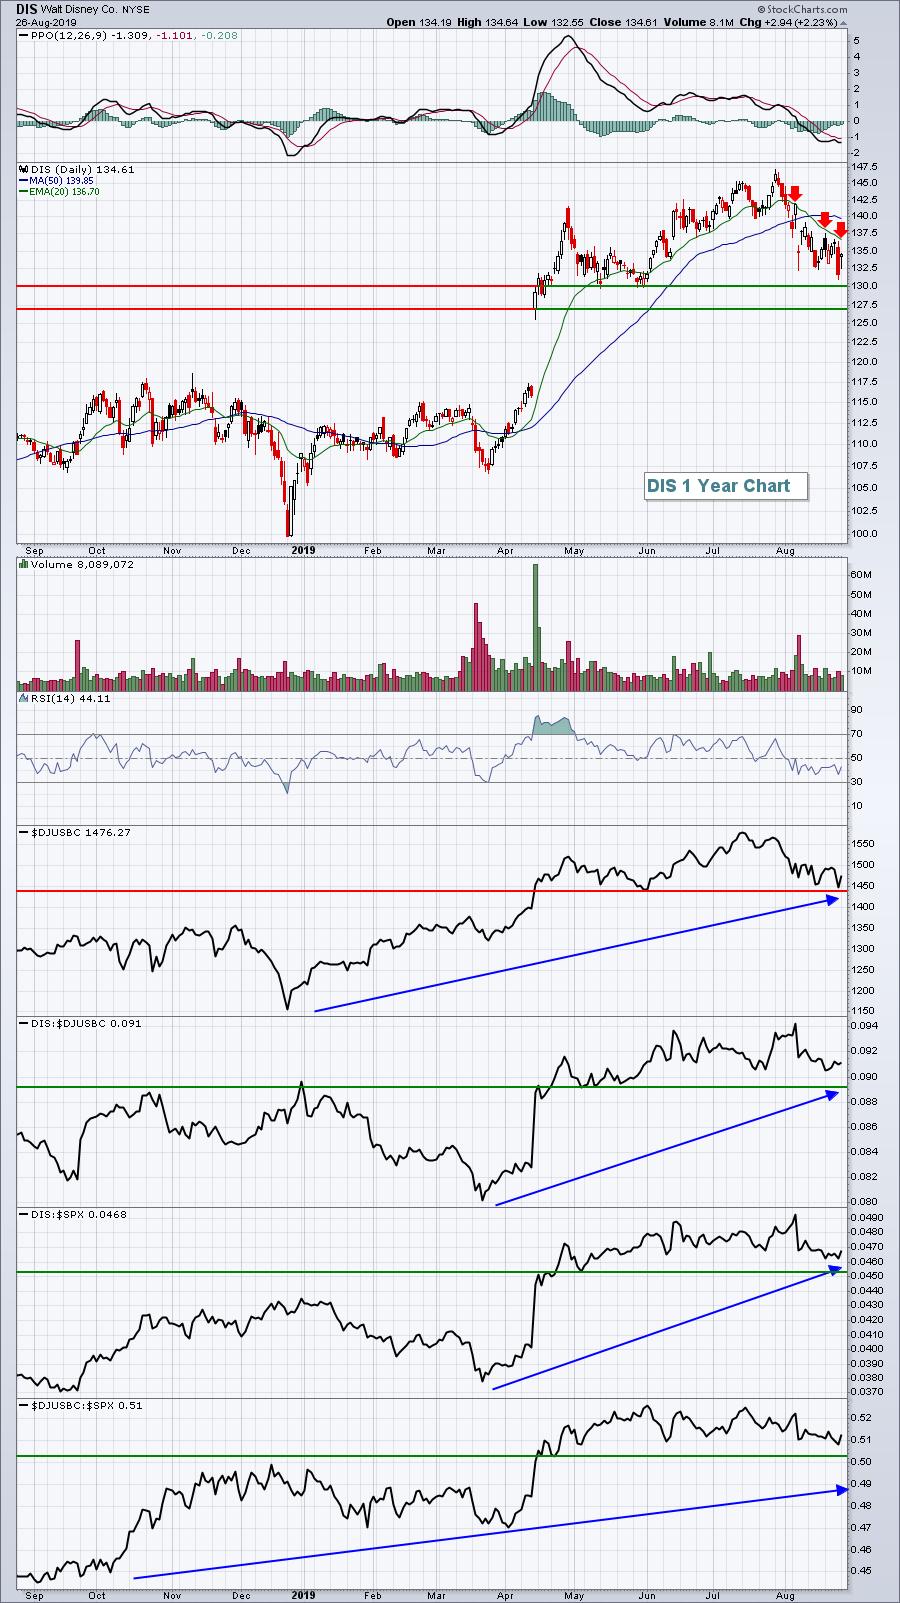
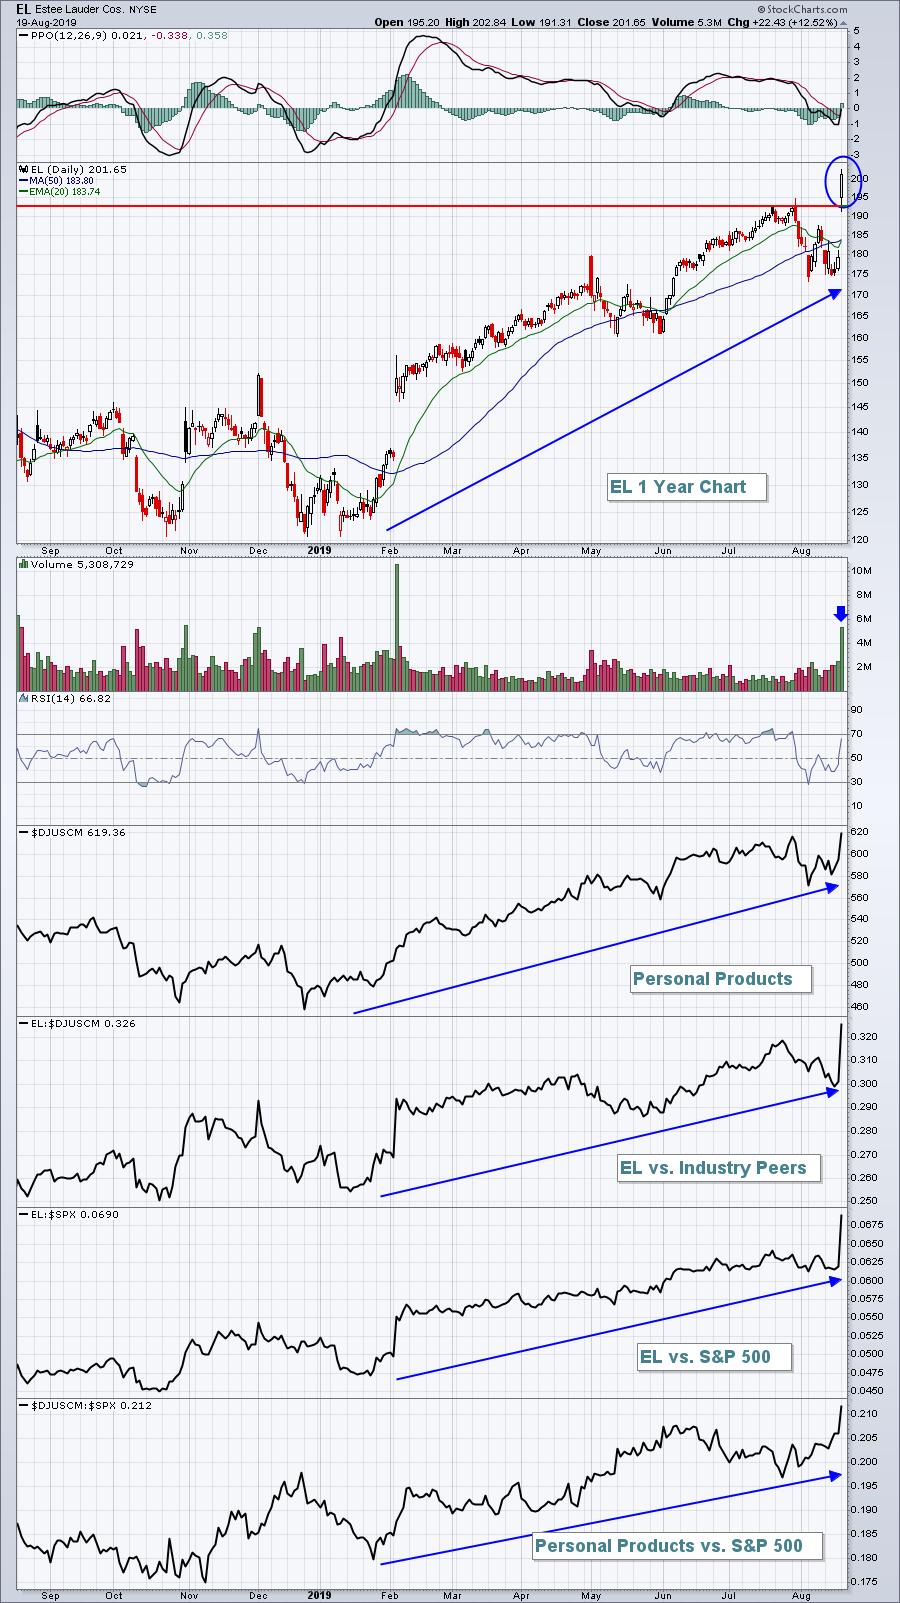
An "All-American" Pocket Of Strength In An Otherwise Tough Market.

by Mary Ellen McGonagle,
President, MEM Investment Research
There's nothing quite like a warm pumpkin spice latte (or a cold brew with a bucket of wings) to help ward off the anxiety of investing in the current markets. With August shaping up to be the most volatile month of the year, I'm gonna wager...
READ MORE
MEMBERS ONLY
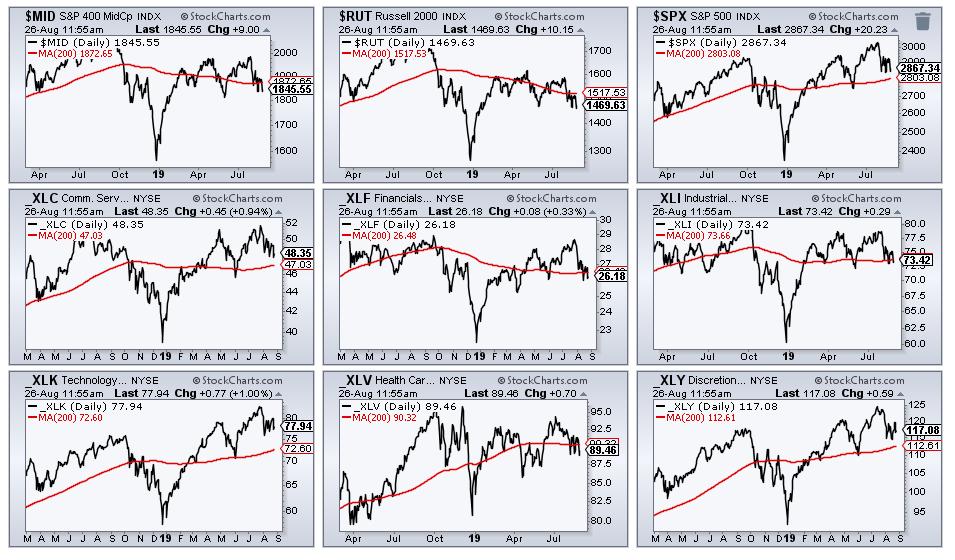
A Stable Stock in an Unstable Market

by Arthur Hill,
Chief Technical Strategist, TrendInvestorPro.com
The pickings are getting slim as the broader market destabilizes. The S&P 500 and Nasdaq 100 remain above their 200-day SMAs, but the S&P Mid-Cap 400 and Russell 2000 are below these key moving averages. The Consumer Discretionary SPDR (_XLY), Communication Services SPDR (_XLC) and Consumer...
READ MORE
MEMBERS ONLY

What do you want from me?

by Julius de Kempenaer,
Senior Technical Analyst, StockCharts.com
Rumour has it that a new show will be launching soon on StockCharts TV. The focus for this weekly 30-minute adventure will be on sectors, with yours truly as the host/presenter for this program (so you can count on a healthy dose of RRG-related content).
Don't worry,...
READ MORE
MEMBERS ONLY
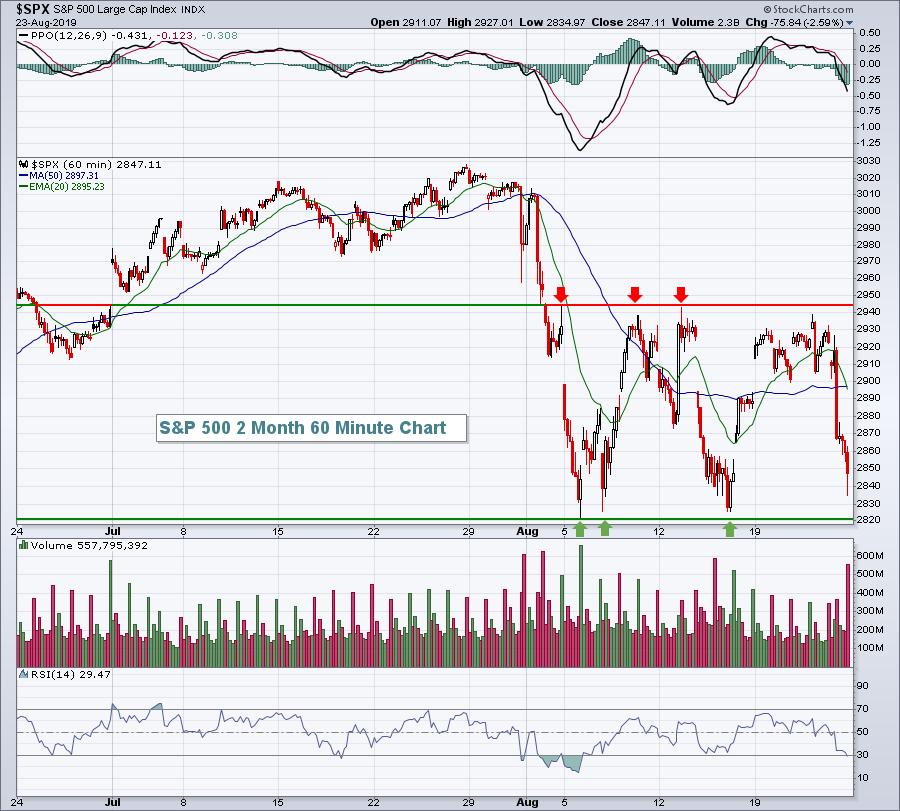
Trade War Escalates, Key Price Support Revisited
by Tom Bowley,
Chief Market Strategist, EarningsBeats.com
Market Recap for Friday, August 23, 2019
Friday was another trade war disaster. It's almost as if we're getting numb to it. Dow Jones down 600. Ho-hum. Technically, there wasn't even a short-term violation as the S&P 500 simply moved back down...
READ MORE
MEMBERS ONLY

SPY and QQQ Hit the Canvas - Again
by Arthur Hill,
Chief Technical Strategist, TrendInvestorPro.com
Stocks were hit hard in early August with SPY and QQQ falling six to seven percent in six days. These declines started from new highs in late July, which is when these prizefighters were at peak performance. The sharpness of the declines is like a prizefighter getting blindsided and knocked...
READ MORE
MEMBERS ONLY
Week Ahead: Intermittent Pullbacks Likely; Broader Structure Continues To Remain Tentative

by Milan Vaishnav,
Founder and Technical Analyst, EquityResearch.asia and ChartWizard.ae
The past week generally went along the anticipated lines. The broader structure of the markets continued to be weak; it faced severe volatility during the past trading days and faced heavy selling pressure at higher levels. After a thoroughly volatile week, the headline index ended with a net loss of...
READ MORE
MEMBERS ONLY
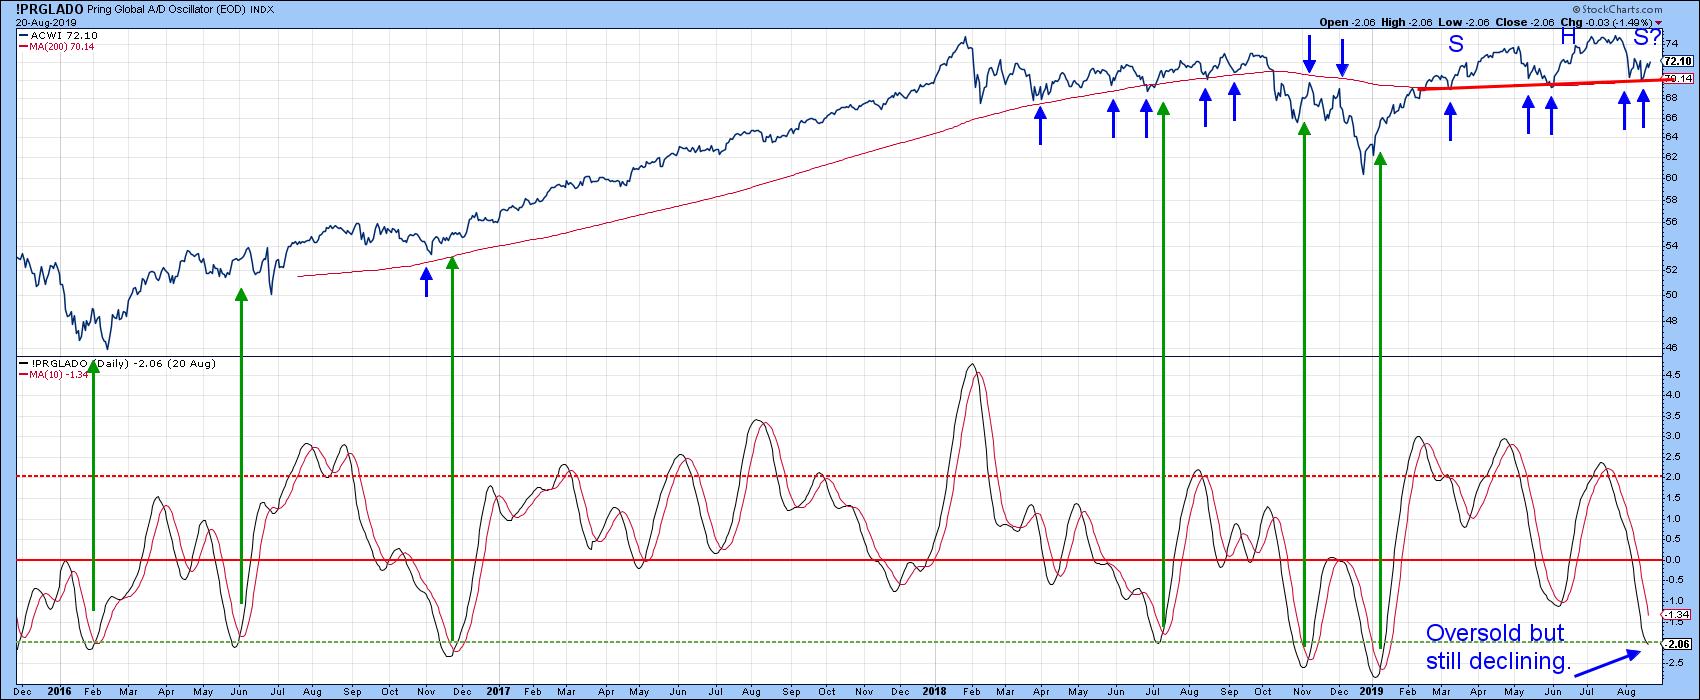
Trick or Treat for Global Equities?

by Martin Pring,
President, Pring Research
Editor's Note: This article was originally published in Martin Pring's Market Roundup on Wednesday, August 21st at 9:36pm ET.
During my many decades in this business, I have never heard of a recession so well-advertised as the one we are witnessing currently. It's...
READ MORE
MEMBERS ONLY
Introducing "WealthWise Women" and the Pink Line

by Erin Swenlin,
Vice President, DecisionPoint.com
Last week, Mary Ellen McGonagle and I had the pleasure of speaking at The Money Show as part of the "Women on Wealth" panel, where we discussed how we can bring women to the "investment table" through education, engagement and empowerment. The presentation was unexpectedly powerful...
READ MORE
MEMBERS ONLY
Here's to the Future!

by John Hopkins,
President and Co-founder, EarningsBeats.com
Recently, Tom Bowley announced to the StockChartscommunity that he will soon bereturning to his "roots"atEarningsBeats.com. When Tom first approached me with the idea, I let out a big "Woohoo!". In all seriousness, it was a joyful day for me, as Tom and I go...
READ MORE
MEMBERS ONLY
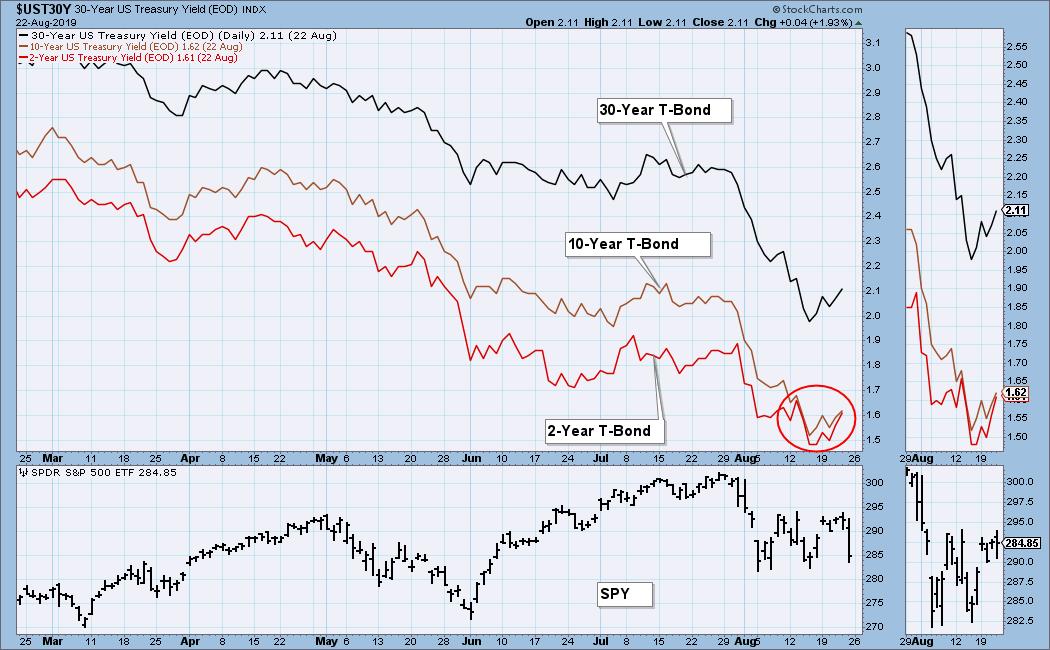
DP WEEKLY WRAP: Inversion Aversion; Failed Double Bottom

by Carl Swenlin,
President and Founder, DecisionPoint.com
The oft-referenced "yield curve" refers to the relationship between the yield of the 10-Year T-Bond and the 2-Year T-Bond. Logically, the longer-term instrument should have the higher yield, but this week the 2-Year yield popped slightly above the 10-Year yield on a few occasions intraday. As could be...
READ MORE
MEMBERS ONLY

Investing With Metaphors: These Three Are Giants!

by Gatis Roze,
Author, "Tensile Trading"
A personal secret: investing with metaphors has always enlightened and disciplined me, helping me grow as an individual investor. One of the most fertile areas for applying this axiom has been car collecting since, much like investing, it's never black and white. The reality is that both are...
READ MORE
MEMBERS ONLY

Bonds, Gold, the PPO and Extreme Conditions
by Arthur Hill,
Chief Technical Strategist, TrendInvestorPro.com
The 20+ YR T-Bond ETF (TLT) and Gold SPDR (GLD) are on a tear, but they are getting stretched by one key metric and could be ripe for a corrective period.
There are numerous ways to measure overbought (extended) conditions. Indicators like RSI (above 70) and the Stochastic Oscillator (above...
READ MORE
MEMBERS ONLY
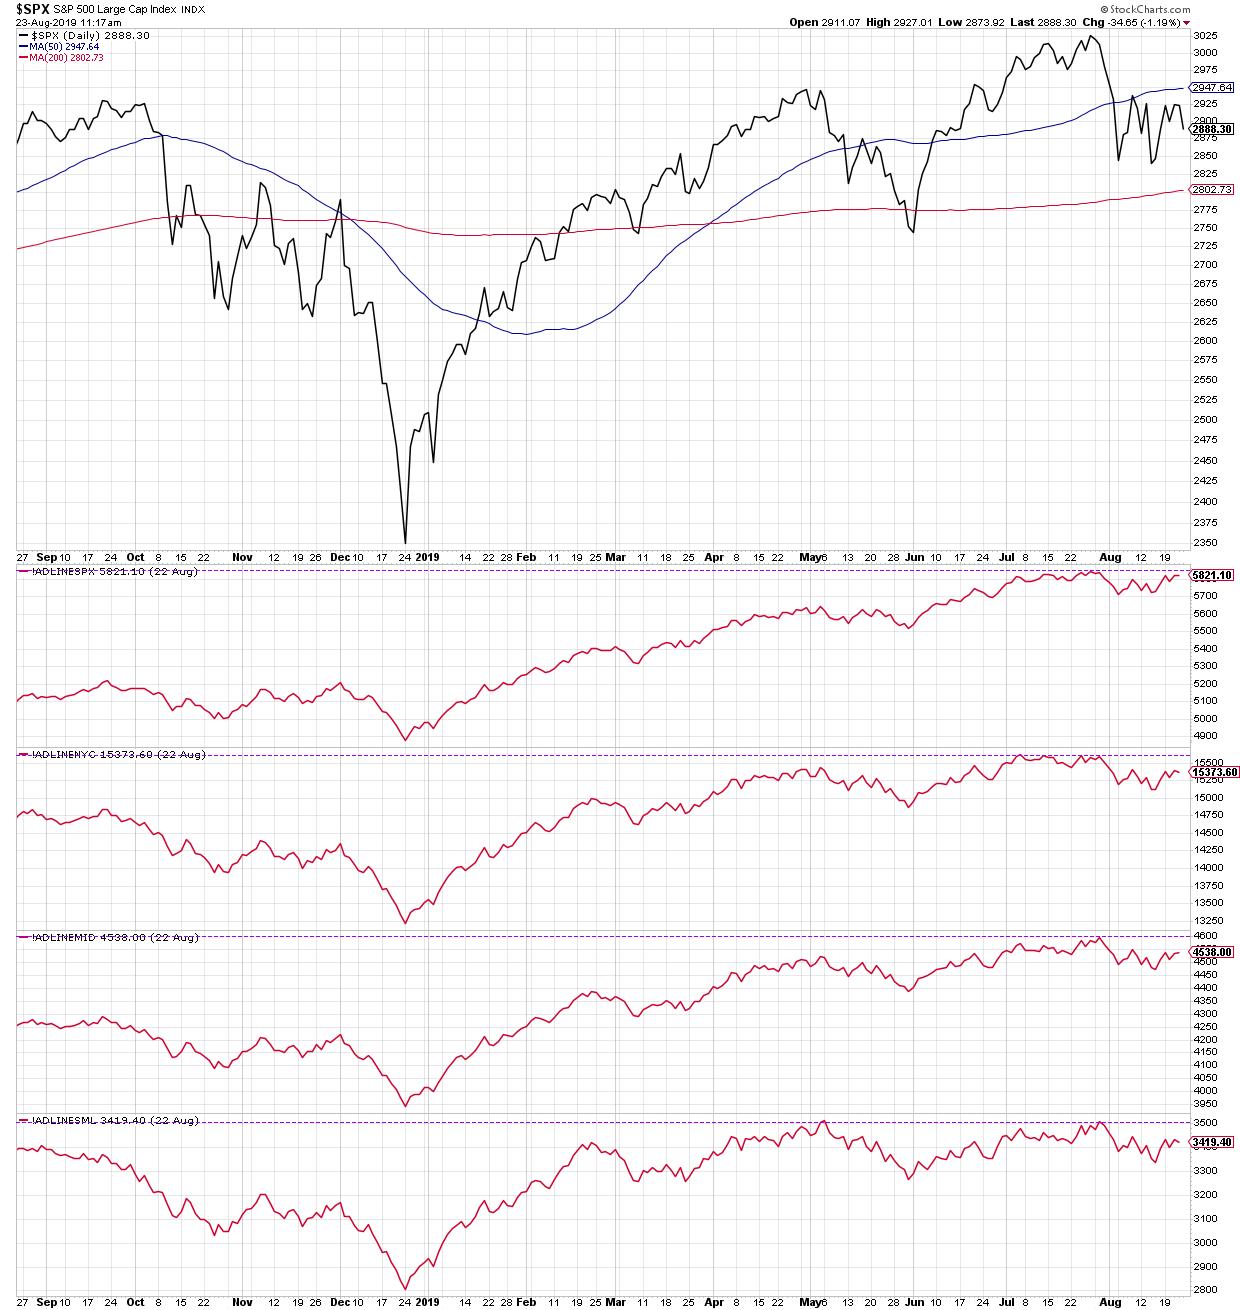
The One Chart: Banking on Breadth

by David Keller,
President and Chief Strategist, Sierra Alpha Research
Any time I have a chance to interview other market strategists, I like to ask them about their One Chart. That is, "What's the one chart that you think is the best tell on the markets right now."
To rephrase, if you could only have one...
READ MORE
MEMBERS ONLY

State of the Stock Market - Meet Mr. Split
by Arthur Hill,
Chief Technical Strategist, TrendInvestorPro.com
The performance for the S&P 500, S&P Mid-Cap 400 and S&P Small-Cap 600 over the last 3, 6, 9 and 12 months pretty much says it all. The S&P 500 is positive on all four timeframes, the S&P Small-Cap 600...
READ MORE
MEMBERS ONLY
Summing Up The Transportation Group And Its Impact
by Tom Bowley,
Chief Market Strategist, EarningsBeats.com
Market Recap for Thursday, August 22, 2019
U.S. equities began Thursday on mostly a positive note, but reservations from Fed officials and a manufacturing report that showed weakness weighed on sentiment as stocks gave back earlier gains, finishing mixed. The Dow Jones was able to end the session in...
READ MORE
MEMBERS ONLY

Technology Could Hold the Key Going Forward
by Arthur Hill,
Chief Technical Strategist, TrendInvestorPro.com
As noted in a separate commentary, the State of the Stock Market is shaky. The Technology sector is holding up, but we are seeing weakness within Finance, Consumer Discretionary, Industrials and Communication Services. The Technology sector is the biggest sector in the S&P 500 SPDR (22%) and EW...
READ MORE
MEMBERS ONLY
Target And Lowes Deliver The Goods; Equities Surge
by Tom Bowley,
Chief Market Strategist, EarningsBeats.com
Market Recap for Wednesday, August 21, 2019
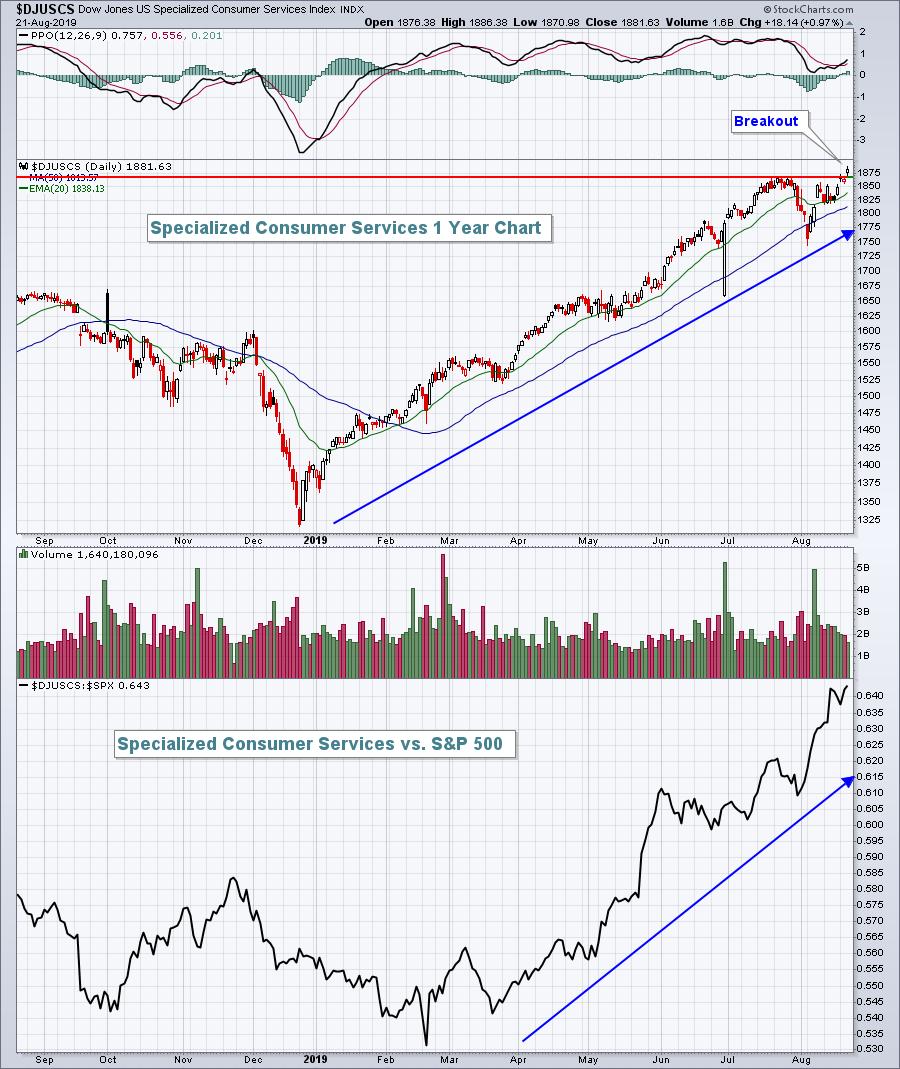
It was a big day for broadline retail ($DJUSRB, +1.91%) and home improvement ($DJUSHI, +3.68%) as strong earnings from Target (TGT, +20.43%) and Lowes Companies (LOW, +10.35%), respectively, sent both groups higher, along with the overall market. All of...
READ MORE
MEMBERS ONLY
Here Is a Leading Stock In The Semiconductor Group
by Julius de Kempenaer,
Senior Technical Analyst, StockCharts.com
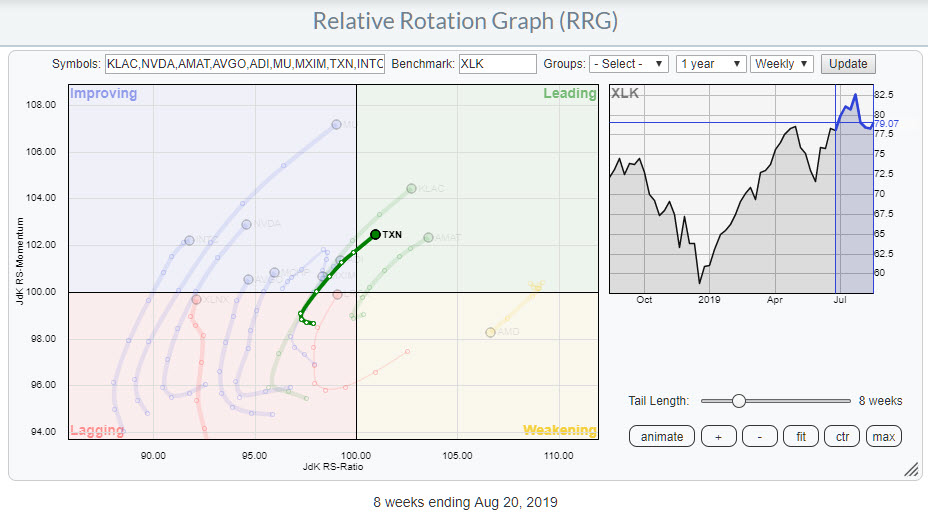
Yesterday, I wrote about the Technology sector in my RRG Charts blog, where I discussed how the semiconductor stocks as a group showed relative strength against XLK. For this DITC article, I want to work off that subset of stocks in the technology space.
The Relative Rotation Graph above shows...
READ MORE
MEMBERS ONLY

If It's Trick Or Treat In The Equity Market, I'll Take The Treat
by Martin Pring,
President, Pring Research
* Trick or Treat for Global Equities?
* Several Reliable US Short-Term Indicators Turning Bullish
During my many decades in this business, I have never heard of a recession so well-advertised as the one we are witnessing currently. It's a fact that financial market events that are widely expected rarely...
READ MORE
MEMBERS ONLY

DP Mid-Week Alert: Dow Loses IT PMO Buy - Indicators Moving Bullish
by Erin Swenlin,
Vice President, DecisionPoint.com
The market continues to churn and consolidate sideways this week. The good news is that our indicators are starting to perk up. As of last Friday, the Dow generated a new IT Price Momentum Oscillator (PMO) SELL signal. Basically, the weekly PMO dropped below its signal on Friday. Amazingly, the...
READ MORE
MEMBERS ONLY
Tuesday's Weak Close Has Very Little Impact On Market Outlook
by Tom Bowley,
Chief Market Strategist, EarningsBeats.com
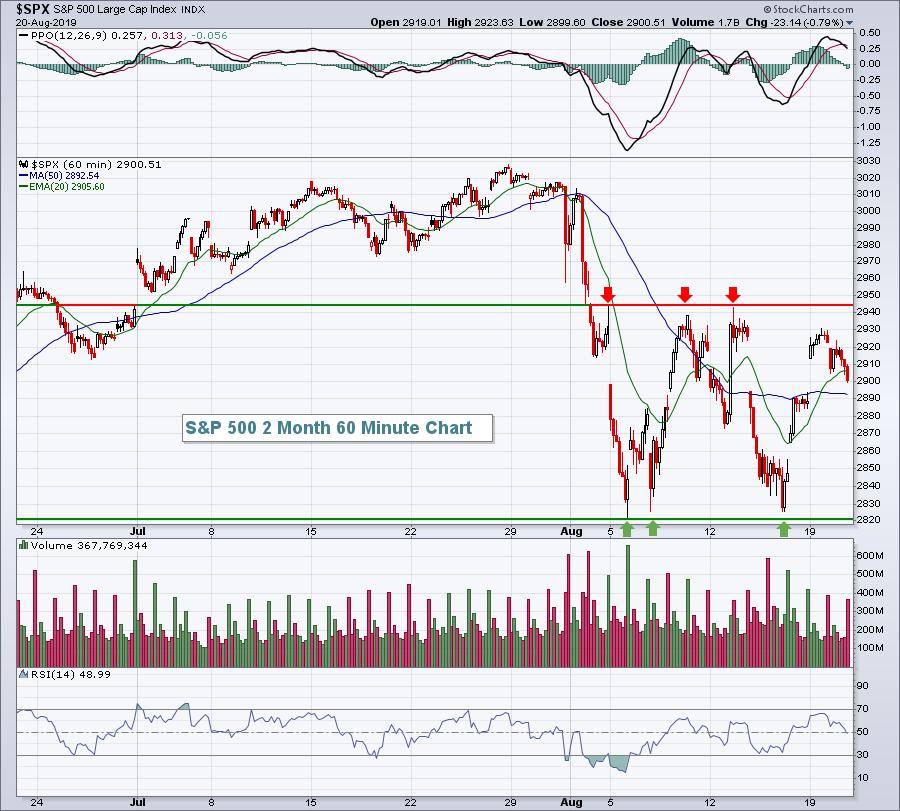
Market Recap for Tuesday, August 20, 2019
It was another day of consolidation for U.S. equities. That's not a bad thing. Let's establish a base, allowing the weak hands to get out before the next push higher. If we break those recent lows, we'...
READ MORE
MEMBERS ONLY
Strong Rotation for Technology Sector With a Positive RRG-Heading on Semiconductors
by Julius de Kempenaer,
Senior Technical Analyst, StockCharts.com
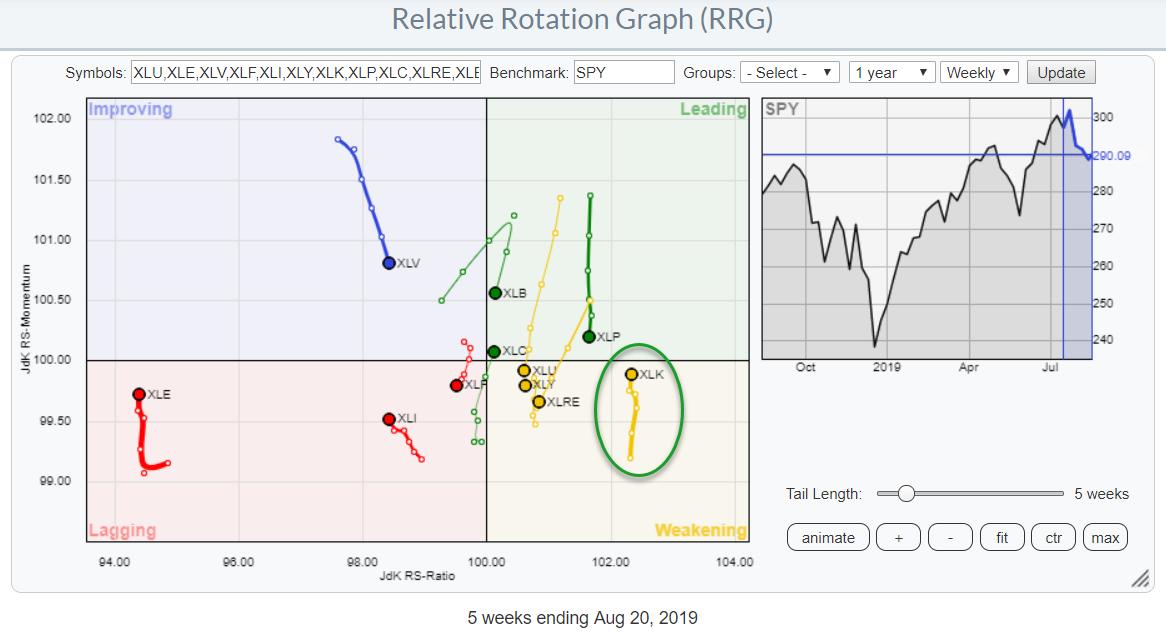
On the weekly Relative Rotation Graph, the Technology sector is currently inside the weakening quadrant, but is moving almost vertically up towards the leading quadrant. That is to say, it's moving back to the leading quadrant, as it already completed a strong rotation through that leading quadrant from...
READ MORE
MEMBERS ONLY
Mirror, Mirror on the Wall, What's the Strongest Industry Group ETF of All?
by Arthur Hill,
Chief Technical Strategist, TrendInvestorPro.com
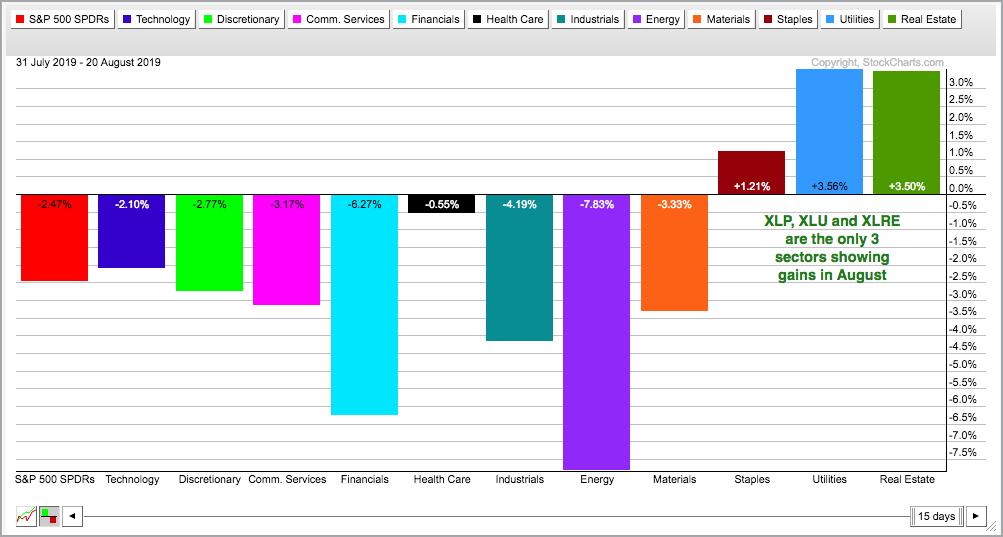
Taking a top-down approach to the stock market, we can break down the major indexes into sectors, the sectors into industry groups and the industry groups into individual stocks. There are eleven sector SPDRs and three clear leaders. The Utilities SPDR (XLU) and Real Estate SPDR (XLRE) hit new highs...
READ MORE
MEMBERS ONLY
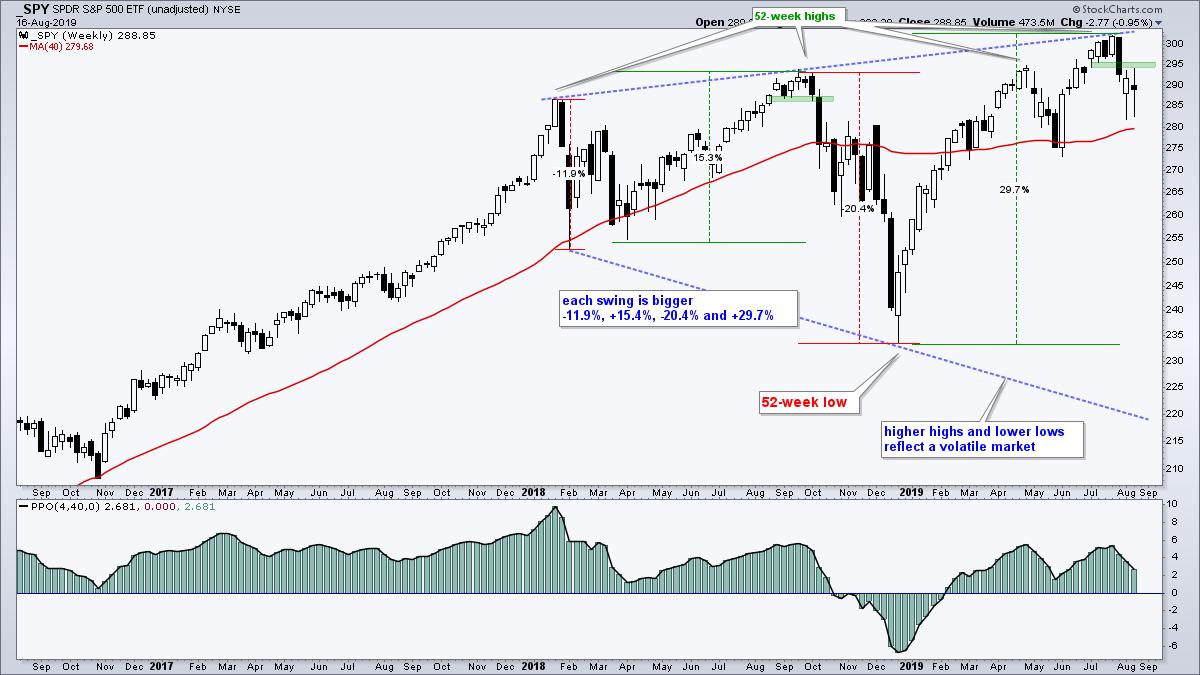
A Birds-Eye View Of The S&P 500 Weekly Chart; The Bulls Are In Charge
by Tom Bowley,
Chief Market Strategist, EarningsBeats.com
Market Recap for Monday, August 19, 2019
The S&P 500 rallied for a third consecutive day, this time rising 1.21% and closing back above its 20 day EMA for the first time in August. The other major indices also rallied, including leadership from the NASDAQ and Russell...
READ MORE
MEMBERS ONLY
Measuring Risk On/Off with Stocks, Treasuries, Junk Bonds, Low Volatility and High Beta
by Arthur Hill,
Chief Technical Strategist, TrendInvestorPro.com
Volatility is clearly on the uptick with the S&P 500 SPDR (SPY) moving more than 1% nine times since July 31st. This follows a period from early June to late July when the 1-day Rate-of-Change exceeded 1% just once, and the market moved steadily higher. Ah, the good...
READ MORE
MEMBERS ONLY
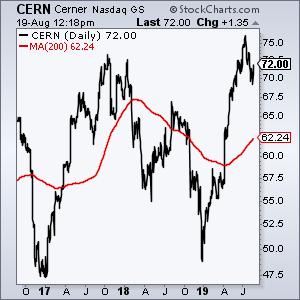
A Breakout for this Healthcare/Technology Hybrid
by Arthur Hill,
Chief Technical Strategist, TrendInvestorPro.com
Some stocks fit nicely into sectors and industry groups. And some don't. Cerner (CERN) is part of the Health Care SPDR (XLV), but it is really a technology stock that serves the healthcare industry. Namely, Cerner provides information technology solutions for the healthcare industry. More importantly, the price...
READ MORE
MEMBERS ONLY
A Mystery Group Emerges To Lead Friday's Stock Market Rally
by Tom Bowley,
Chief Market Strategist, EarningsBeats.com
Special Event Today
Every quarter, I announce my Top 10 Stocks (equally-weighted) for my Model, Aggressive and Income portfolios. Today's the day! It all starts at 4:30pm EST. CLICK HERE for portfolio performance and registration information.
Market Recap for Friday, August 16, 2019
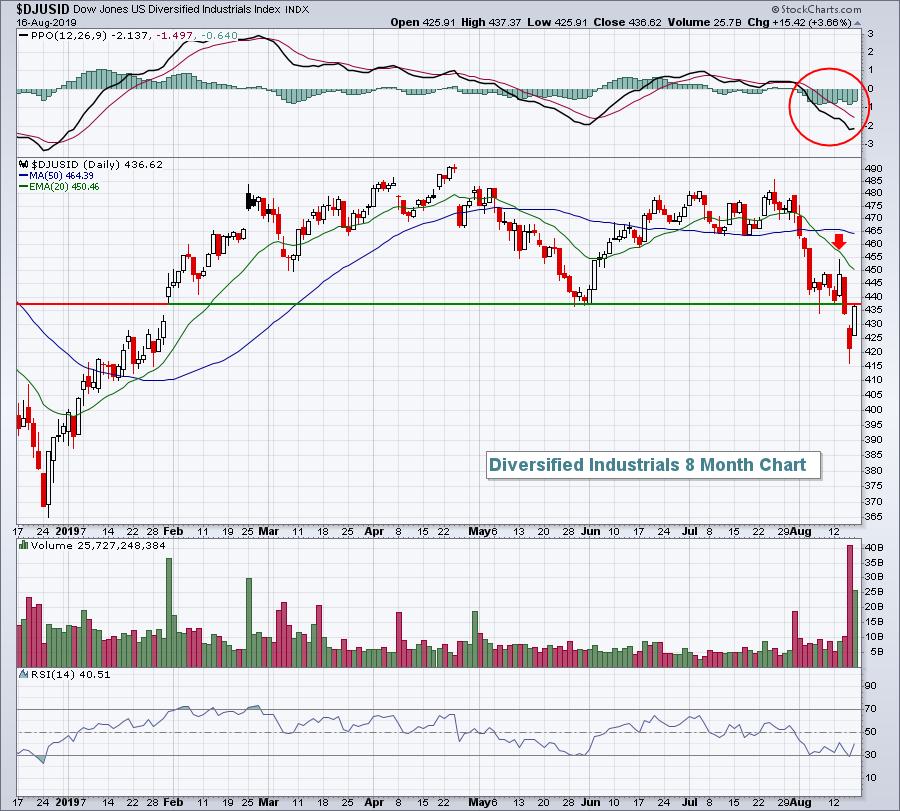
Industrials (XLI, +1.93%...
READ MORE
MEMBERS ONLY

The Truth About the Yield Curve, The Economy and The Stock Market
by Martin Pring,
President, Pring Research
* Yield Curve Inversion and Recessions
* Using the Economy to Forecast the Economy
* What Happens to the Stock Market after an Initial Inversion?
* Yield Curve Conclusion
* Catch a Falling Knife, Anyone?
By now, everyone and his dog is aware that the yield curve has inverted. An event such as this is...
READ MORE
MEMBERS ONLY
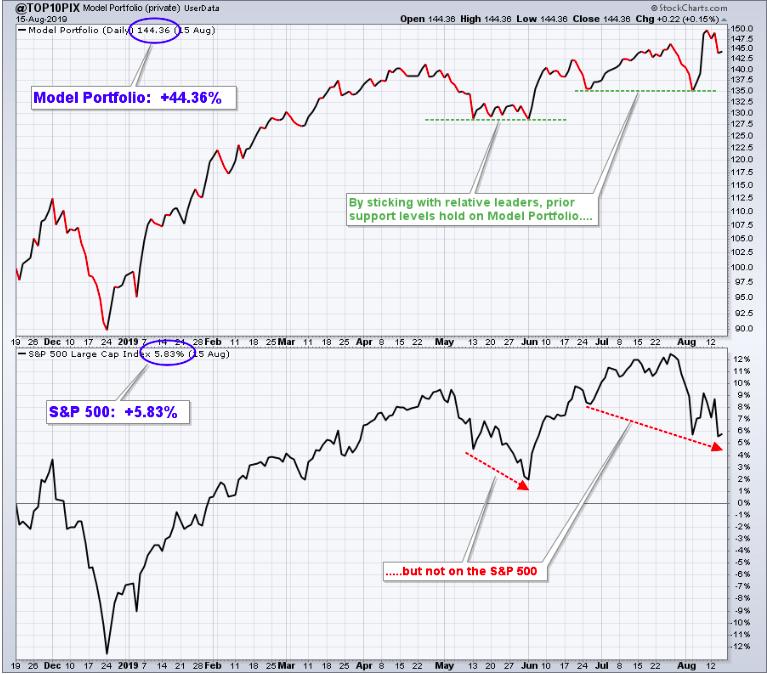
The Results Are In, Here Are The Winners And Losers
by Tom Bowley,
Chief Market Strategist, EarningsBeats.com
Monday will mark the end of my third quarter of performance for the Model Portfolio. I've easily surpassed the benchmark S&P 500 in each quarter and this last quarter was certainly no exception. The average return of the 10 equal-weighted stocks in this portfolio was 12....
READ MORE
MEMBERS ONLY
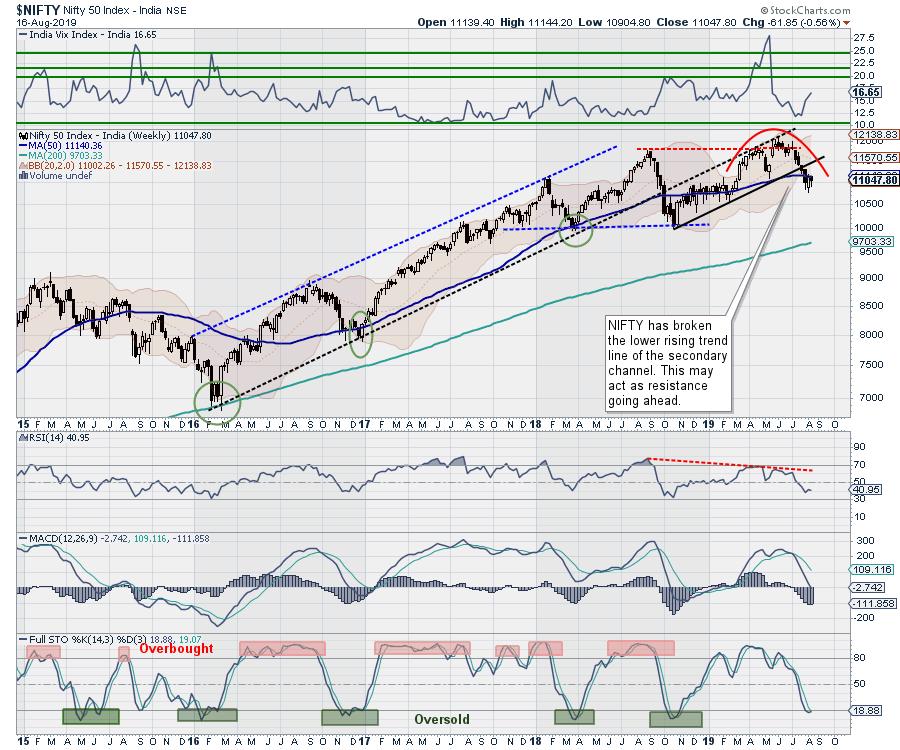
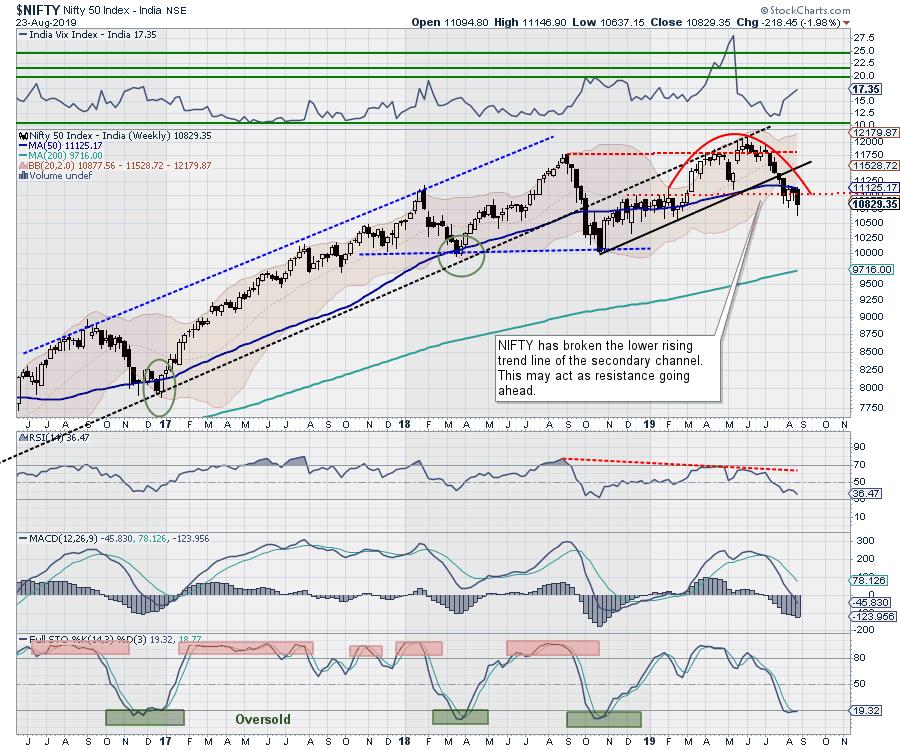
Week Ahead: With Nifty Vulnerable At Higher Levels, These Sectors May Act As Safe Havens
by Milan Vaishnav,
Founder and Technical Analyst, EquityResearch.asia and ChartWizard.ae
With a 3-day working week, the markets moved along expected lines and stayed within a limited range. As anticipated, the NIFTY did not make any directional move, remaining within the 50-Week MA and 100-Week MA (as mentioned in our previous weekly note). After flirting with the 50-Week MA, which stands...
READ MORE
MEMBERS ONLY
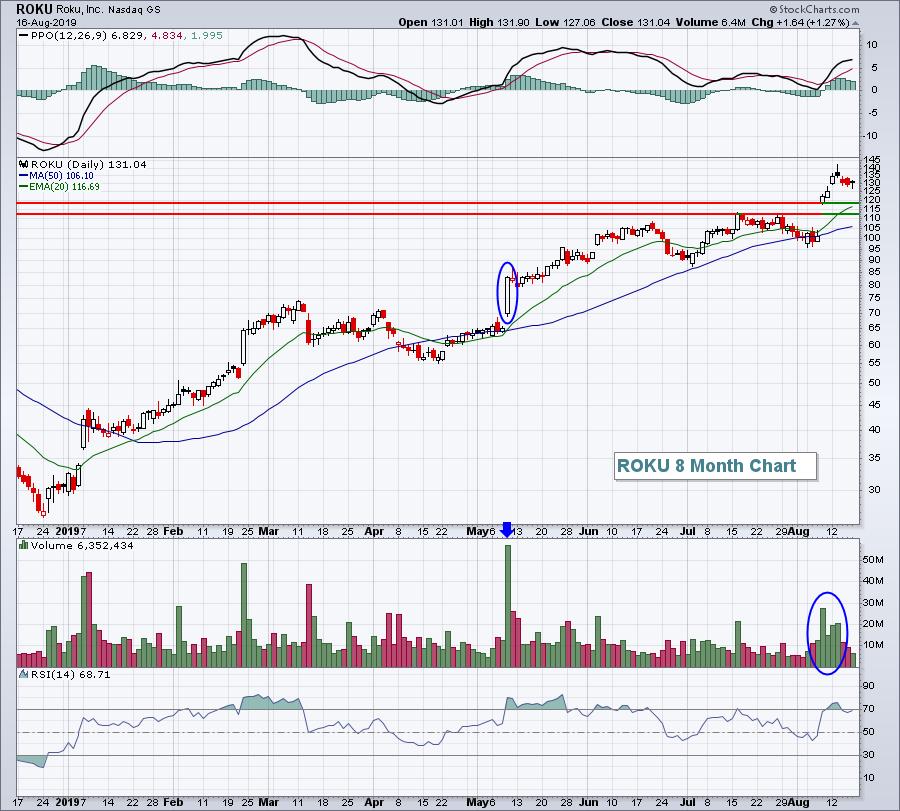
Preparing For Nice Returns - 3 Stocks For Your Watchlist
by Mary Ellen McGonagle,
President, MEM Investment Research
The volatility in the markets remains as investors continue to grapple with the latest global headline. With defensive areas of the market generally posting positive results, other areas are struggling to regain their footing following sharp selloffs.
Overall, cautiousness is still warranted, as the broader Indexes remain below key levels...
READ MORE
MEMBERS ONLY
A Bounce, a Second Shoe or a Broadening Formation?
by Arthur Hill,
Chief Technical Strategist, TrendInvestorPro.com
Stocks rebounded on Friday with small-caps leading the way. The Russell 2000 surged 2.19%, while the S&P 500 advanced 1.44% and the Nasdaq 100 gained 1.59%. Despite these sizable rebounds, all three were down for the week and still down between 4.5% and 5....
READ MORE
MEMBERS ONLY
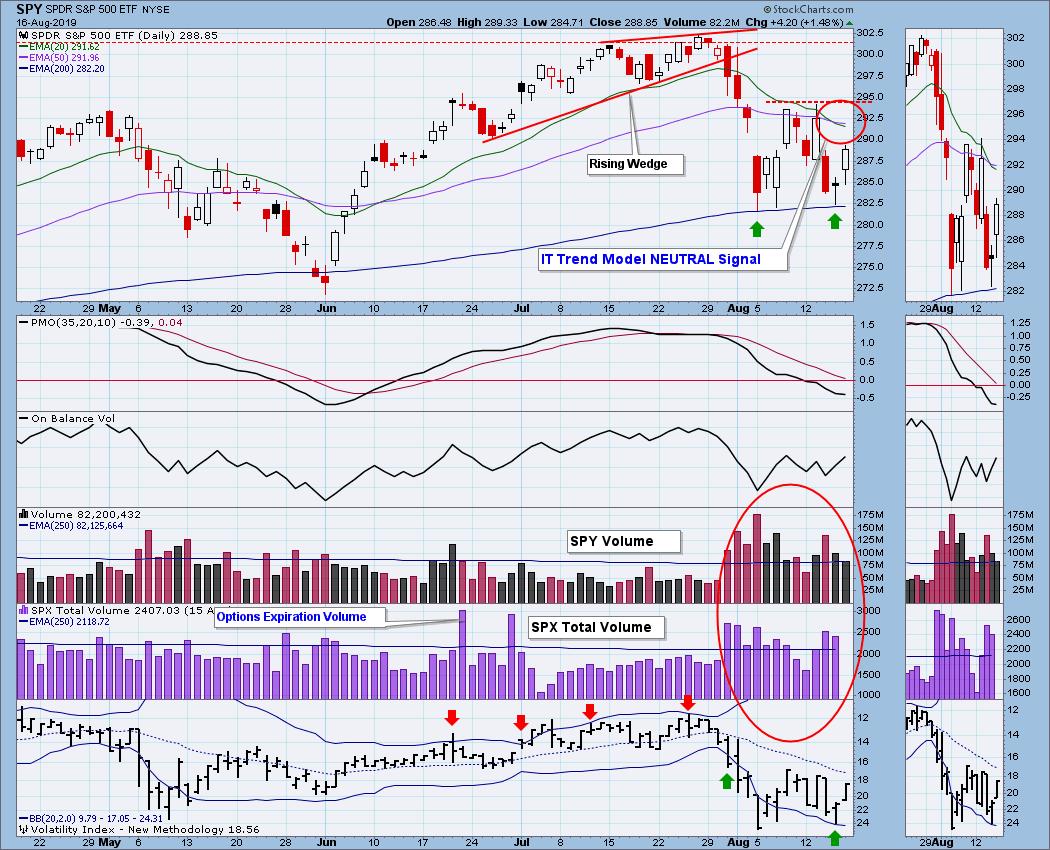
DP WEEKLY WRAP: All That Drama for a Net Change of Less Than One Percent for the Week
by Carl Swenlin,
President and Founder, DecisionPoint.com
On the last trading day of July the market (SPY) resolved a rising wedge pattern with the expected breakdown, and that began what has turned out to be a very turbulent August. (Note how the volume for almost every day has exceeded the one-year average.) After an initial decline of...
READ MORE
MEMBERS ONLY
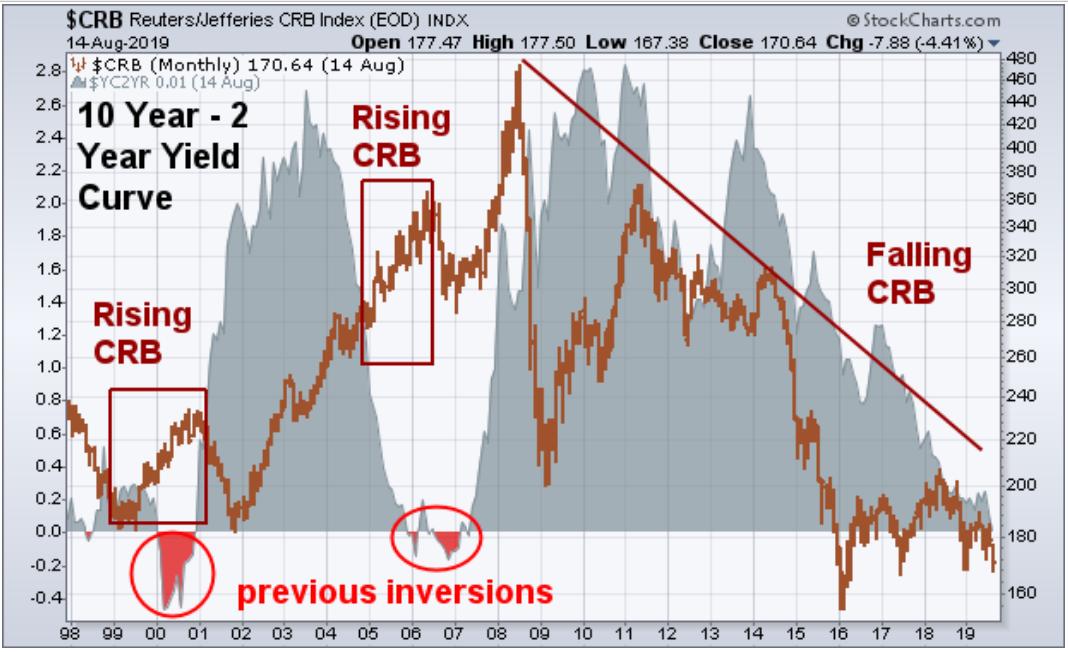
Previous Bond Yield Inversions Saw Rising Commodities - This Time is Different

by John Murphy,
Chief Technical Analyst, StockCharts.com
Editor's Note: This article was originally published in John Murphy's Market Message on Thursday, August 15th at 3:47pm ET.
Everyone's talking about inverted yield curves. The 10 year - 3 month yield curve turned negative a few months ago. The 10 year -...
READ MORE
MEMBERS ONLY

Relative Rotation Graphs Can Show You So Much More Than Just Sector Rotation
by Julius de Kempenaer,
Senior Technical Analyst, StockCharts.com
Relative Rotation Graphs, or "RRGs", were born while I was working as a sell-side analyst for an investment bank in Amsterdam, doing research and making calls on stocks and sectors. The clientele of the bank were all institutional investors, ranging from pension funds and endowments to hedge funds....
READ MORE
MEMBERS ONLY
Returning To My Roots At EarningsBeats.com
by Tom Bowley,
Chief Market Strategist, EarningsBeats.com
Wow, it's been a great ride here at StockCharts.com!
I posted essentially this same article in my Trading Places blog a week ago, but I'm not sure how many of you follow me there. I want to make sure I reach out to everyone who...
READ MORE
MEMBERS ONLY
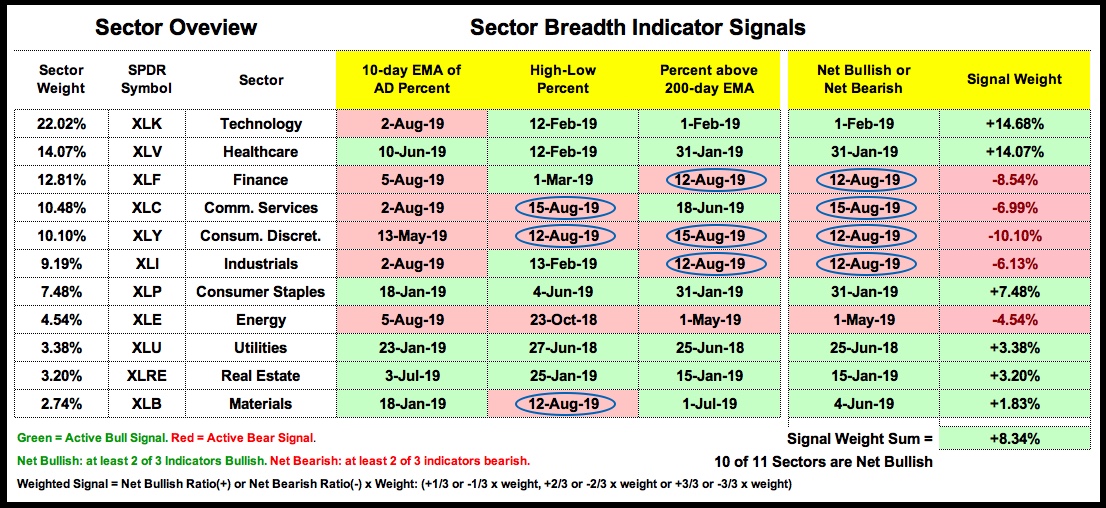
Ranking the 11 Sector SPDRs and Weighing the Breadth Evidence
by Arthur Hill,
Chief Technical Strategist, TrendInvestorPro.com
Sector Breadth Model Takes another Hit
Today I will rank and analyze the charts for the eleven sector SPDRs, but I will first cover the sector breadth table, which reflects the internal strength/weakness within each sector. Sometimes there is a discrepancy between the sector SPDR chart and the breadth...
READ MORE
MEMBERS ONLY
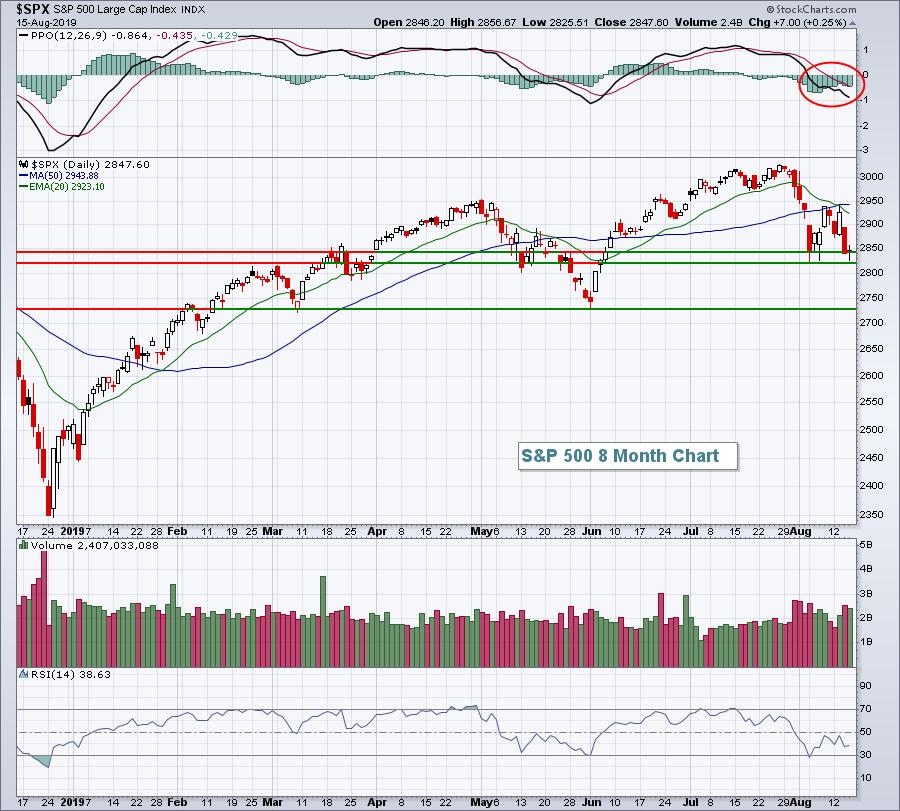
Why Looking At Germany Provides Us An S&P 500 Crystal Ball
by Tom Bowley,
Chief Market Strategist, EarningsBeats.com
Market Recap for Thursday, August 15, 2019
There were a ton of economic reports out on Thursday, mostly positive, and that seemed to slow the onslaught of selling as our major indices finished mixed on the session. Walmart, Inc. (WMT, +6.11%) surged following better-than-expected earnings to lift the Dow...
READ MORE
MEMBERS ONLY

COMMODITY DECLINE SHOWS DEFLATIONARY TREND -- PREVIOUS BOND YIELD INVERSIONS SAW RISING COMMODITIES -- THIS TIME IS DIFFERENT
by John Murphy,
Chief Technical Analyst, StockCharts.com
DEFLATIONARY COMMODITY TREND... My earlier message today showed that bond yields and stocks have been trending in the same direction for most of the last two decades. It further explained that deflationary tendencies around the start of the new century changed the bond-stock relationship that existed prior to that. Plunging...
READ MORE