MEMBERS ONLY
How to Use the 4 MA for Better Timing in Trading & Investing

by Joe Rabil,
President, Rabil Stock Research
In this video, Joe demonstrates how to apply the 4 simple moving average (4 MA) as both a short-term trading tool and a longer-term timing guide. He explains how this moving average can help identify opportunities, manage pullbacks, and improve decision-making across multiple time frames. Joe then...
READ MORE
MEMBERS ONLY
S&P 500 Breakouts, Bitcoin Risks & Uber’s Next Move

by Frank Cappelleri,
Founder & President, CappThesis, LLC
In this market update, Frank takes a close look at the S&P 500, key indices, ETFs, crypto, and a recent trade idea. Frank compares the 2025 market to 2020 patterns, reviewing corrections and highlighting bullish and bearish setups. He focuses on weekly Bollinger Bands, GoNoGo charts, sector performance...
READ MORE
MEMBERS ONLY

Financials and Industrials Are Key to the Rally as Tech Takes a Breather
What to watch ahead of Powell: S&P 500 RSI divergence, NVDA under 20-day MA, key levels at 6212/6025/5852; can Financials and Industrials lead?...
READ MORE
MEMBERS ONLY

Tech Stumbles, Market Widens: What Savvy Investors Should Watch Now

by Jayanthi Gopalakrishnan,
Director of Site Content, StockCharts.com
Tech stocks wobble while other sectors firm up. Learn how breadth, equal-weight trends, and small/mid-cap strength can guide your investment decisions....
READ MORE
MEMBERS ONLY

StockCharts Insider: What’s the Deal with the S&P 100, 400, and 600 in the Market Summary?

by Karl Montevirgen,
The StockCharts Insider
Before We Dive In…
Have you ever wondered why the S&P 100, 400, and 600 show up in the Market Summary? They serve a purpose, mainly to give you a quick read on investor sentiment: whether Wall Street is favoring large-, mid-, or small-caps. Today, I’m...
READ MORE
MEMBERS ONLY

Bitcoin Fails at a New All-Time High; What’s Next?

by Martin Pring,
President, Pring Research
Earlier this summer, I pointed out that Bitcoin had experienced a bearish shooting star on the day it experienced a new all-time high, and noted that this probably foreshadowed some short-term weakness. I pointed out that no damage whatsoever had been done to the basic uptrend, as the...
READ MORE
MEMBERS ONLY

Jackson Hole 2025: Investors Stay Calm as Bond Volatility Hits Lows
Despite rising inflation pressures and fresh Fed minutes, Treasury volatility and credit spreads remain near multi-year lows ahead of Powell’s speech....
READ MORE
MEMBERS ONLY
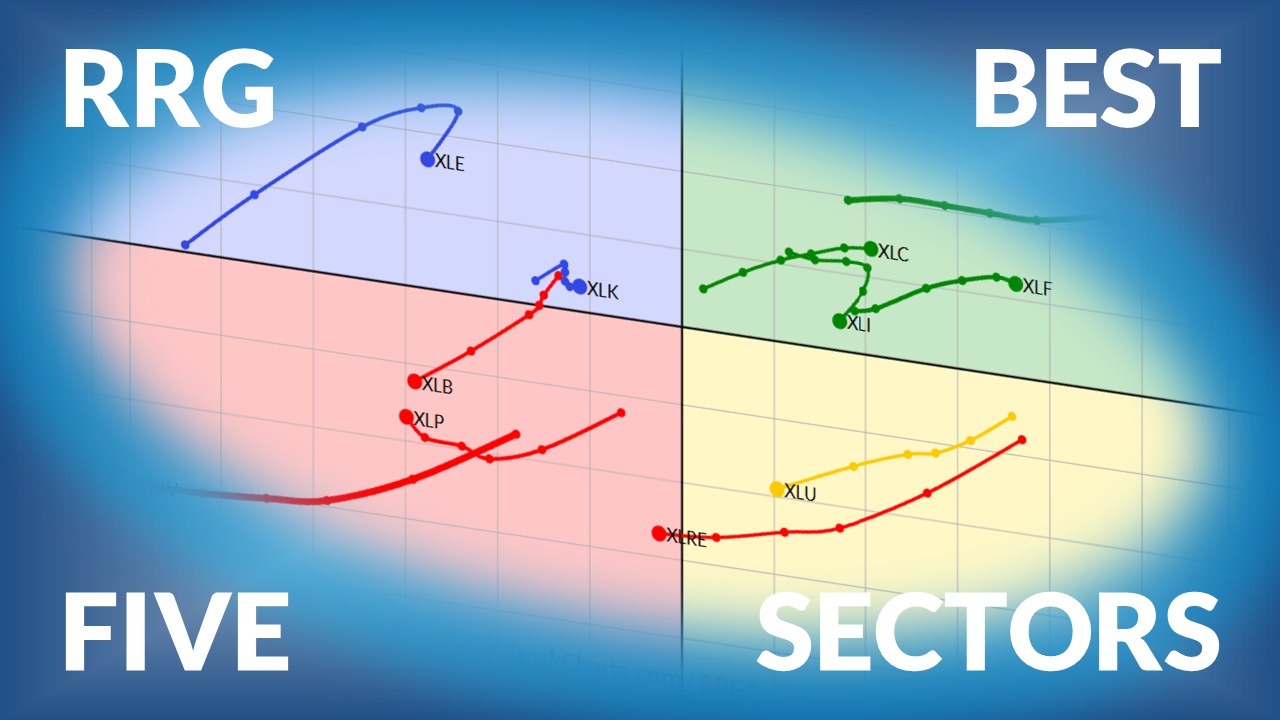
The Best Five Sectors this Week, #32

by Julius de Kempenaer,
Senior Technical Analyst, StockCharts.com
Weekly update on US sector rotation using Relative Rotation Graphs...
READ MORE
MEMBERS ONLY

Visualizing Breadth and Rotation Using RRG
by Julius de Kempenaer,
Senior Technical Analyst, StockCharts.com
When it comes to understanding what’s really going on beneath the surface of the market, two key concepts come to mind: breadth and rotation. Breadth helps us gauge the participation behind a trend, while rotation reveals where the strength is moving within the universe we’re analyzing. Combine both,...
READ MORE
MEMBERS ONLY
Week Ahead: NIFTY Snaps 6-Week Losing Streak; Trend Intact as Long as This Level Stays Protected

by Milan Vaishnav,
Founder and Technical Analyst, EquityResearch.asia and ChartWizard.ae
Nifty breaks its weeks-long loss streak, and many sectors are experiencing strengthening relative momentum....
READ MORE
MEMBERS ONLY
Surprise Sector Surge as Market Leaders Stall!

by Mary Ellen McGonagle,
President, MEM Investment Research
On this week’s show, Mary Ellen McGonagle analyzes a notable shift in market leadership as former top sectors slow and new areas step up. She covers the latest sector performance — from healthcare and biotech to home builders, retail, and small caps — and shows you how to navigate the changing...
READ MORE
MEMBERS ONLY
This Week in Charts: Surprises Ahead?
by Jayanthi Gopalakrishnan,
Director of Site Content, StockCharts.com
Wow! What a Week on Wall Street!
The S&P 500 ($SPX), Nasdaq Composite ($COMPQ), and the Dow Industrials ($INDU) all flirted with record highs at some point during the week, small caps stole the spotlight for a couple of days, and some beaten-down names like UnitedHealth Group...
READ MORE
MEMBERS ONLY

Short-Term Market Swings: A Gentle Rhythm of Short-Term Bounces
by Frank Cappelleri,
Founder & President, CappThesis, LLC
Get the latest S&P 500 analysis with a focus on RSI negative divergence, short-term swing setups, and market breadth trends. Learn what current patterns mean and how to spot the next move....
READ MORE
MEMBERS ONLY

Friday Chart Fix: QQQ Overtakes QQEW, GOOGL Near New High, Groups with Most Highs, Verizon Gaps Higher

by Arthur Hill,
Chief Technical Strategist, TrendInvestorPro.com
Which charts stand out this week? Arthur Hill analyzes the market and does a deep dive into the charts with price action that's not to be ignored....
READ MORE
MEMBERS ONLY

Can Gold Defy Gravity and Break to the Upside?
by Martin Pring,
President, Pring Research
Why does gold look ready to "defy gravity"? Martin Pring explains the technical signs....
READ MORE
MEMBERS ONLY
Rate Cut Rally: Stocks & Sectors Poised to Surge!

by Tom Bowley,
Chief Market Strategist, EarningsBeats.com
Join Tom as he reviews the explosive gains in small-cap stocks following the July CPI report. He also looks at the breakout in the Russell 2000, along with strength across key sectors like transports, biotechs, regional banks, and home construction. From there, he covers major index performance, key technical...
READ MORE
MEMBERS ONLY
Consumer Discretionary Breakouts — 3 Stocks to Watch Now
by Julius de Kempenaer,
Senior Technical Analyst, StockCharts.com
Discover which sectors are leading — and which to avoid — with Julius' latest RRG analysis. Follow along as he breaks down weekly and daily sector rotations, revealing technology’s dominance, potential in consumer discretionary, and why some defensive sectors are showing unexpected strength. Julius then dives deeper into the consumer...
READ MORE
MEMBERS ONLY
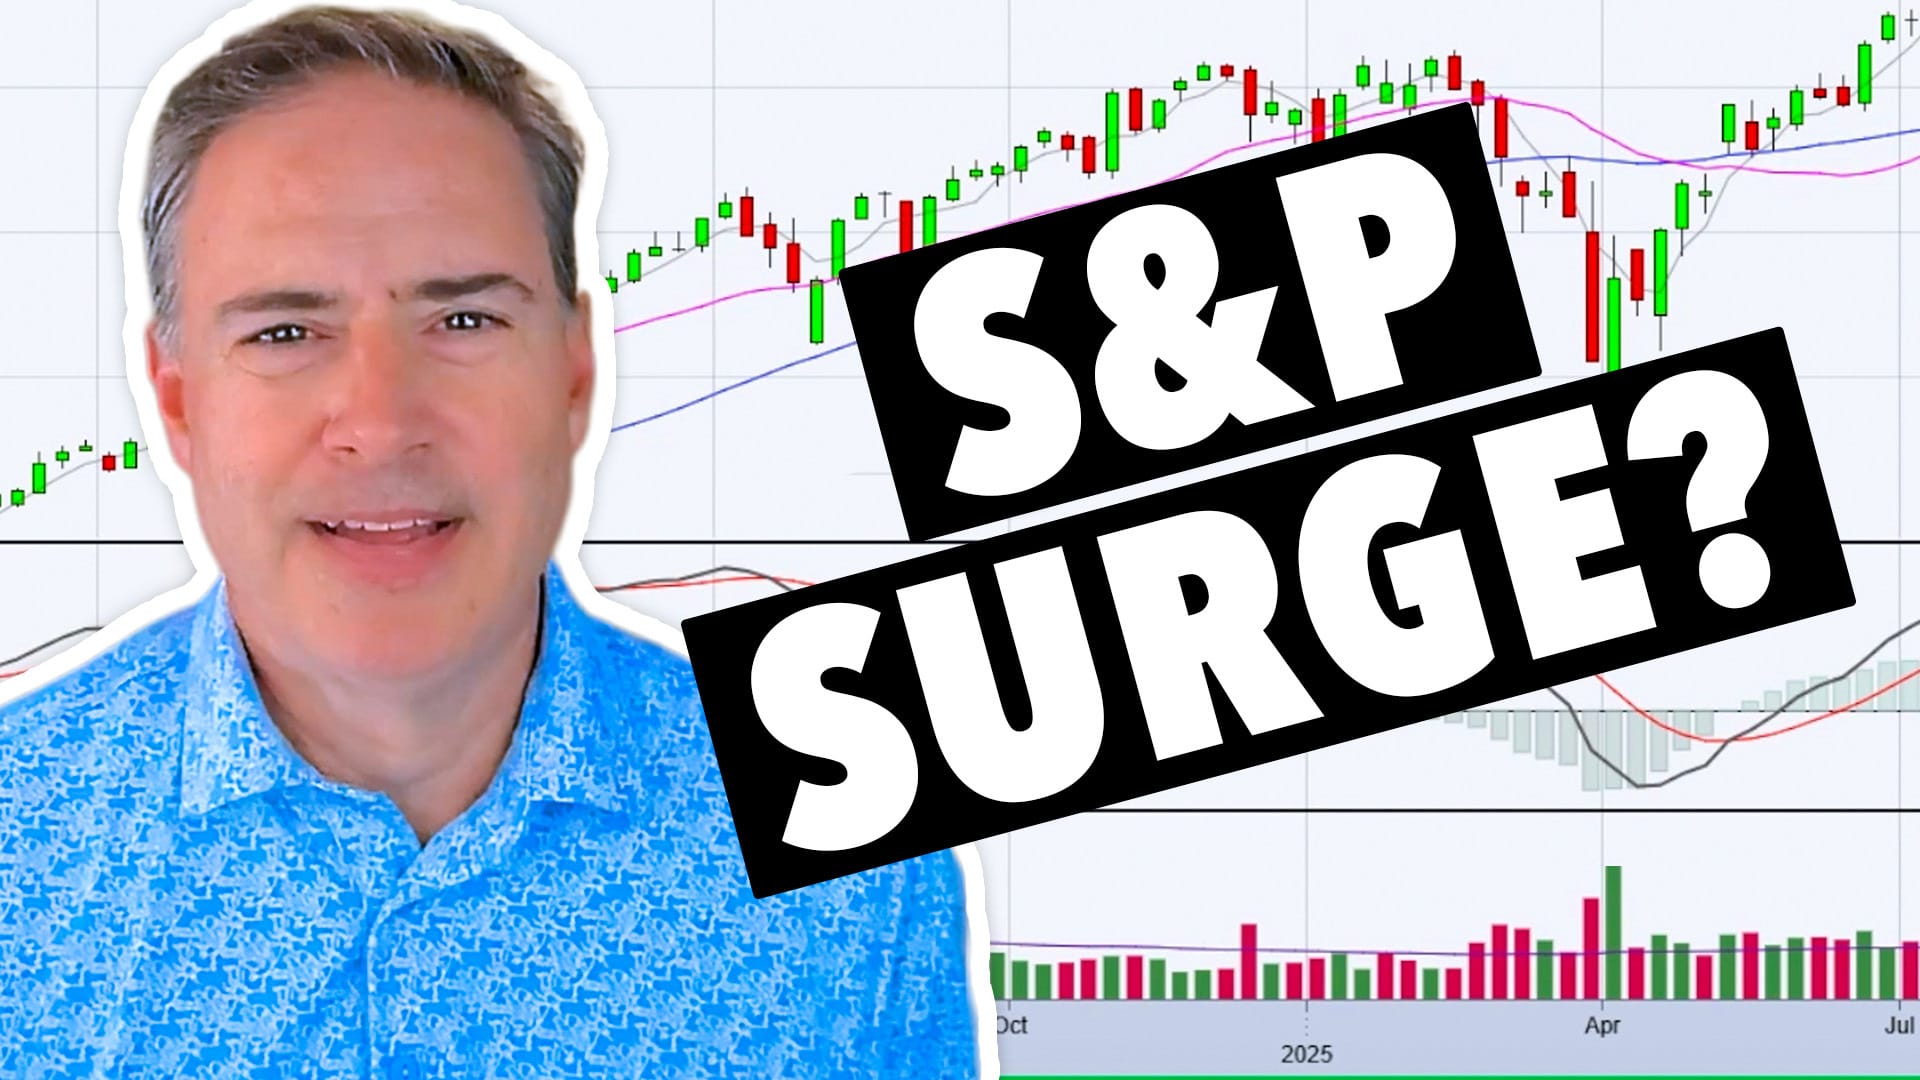
Is the S&P 500 About to Surge?
by Joe Rabil,
President, Rabil Stock Research
Joe analyzes the S&P 500’s current sequential wave pattern and, from there, explains how to spot a shift into a surging market phase. He breaks down key support and resistance levels on the SPY daily chart, evaluates the QQQ and IWM for signs of market strength, and...
READ MORE
MEMBERS ONLY

What to Make of the Small-Cap Rally: A Closer Look at IJR and IWM
Small-cap stocks are showing signs of strength. Investors should keep an eye on the performance of IWM and IJR, two small-cap ETFs, to determine if the small-cap rally has legs....
READ MORE
MEMBERS ONLY

StockCharts Insider: Should You Start with a Blank Chart or Pre-Loaded Indicators?
by Karl Montevirgen,
The StockCharts Insider
Before We Dive In…
Should I start with a blank chart or one pre-loaded with indicators? It’s a good question. There are pros and cons to both, and it depends on what you’re trying to do. In this quick post, I’ll break everything down so that...
READ MORE
MEMBERS ONLY

This Week’s Stock Market Winners — And What’s Driving Them
by Mary Ellen McGonagle,
President, MEM Investment Research
Join Mary Ellen as she breaks down the latest market trends! The highlight of the show is a deep dive into the consumer discretionary sector, where Mary Ellen analyzes leading industry groups like homebuilders, apparel, and specialty retail, and explains why this sector continues to show relative strength. She shares...
READ MORE
MEMBERS ONLY

US Dollar at a Crossroads, Gold Primed for Action: Macro Moves to Watch
With high-impact US data and geopolitical risks on tap this week, traders must assess the US dollar. Here are some outcomes that could surface in the dollar and gold....
READ MORE
MEMBERS ONLY

The Best Five Sectors, #31
by Julius de Kempenaer,
Senior Technical Analyst, StockCharts.com
Julius presents his weekly update on US sector rotation based on Relative Rotation Graphs....
READ MORE
MEMBERS ONLY

Week Ahead: Keeping Head Above This Level Crucial for Nifty To Avoid Slipping Into Prolonged Weakness
by Milan Vaishnav,
Founder and Technical Analyst, EquityResearch.asia and ChartWizard.ae
Nifty logs its sixth week of losses, hovering below key resistance. Traders remain cautious amid potential downside risks. ...
READ MORE
MEMBERS ONLY
Three Key Macro Charts I’m Watching on Vacation

by David Keller,
President and Chief Strategist, Sierra Alpha Research
Here are the key levels to watch in the S&P 500 as well as META, MSFT, and AAPL. As long as the index and stocks hold above key support levels, the uptrend in stocks is in good shape. ...
READ MORE
MEMBERS ONLY

StockCharts Insider: ‘My Chart Just Froze.’ Is It You… Or Us?
by Karl Montevirgen,
The StockCharts Insider
We’ve all been there: You're in the middle of analyzing a chart when suddenly everything freezes, and real-time data stops flowing. And now you’re wondering—is it my computer, my Wi-Fi, or... my charting service?
Check the New System Status Page When Things Go...
READ MORE
MEMBERS ONLY
Charts Don’t Lie: The Secret Weapon Behind This Week’s Picks
by Jayanthi Gopalakrishnan,
Director of Site Content, StockCharts.com
It's the Clash of the Chart Titans — Who Wins?
Buckle up, folks. This week, we’re bringing you not one, but two "Top 10 Stocks" videos. That means double the picks, double the fun!
So, who’s the victor in this high-stakes stock showdown? Spoiler:...
READ MORE
MEMBERS ONLY

Friday Chart Fix: 2024 vs. 2025, Commodities with a Dash of Crypto, Moment of Truth for IWM, The Tesla Squeeze
by Arthur Hill,
Chief Technical Strategist, TrendInvestorPro.com
Here's a deep dive into the differences between the 2024 bull market and 2025 bull run, small-cap performance, the price action in Bitcoin and gold, and the Bollinger Band squeeze in Tesla's stock price....
READ MORE
MEMBERS ONLY

Apple's Strongest 2-Day ROC Since April: Breakout or Bull Trap?
Apple (AAPL) jumps on tariff relief headlines. See the ROC thrust, 200-day moving average test, gap levels at $213/$203, and targets to $237-$250....
READ MORE
MEMBERS ONLY

Smart Investors are Watching These Chart Signals: Here's Why
by Frank Cappelleri,
Founder & President, CappThesis, LLC
Discover what Bollinger Bands and RSI are signaling for the S&P 500. Learn how low volatility and key momentum indicators could point to the next market breakout....
READ MORE
MEMBERS ONLY
How We Beat the S&P 500 by 20% This Quarter!
by Tom Bowley,
Chief Market Strategist, EarningsBeats.com
Tom breaks down how his model portfolios have consistently outperformed the S&P 500 — including a 24.5% return for the aggressive portfolio over the past quarter, against the S&P 500’s 5%. He covers market signals following the Fed’s recent rate decision, explains why Wall...
READ MORE
MEMBERS ONLY
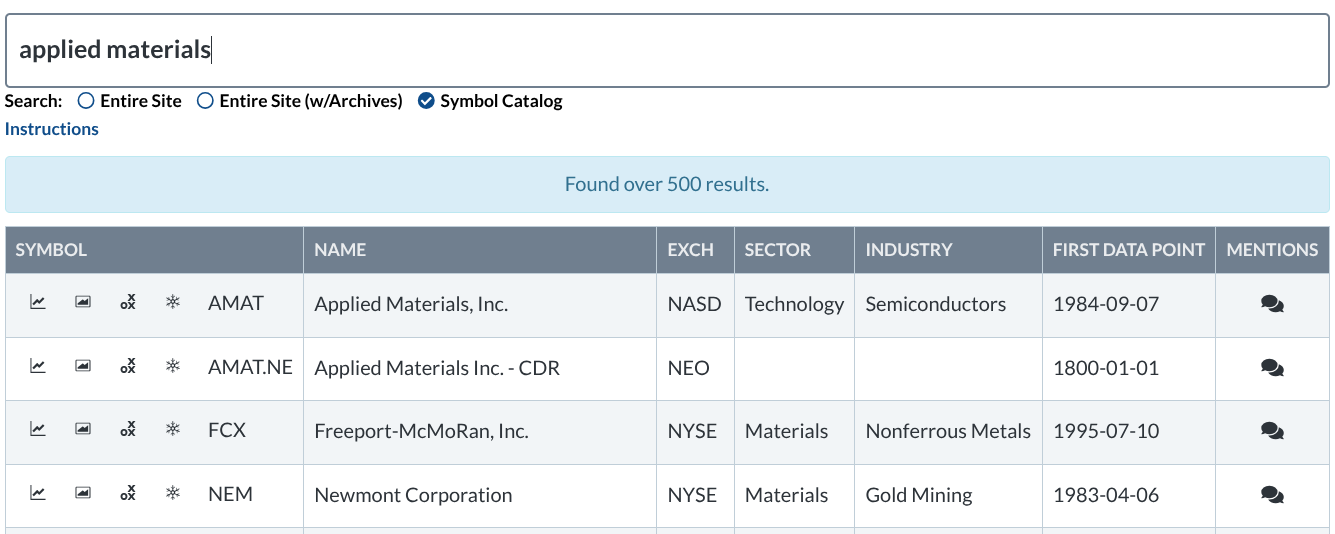
StockCharts Insider: How to Use the New StockCharts Search Tool Like a Pro
by Karl Montevirgen,
The StockCharts Insider
Before We Dive In…
Sure, it’s a search tool, but what matters is how you use it. StockCharts’ new search digs deep into the archive and pulls up the most relevant content. I’ll show you how I optimize its use to find indicators, tutorials, market analysis, and explainers...
READ MORE
MEMBERS ONLY

The Good, the Bad, and the Sideways
by David Keller,
President and Chief Strategist, Sierra Alpha Research
As U.S. equity indexes hit new highs, not all stocks are keeping pace. Explore these three stocks that are at key technical junctures with charts that highlight trend shifts, risk levels, and actionable signals....
READ MORE
MEMBERS ONLY
My Go-To ADX Scan for Finding Breakout Stocks
by Joe Rabil,
President, Rabil Stock Research
Joe shares his go-to ADX stock scan! Follow along as Joe uses the StockCharts platform to uncover strong long-term uptrends paired with low short-term momentum — the kind of setup that often precedes powerful breakouts. He walks through his “Strong Monthly / Low Weekly” scan criteria, explains how to...
READ MORE
MEMBERS ONLY
Narrow Leadership Is a Concern, but the Bear Signal Has Yet To Trigger: Here's What To Watch
by Arthur Hill,
Chief Technical Strategist, TrendInvestorPro.com
New highs show narrow leadership in the S&P 500, yet new highs are outpacing new lows. Will the leadership broaden? Watch these indicators....
READ MORE
MEMBERS ONLY
Top 10 Charts to Watch August 2025!

by Grayson Roze,
Chief Strategist, StockCharts.com
Join Grayson Roze as he reveals his top 10 stock charts to watch this month including SFM, BSX, AFRM and SYF. From breakout strategies to moving average setups, he walks through technical analysis techniques using relative strength, momentum, and trend-following indicators. Viewers will also gain insight into key market...
READ MORE
MEMBERS ONLY
Top 10 Stock Charts for August 2025 You Need to Watch Now
by David Keller,
President and Chief Strategist, Sierra Alpha Research
Join Dave as he shares ten actionable stock charts for August 2025 that he’s watching closely. From breakout setups to key reversals, David highlights tickers like Tesla, Meta, Caterpillar, Motorola, and Newmont Mining that show compelling technical patterns. He also walks through how to manage the full trading process...
READ MORE
MEMBERS ONLY
Markets Drop! But These Stocks Are Still Leading
by Mary Ellen McGonagle,
President, MEM Investment Research
Mary Ellen McGonagle breaks down this week’s market volatility and what it means for investors. She explains how inflation and employment data triggered technical breakdowns in key indexes, and discusses why volatility, relative strength, and leadership stocks (including MPWR, TER, and Cadence Design) should remain on your radar. Mary...
READ MORE