MEMBERS ONLY
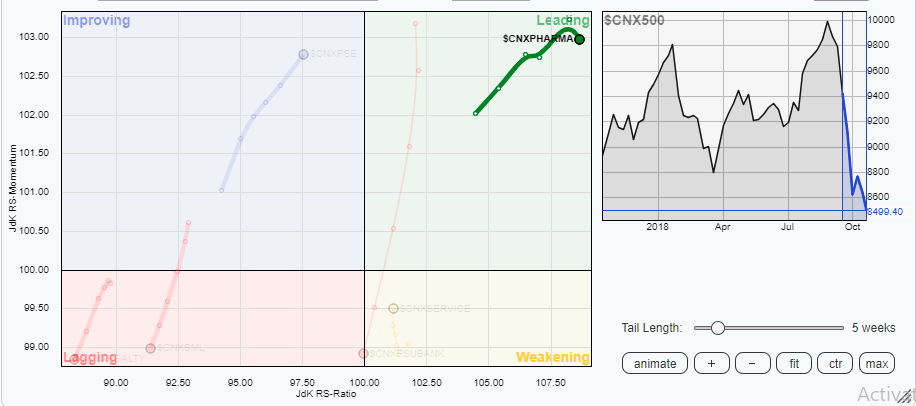
These Two Stocks Look Promising Within The Pharma Pack

by Milan Vaishnav,
Founder and Technical Analyst, EquityResearch.asia and ChartWizard.ae
In our note on "Sector-in Focus: NIFTY Pharma", we discussed about the NIFTY Pharmaceutical Index coming out of a multi-year year downtrend and potentially reversing its trend.
In the first Relative Rotation Graph (RRG) above, though the $CNXPHARMA has slowed down a bit on the relative momentum front,...
READ MORE
MEMBERS ONLY
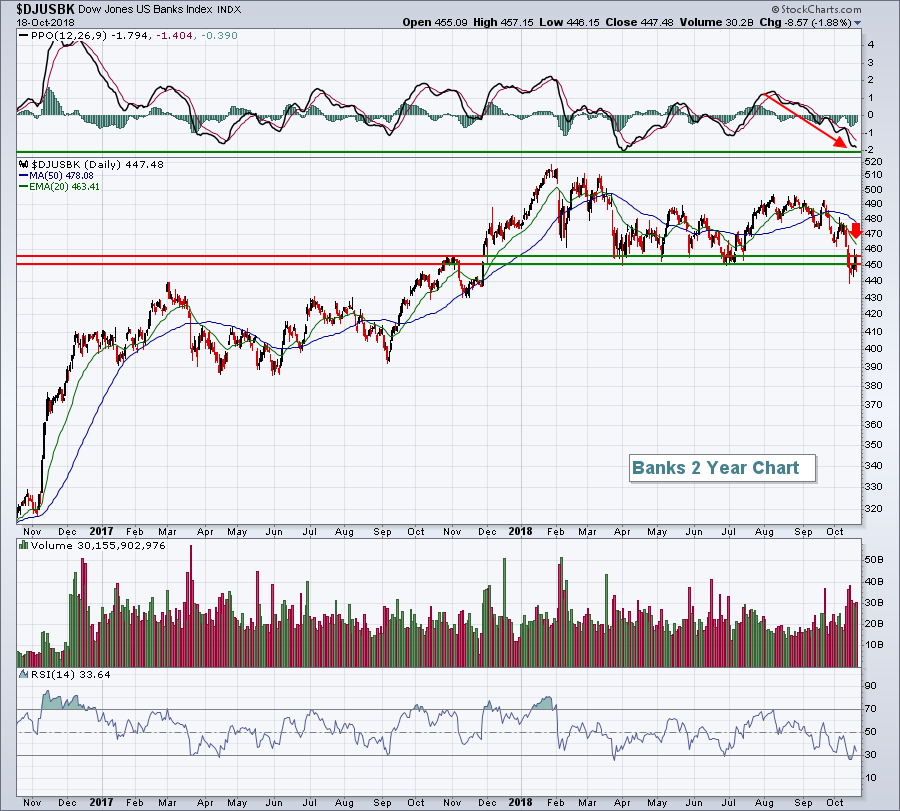
Banks, Financials Drop To 2018 Lows, Futures Tumble As Risk Grows

by Tom Bowley,
Chief Market Strategist, EarningsBeats.com
Subscribe For FREE Below
If you enjoy my daily blog article that summarizes recent action, current outlook and provides a historical perspective, please subscribe below. It's 100% FREE, no strings attached, and is much appreciated. Simply scroll to the bottom of my article and type in your email...
READ MORE
MEMBERS ONLY

Authors and Newsletter Writers

by Greg Morris,
Veteran Technical Analyst, Investor, and Author
A couple of weeks ago I wrote about all the various types of technical analysts (Technical Analysts!); in this article I add to that list the authors and newsletter writers.
Authors
Well, I’ve written four books, two were essentially research projects (Candlestick Charting Explained and The Complete Guide to...
READ MORE
MEMBERS ONLY
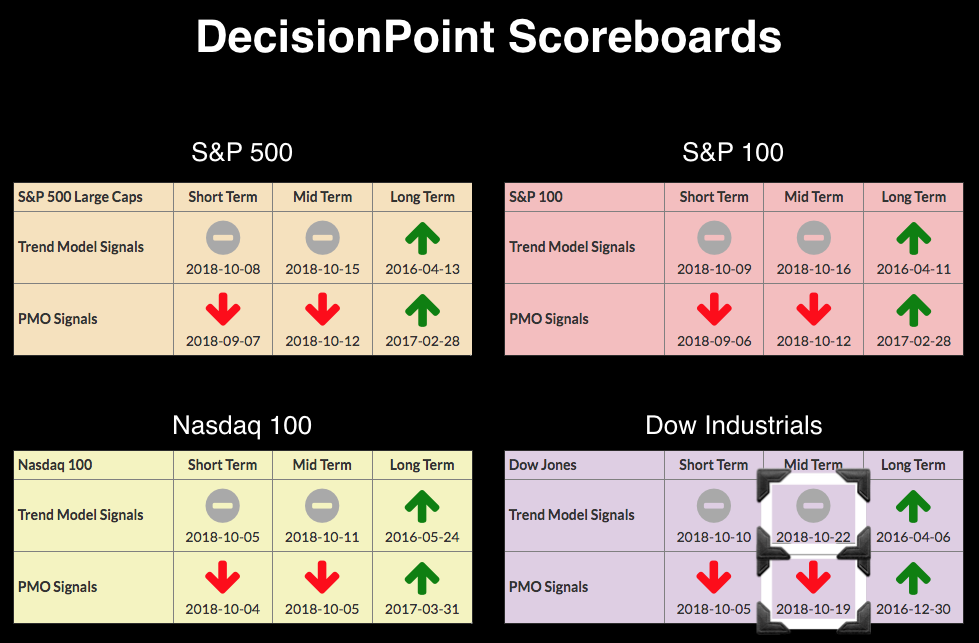
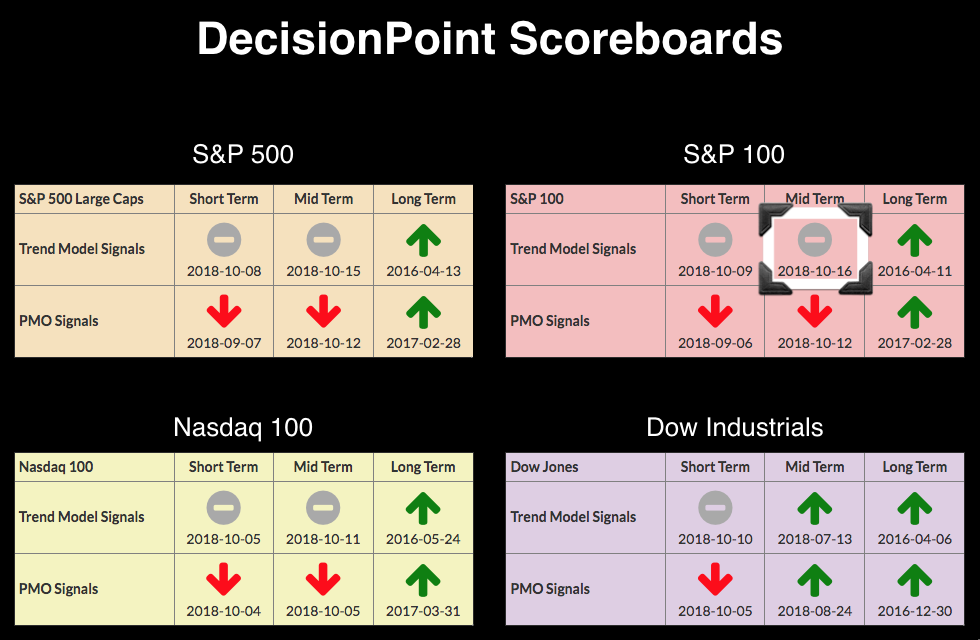
DP Bulletin #1: Final Intermediate-Term BUY Signal Lost - Long Term Stays Bullish on All Scoreboards

by Erin Swenlin,
Vice President, DecisionPoint.com
On Friday, after the market closed, the Dow saw its Price Momentum Oscillator (PMO) on the weekly chart sink below its signal line, generating an IT PMO SELL signal. Today, insult was added to injury as a new IT Trend Model Neutral signal triggered. At this point, the only "...
READ MORE
MEMBERS ONLY
Using the Measured Move Technique for Citigroup

by Arthur Hill,
Chief Technical Strategist, TrendInvestorPro.com
Citigroup (C) is leading the Financials SPDR (XLF) lower with a lower high in September and a rising wedge break in October.
The chart shows weekly bars for Citigroup over the last three years. The stock led the market higher in 2016 and 2017 with a gain exceeding 100% from...
READ MORE
MEMBERS ONLY
Here's What To Expect Going Forward And It May Not Be Pretty Short-Term
by Tom Bowley,
Chief Market Strategist, EarningsBeats.com
Special Note
I will be joining John Hopkins, President of EarningsBeats.com, for a special webinar later this afternoon at 4:30pm EST. I will be discussing my trading strategy during a volatile market like the one we have now, including some tips and tricks to manage risk during these...
READ MORE
MEMBERS ONLY
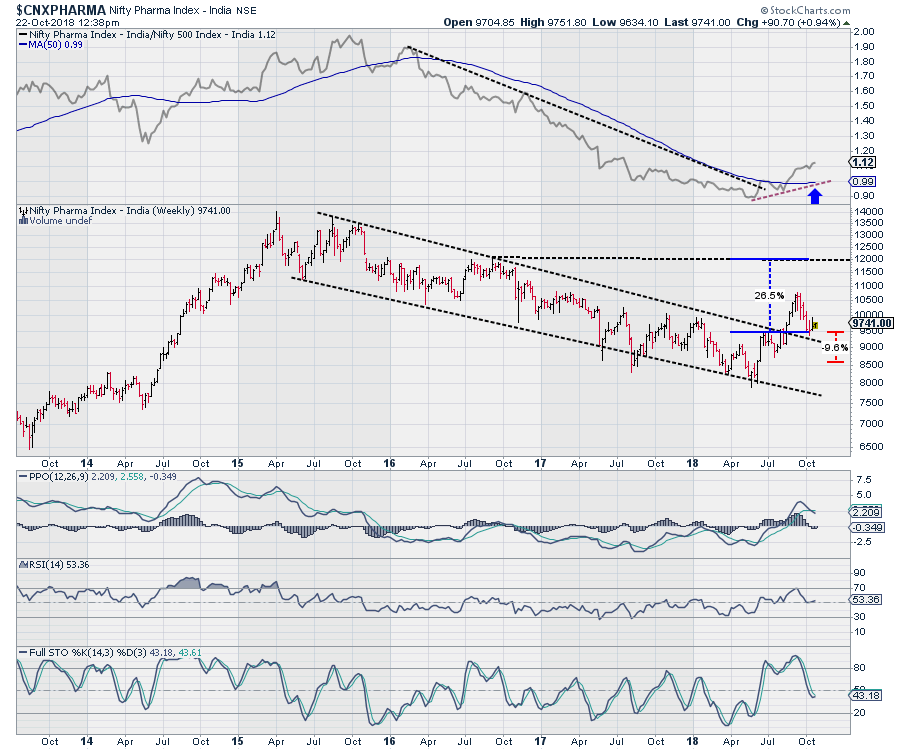
Sector in Focus: NIFTY Pharma ($CNXPHARMA): Looking at a trend reversal after multi-year downtrend
by Milan Vaishnav,
Founder and Technical Analyst, EquityResearch.asia and ChartWizard.ae
Nifty Pharmaceutical Index - NIFTYPHARMA ($CNXPHARMA) marked its high at 14,020 on 6th of April 2015 and since then it has remained in a falling channel under a corrective downtrend which has lasted over 3 years.
After remaining in a corrective downtrend for over 3 years, it has shown...
READ MORE
MEMBERS ONLY
Sector Relative Performance Suggesting Caution, Not Bear Market
by Tom Bowley,
Chief Market Strategist, EarningsBeats.com
There are plenty of reasons why we should be cautious given the current market environment, but I'm not in the camp that believes we've entered a bear market. It's simply too early to make that call, in my opinion. Most corrections and bear markets...
READ MORE
MEMBERS ONLY
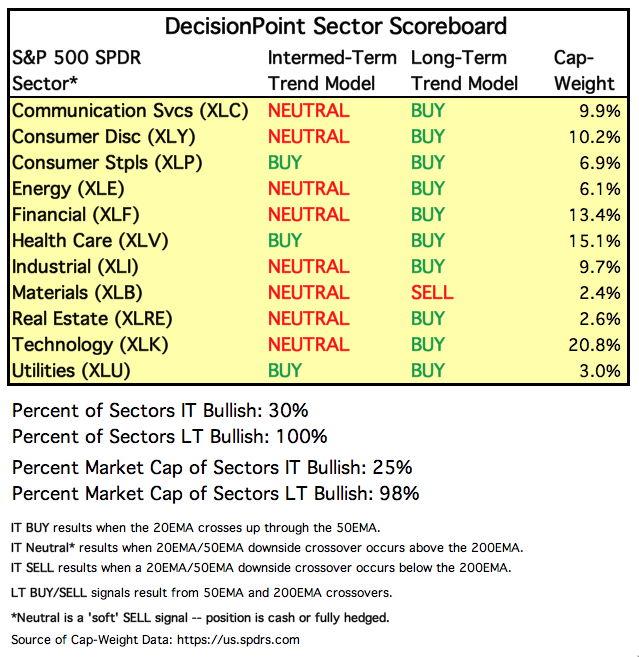
DecisionPoint Sector Scoreboard Tells the Story
by Erin Swenlin,
Vice President, DecisionPoint.com
If you've explored the member dashboard, read a DP Alert or checked into the DecisionPoint Chart Gallery, you are likely familiar with our DecisionPoint Scoreboards for the SPX, OEX, INDU and NDX. What you may not have uncovered was our DecisionPoint Sector Scoreboard. Carl assembled a table that...
READ MORE
MEMBERS ONLY

Headwinds

by Bruce Fraser,
Industry-leading "Wyckoffian"
Headwinds have been forming for the stock market. Point and Figure counts (PnF) have been signaling where these opposing forces to higher stock prices were likely to emerge. Stocks have reacted downward with authority after hitting these PnF targets. Let’s review, and bring current, some of these prior chart...
READ MORE
MEMBERS ONLY

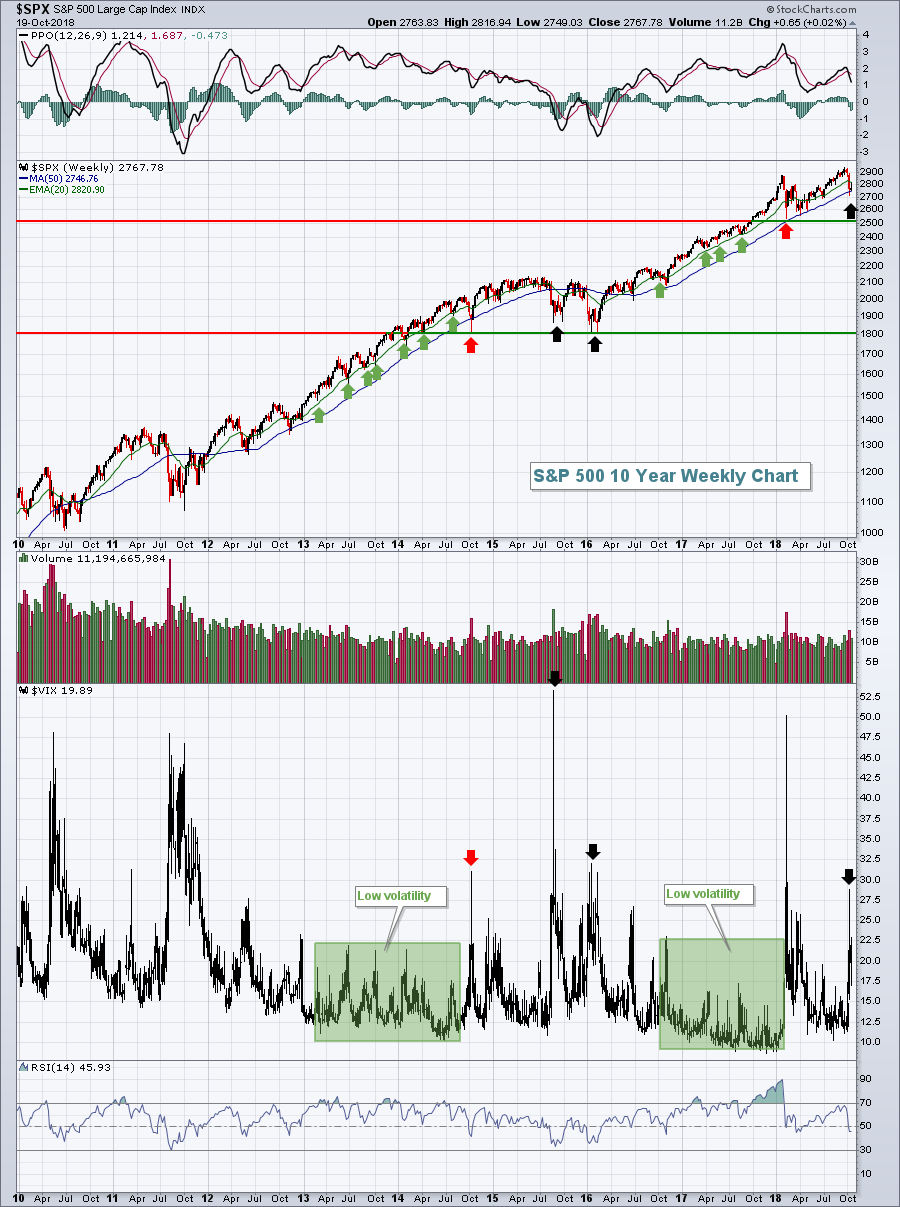
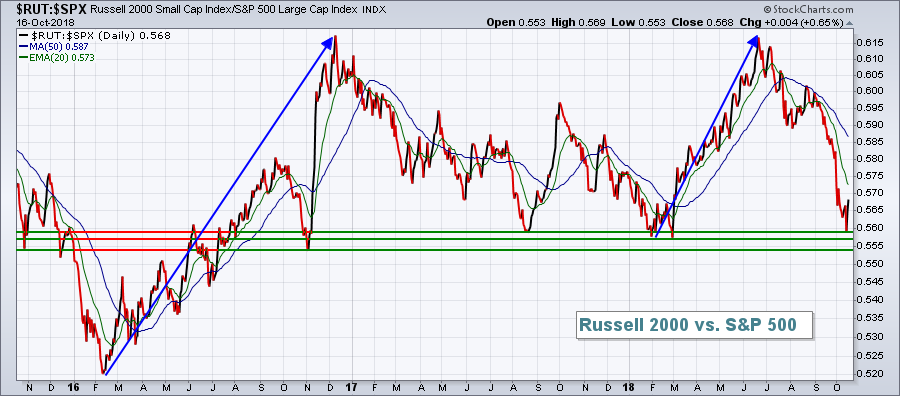
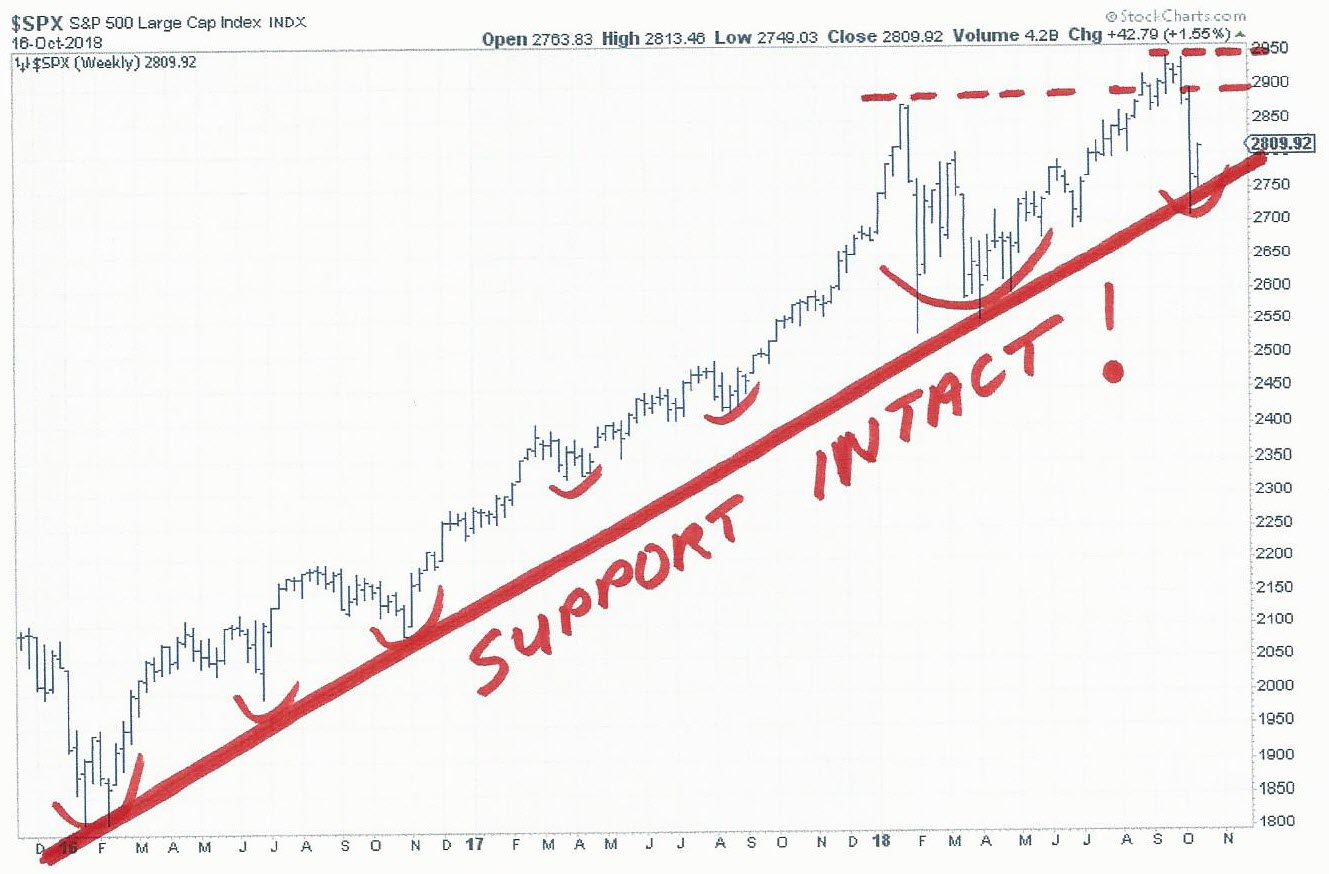
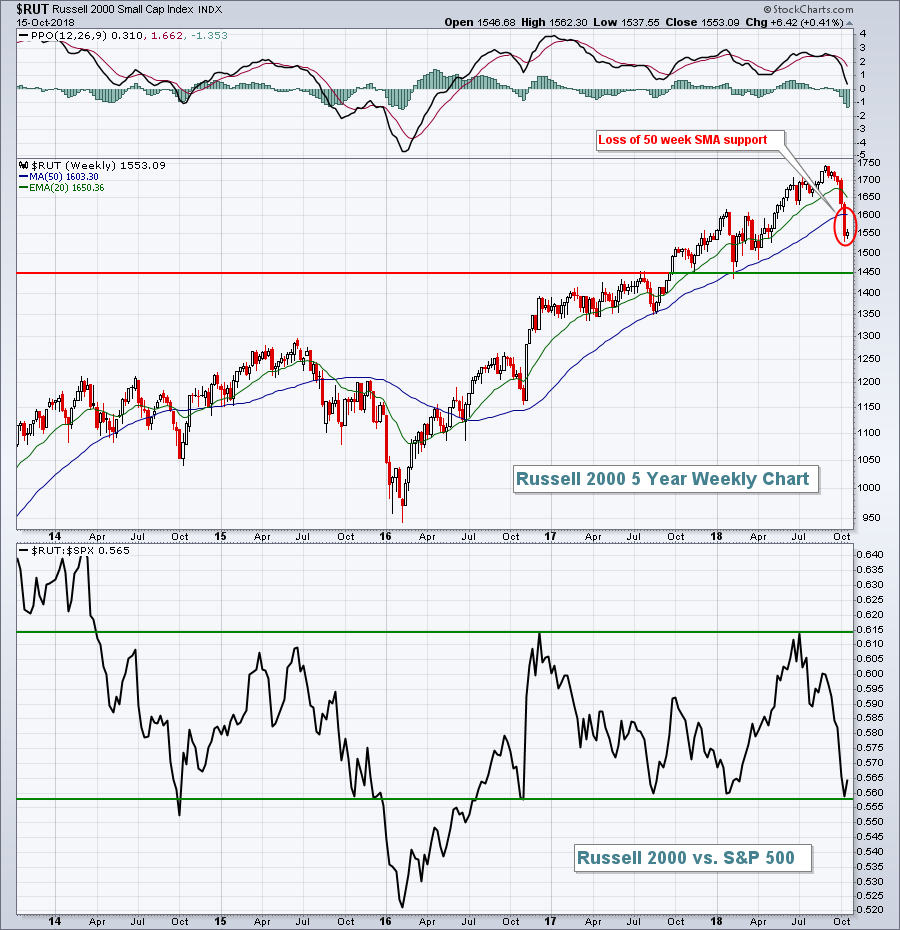
S&P 500 RETESTS 200-DAY MOVING AVERAGE AND TWO-YEAR SUPPORT LINE -- VOLUME PATTERN HASN'T BEEN ENCOURAGING -- SMALL CAPS CONTINUE TO DROP FASTER THAN LARGE CAPS -- A RATIO OF SMALL CAPS VERSUS LARGE CAPS IS NOW TESTING MAJOR SUPPORT

by John Murphy,
Chief Technical Analyst, StockCharts.com
S&P 500 CONTINUES TO TEST MAJOR SUPPORT LINES... After a rebound attempt on Tuesday, stocks ended the week pretty much where they started, but on the defensive. The daily bars in Chart 1 show the S&P 500 Large Cap Index closing Friday right on its 200-day...
READ MORE
MEMBERS ONLY

Sector Shuffle: Explaining The New XLC and XLRE Additions And Historical Data Calculations

by Grayson Roze,
Chief Strategist, StockCharts.com
Editor's Note: This article was prepared jointly by Julius de Kempenaer and Arthur Hill with assistance from members of the StockCharts data and business teams.
You may have noticed that in September, a lot was written about the changes in sector classifications that were implemented after the close...
READ MORE
MEMBERS ONLY
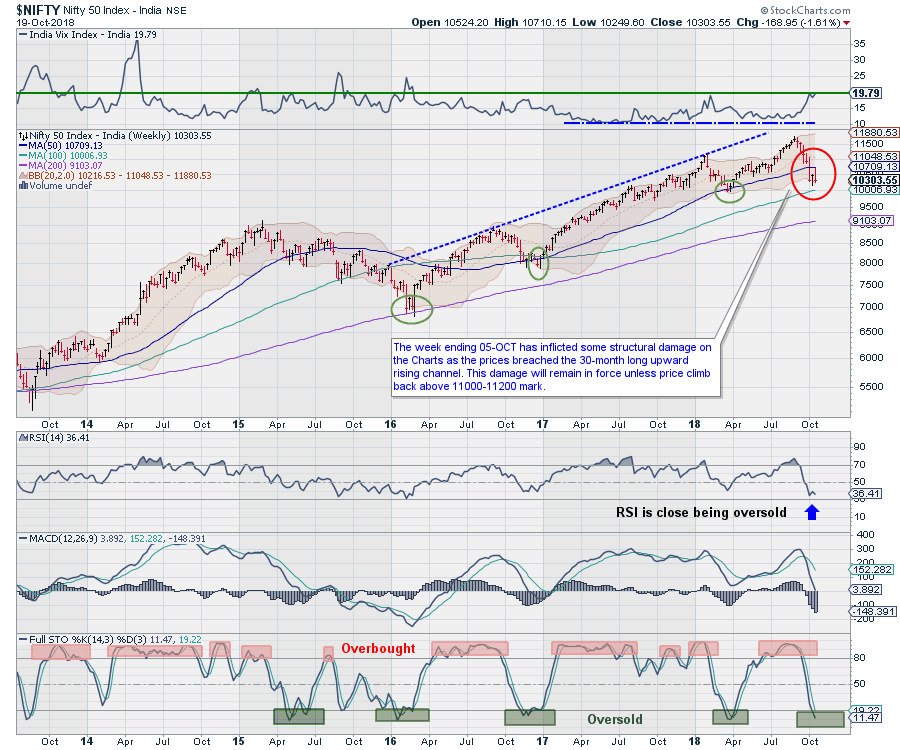
Volatility and rollovers to dominate the coming week; These sectors could relatively out-perform
by Milan Vaishnav,
Founder and Technical Analyst, EquityResearch.asia and ChartWizard.ae
Though the week that went by saw lot of volatility, it remained particularly fruitless for the Markets. What was gained in the week before was given back this week. There was enough room for the Markets to pullback up to 10700. This week saw the levels of 10710 being tested...
READ MORE
MEMBERS ONLY

Big Sectors Weigh as Defensive Sectors Buck the Selling Pressure
by Arthur Hill,
Chief Technical Strategist, TrendInvestorPro.com
One of my favorite methods for analyzing the sector SPDRs is with CandleGlance charts sorted by the Rate-of-Change indicator to rank performance. This is a great way to quickly separate the leaders from the laggards and analyze short-term price action.
The charts below show the 11 sector SPDRs and the...
READ MORE
MEMBERS ONLY
DP Weekly Wrap: Bear Market Yet? Waiting for Retest. Gold New BUY Signal.

by Carl Swenlin,
President and Founder, DecisionPoint.com
Despite a great rally on Tuesday, a sharp decline on Thursday took it all back, and the market finished the week barely changed. This was an options expiration week, so I think that probably had something to do with it. As of last week, I was expecting some chop in...
READ MORE
MEMBERS ONLY
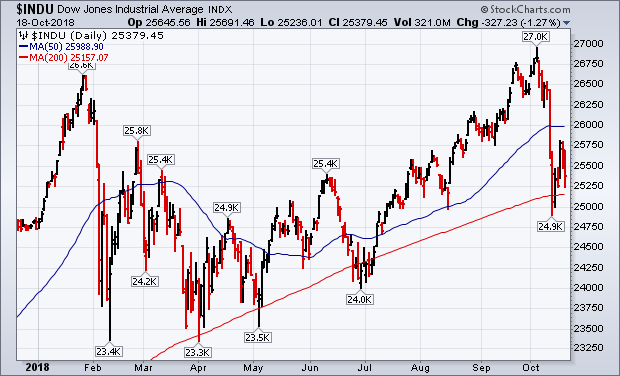
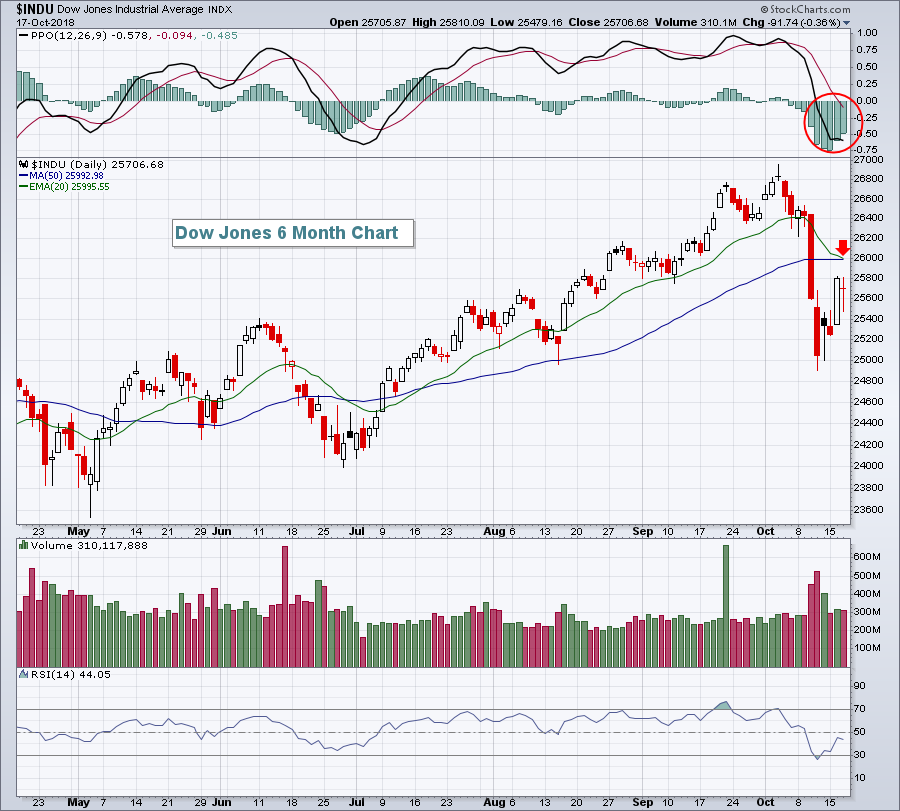
The Three Dow Averages Are Giving Bearish Messages
by John Murphy,
Chief Technical Analyst, StockCharts.com
Editor's Note: This article was originally published in John Murphy's Market Message on Thursday, October 18th at 5:00pm ET.
My last two messages spelled out a lot of technical reasons that are bearish for the stock market, and increase the odds that the nine-year bull...
READ MORE
MEMBERS ONLY
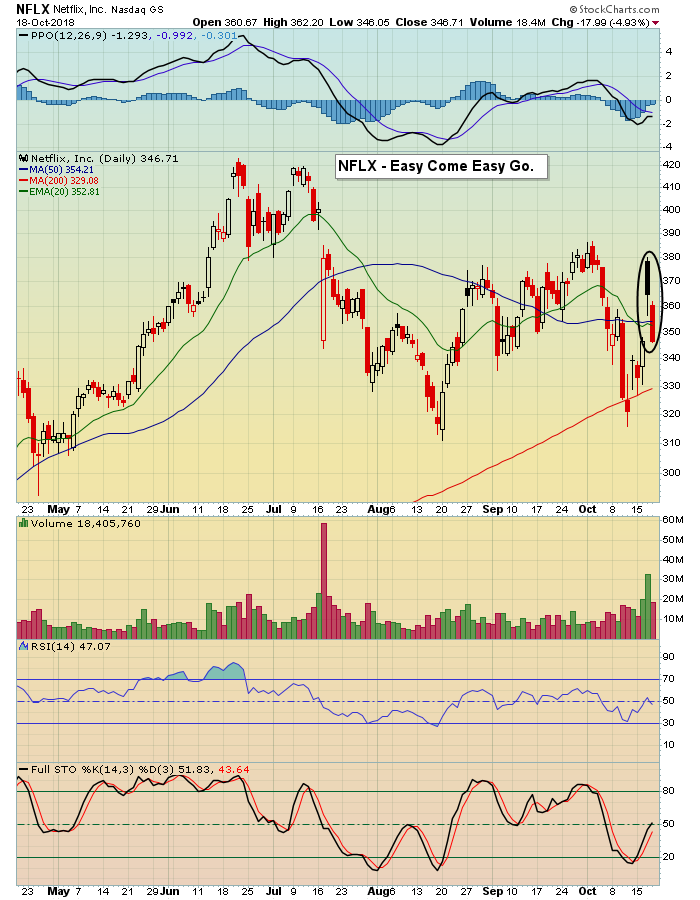
Can Strong Earnings Provide a Safe Haven into Year End?

by John Hopkins,
President and Co-founder, EarningsBeats.com
The market has been under fire for the past two weeks. Volatility has spiked. Traders have bailed as they've sold on rallies. Bad news is bad news. Good news is bad news. No one wants to touch stocks!
We can take a look at Netflix as a great...
READ MORE
MEMBERS ONLY

Major New S&P Sectors and Realignments: Biggest ChartPack Update Ever (Q3, 2018)

by Gatis Roze,
Author, "Tensile Trading"
Ladies and Gentlemen: the most significant shakeup in sector classifications within the past decade has just occurred. Two of the world’s biggest index providers — Standard & Poor’s (S&P) and MSCI, Inc. — have reorganized critical sector indexes.
It’s a good time to take stock of what...
READ MORE
MEMBERS ONLY

Weekly Market Review & Outlook (with video) - Dow Theory and Primary Trends
by Arthur Hill,
Chief Technical Strategist, TrendInvestorPro.com
* Performance Overview.
* Correlations and Volatility Rise.
* Scanning and Measuring Participation.
* Bulk of the Evidence Remains Bearish.
* S&P 500 Battles 200-day.
* Dow Theory and Trends.
* Healthcare and Utilities Hold Up.
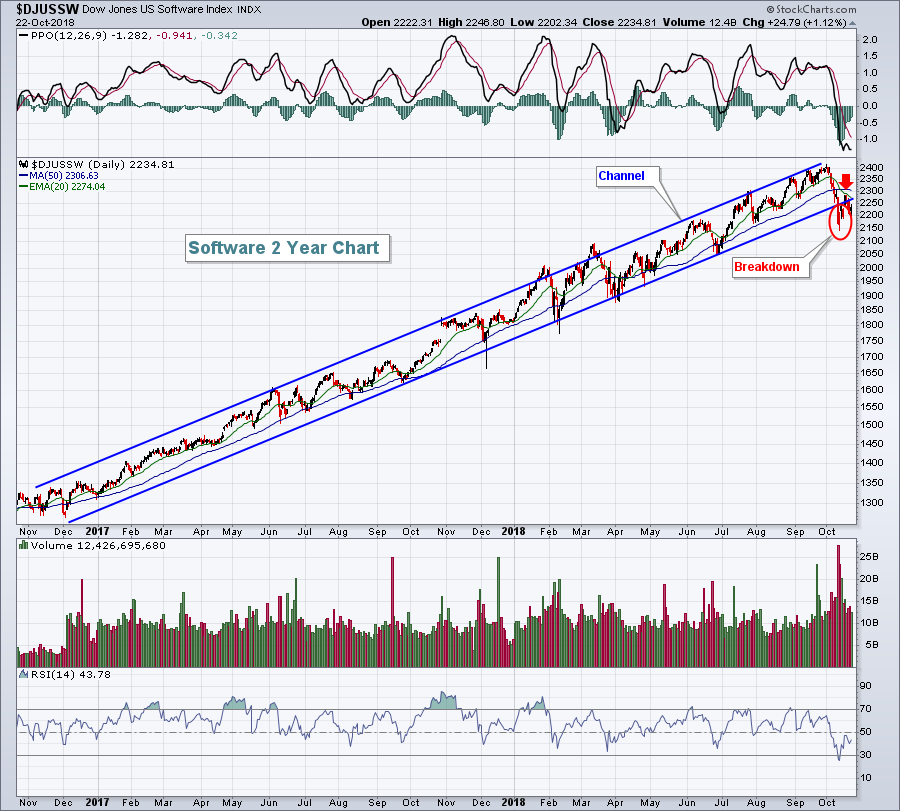
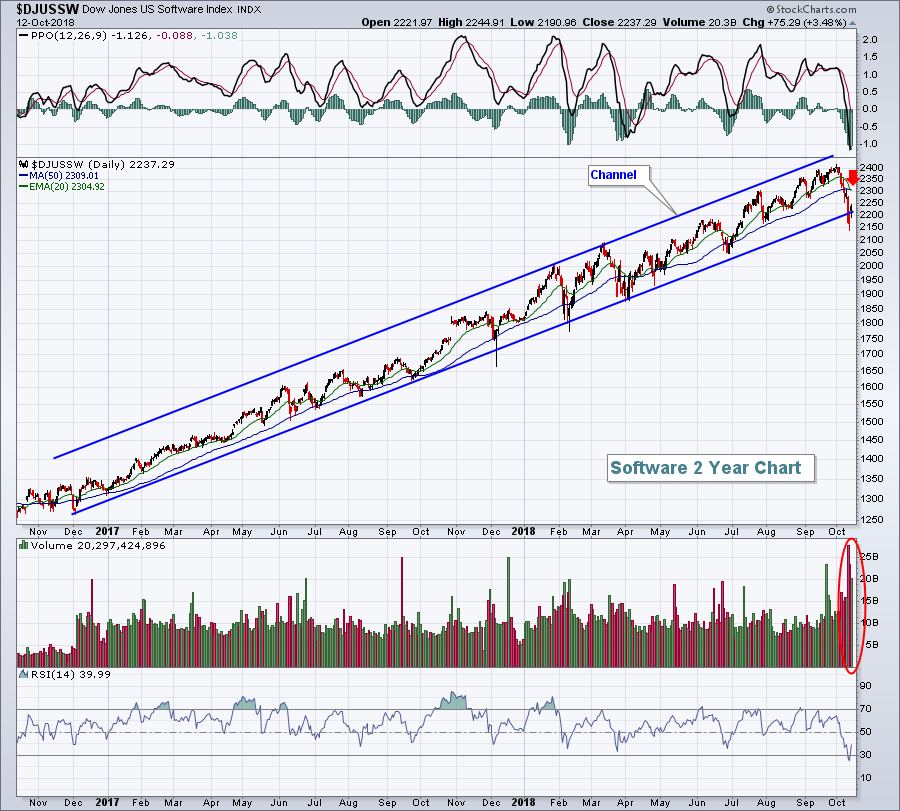
* Software, Defense and Health-related ETFs.
* Notes from the Art's Charts ChartList.
... Correlations and Volatility Rise
... The major...
READ MORE
MEMBERS ONLY
A Consumer Discretionary Group Has Been Sending Warning Signs For Two Years
by Tom Bowley,
Chief Market Strategist, EarningsBeats.com
Market Recap for Thursday, October 18, 2018
Impulsive selling seemed to return to Wall Street on Thursday as the Dow Jones had a couple of intraday bouts where the index declined 200-300 points in just an hour or so. That sent the Volatility Index ($VIX, +15.29%) scurrying higher once...
READ MORE
MEMBERS ONLY

THE THREE DOW AVERAGES ARE GIVING BEARISH MESSAGES -- THE DOW TRANSPORTS ARE FALLING THE FASTEST -- WHILE THE UTILITIES ARE DOW LEADERS -- TRANSPORTATION/UTILITIES RATIO FALLS TO LOWEST LEVEL OF THE YEAR
by John Murphy,
Chief Technical Analyst, StockCharts.com
THE DOW RETESTS 200-DAY LINE... My last two messages spelled out a lot of technical reasons that are bearish for the stock market, and increase the odds that the nine-year bull run is ending. Besides the heavy selling that's taken place during October, my weekend message showed a...
READ MORE
MEMBERS ONLY
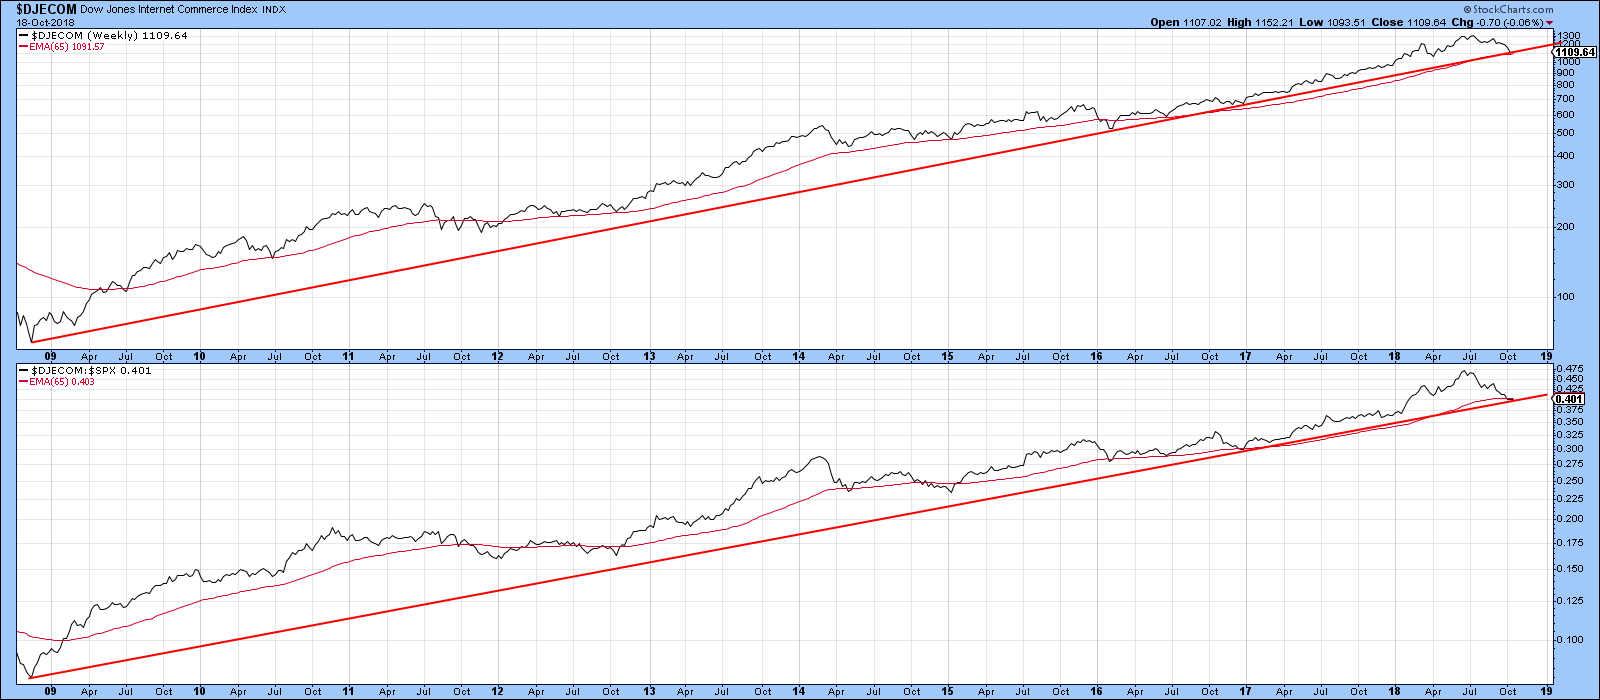
Four Areas To Watch For A Possible Bear Market Trigger

by Martin Pring,
President, Pring Research
* Internet bubble
* Credit spreads
* Rising interest rates
* Contagion from abroad
On Wednesday, I joined Tom and Erin on MarketWatchers LIVE and enjoyed a spirited discussion on what signs might foreshadow an extension to last week’s decline, or even signal a bear market. The four areas I cited were the...
READ MORE
MEMBERS ONLY

SystemTrader - Reducing Moving Average Whipsaws with Smoothing and Quantifying Filters.
by Arthur Hill,
Chief Technical Strategist, TrendInvestorPro.com
* Trading SPY with S&P 500 Signals.
* Long and Long-Short Backtests.
* Smoothing to Reduce Whipsaws.
* Testing Different SMA Combinations.
* Bollinger Bands, Envelopes and Keltners.
* Backtesting the Filters.
* Final Thoughts and a Suggestion.
... Introduction
Yesterday I put the 200-day SMA through the wringer with some testing using the S&...
READ MORE
MEMBERS ONLY
Financials Continue To Bounce Off Support, Market Choppy
by Tom Bowley,
Chief Market Strategist, EarningsBeats.com
Market Recap for Wednesday, October 17, 2018
There was a lot of back and forth action in our major indices on Wednesday. For instance, in the span of just 2 1/2 hours, the Dow Jones lost more than 300 points, then recovered them all, moving slightly into positive territory....
READ MORE
MEMBERS ONLY
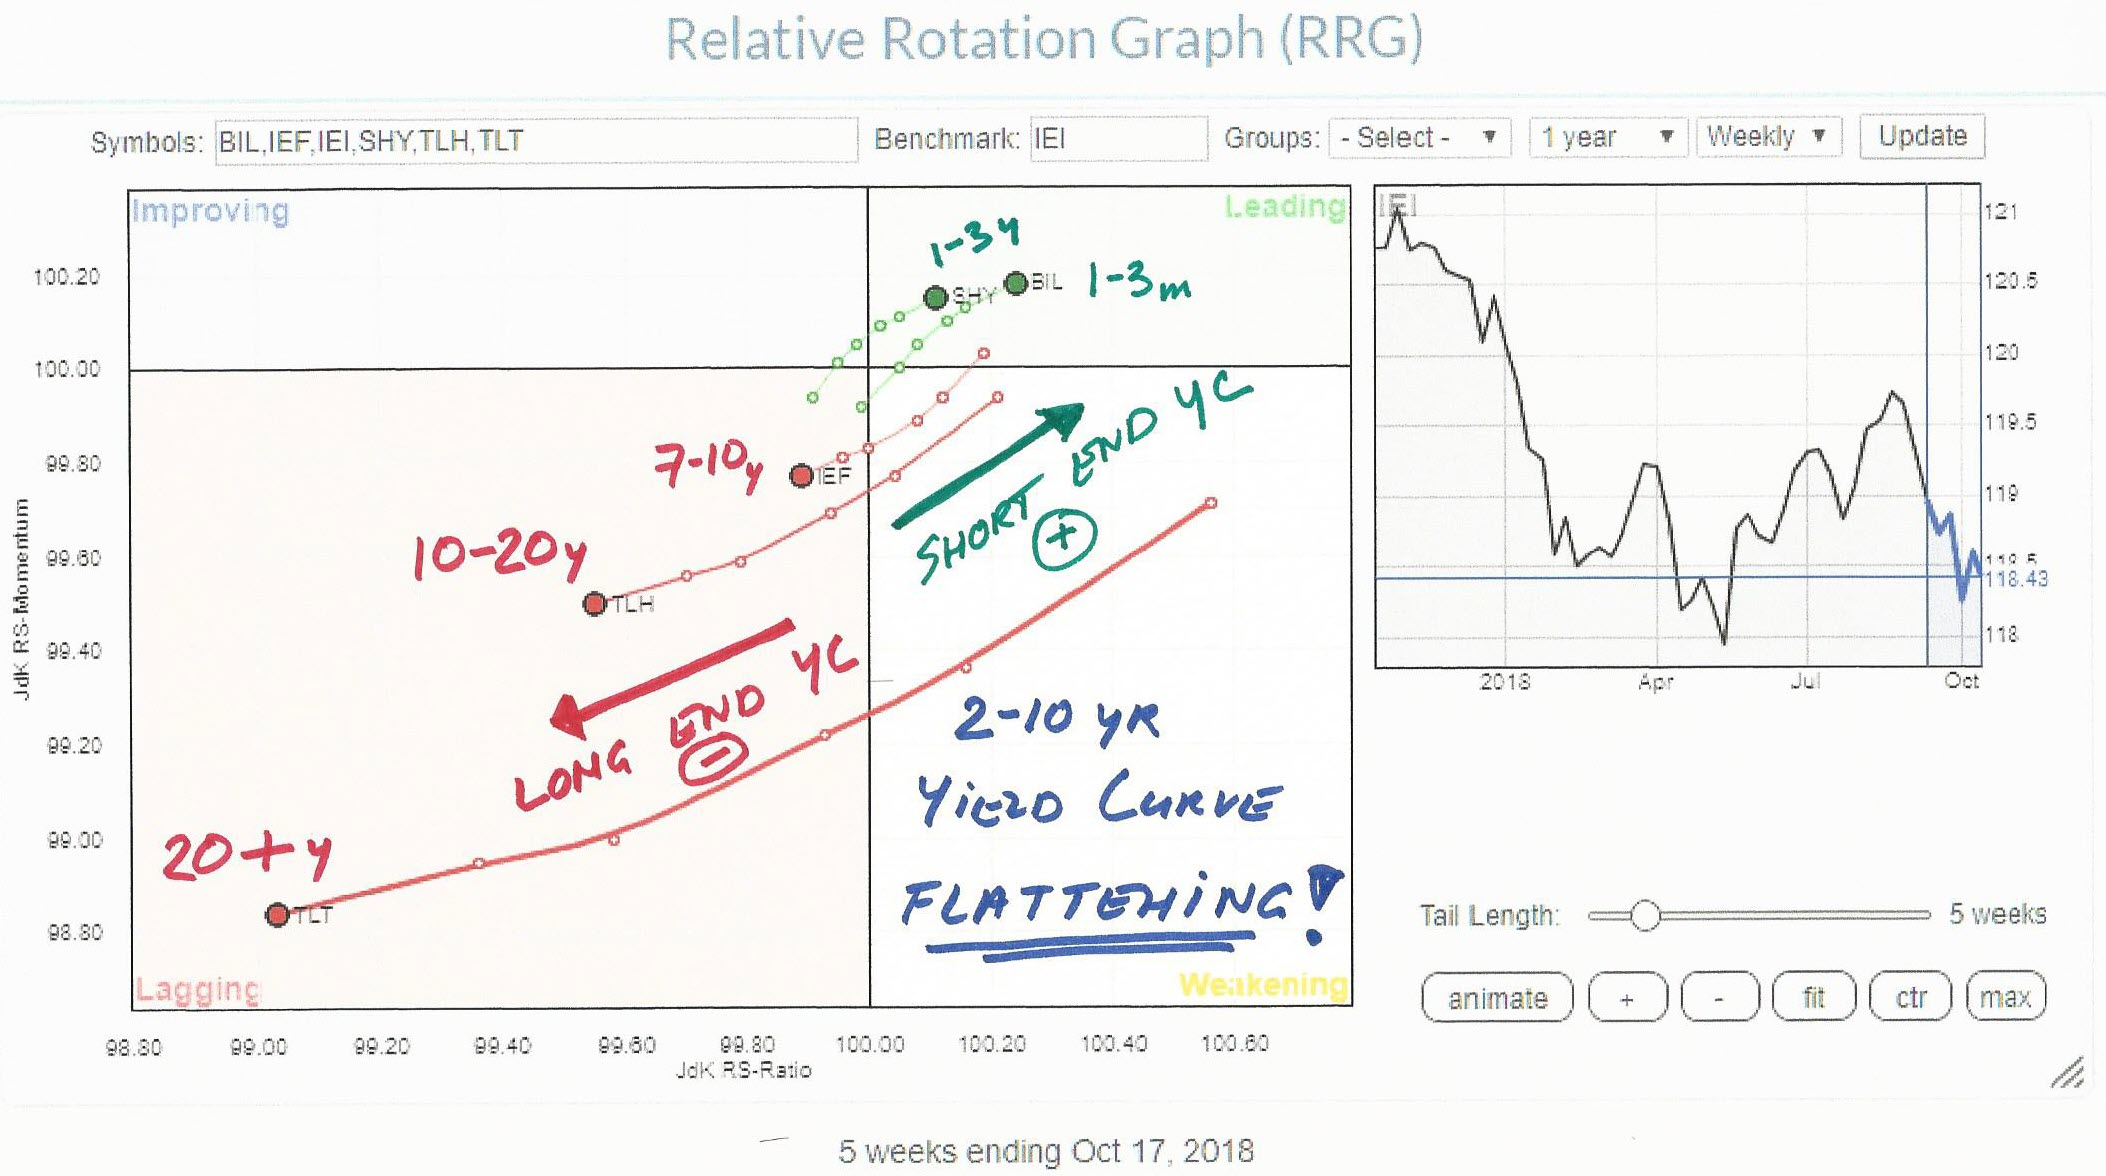
Is the bond market sending us a message?

by Julius de Kempenaer,
Senior Technical Analyst, StockCharts.com
When markets are in transition and the bigger picture needs our attention it is always good to keep an eye on the yield curve.
The absolute yield levels of the various maturities on the curve, starting at 3-Months all the way out to 20+ years are important to monitor. But...
READ MORE
MEMBERS ONLY

DP Alert: Sector Signal Scoreboard Pocked with New Neutral Signals
by Erin Swenlin,
Vice President, DecisionPoint.com
A mere two weeks ago, the Sector Signal Scoreboard (2nd slide below) was all "green" as each sector was on IT Trend Model BUY signals. The DP Scoreboards below were completely green at the beginning of September. Today both are dotted with Neutral signals (and some SELL signals...
READ MORE
MEMBERS ONLY

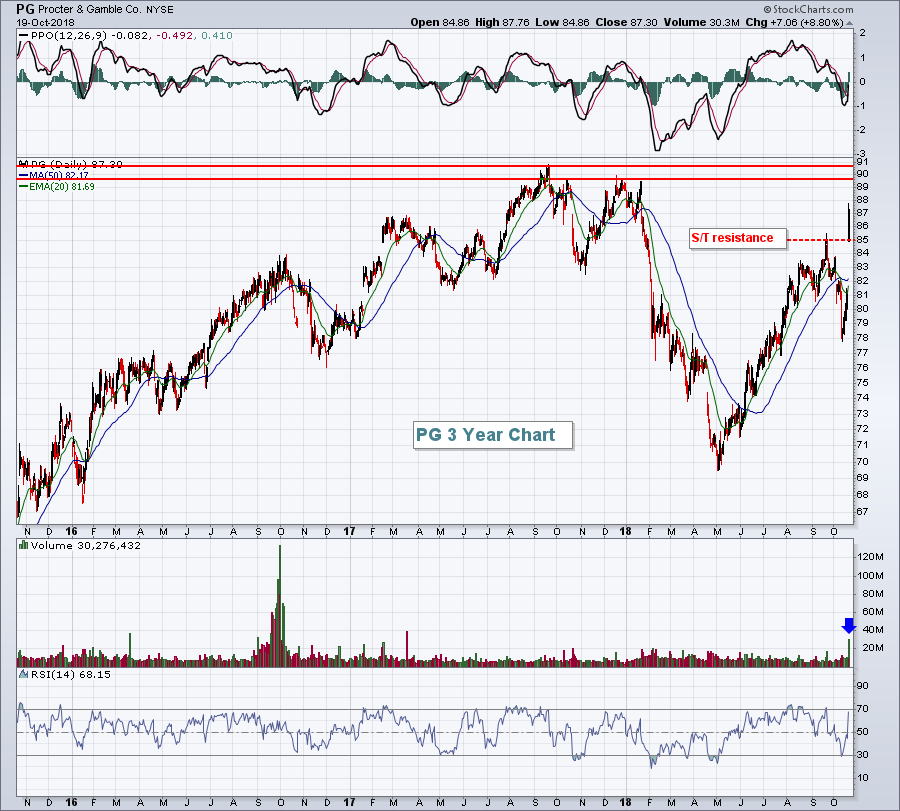
HEALTHCARE HAS BECOME THE YEAR' STRONGEST SECTOR -- AND IS BEING LED HIGHER BY DRUG STOCKS -- JOHNSON & JOHNSON IS THE DAY'S DRUG LEADER -- LILLY, MERCK, AND PFIZER NEAR NEW RECORDS
by John Murphy,
Chief Technical Analyst, StockCharts.com
DEFENSIVE HEALTHCARE SECTOR CONTINUES TO LEAD ... Healthcare has emerged as the market's strongest sector. Not only has healthcare been the market's strongest sector over the last month, the last three months, and the last six months. It's now the top performer for the year....
READ MORE
MEMBERS ONLY

October is Different from February
by Arthur Hill,
Chief Technical Strategist, TrendInvestorPro.com
The 200-day SMA acts as a benchmark we can use to compare price movements. We can use the 200-day SMA to compare the current decline in the S&P 500 against past declines. We can also use the 200-day SMA to compare the decline in the S&P...
READ MORE
MEMBERS ONLY

SystemTrader - Testing and Flirting with the 200-day Moving Average
by Arthur Hill,
Chief Technical Strategist, TrendInvestorPro.com
* A Self-Fulfilling Prophecy?
* Ranges Wreak Havoc on Moving Average Systems.
* Backtesting Five Indexes.
* More Whipsaws than Strong Trends.
* Other Uses for the 200-day SMA...
... The S&P 500 broke its 200-day SMA with a sharp decline last Thursday and then rebounded over the last three days to reclaim this...
READ MORE
MEMBERS ONLY
Dow Jones Gains Over 500 On Strong Earnings
by Tom Bowley,
Chief Market Strategist, EarningsBeats.com
Market Recap for Tuesday, October 16, 2018
Wall Street welcomed a trend day to at least temporarily pause the violent downtrend we've experienced the past couple weeks. A trend day typically starts with a gap higher and then gains are extended throughout the session. We clearly saw that...
READ MORE
MEMBERS ONLY

Momentum - Rate of Change
by Greg Morris,
Veteran Technical Analyst, Investor, and Author
Too often I see a basic misunderstanding between Momentum, Rate of Change, and Price Difference. Let me try to make it clear. They are essentially the same thing.
Momentum
Momentum deals with the rate at which prices are changing, kind of like acceleration and deceleration. Here is the formula for...
READ MORE
MEMBERS ONLY
Markets are cracking. Is it just another dip or are we witnessing a bigger event in the making?
by Julius de Kempenaer,
Senior Technical Analyst, StockCharts.com
The general market conditions for the various major indexes have been commented on extensively by other commentators here on the site. There is no doubt that there is more rumble in the markets now than we have seen for a long time.
IMHO this makes it an interesting time for...
READ MORE
MEMBERS ONLY

This Entertainment Leader is Still Crushing It
by Arthur Hill,
Chief Technical Strategist, TrendInvestorPro.com
The S&P 500 fell to its lowest level since early July and pierced its 200-day moving average last week. Chartists looking for stocks that held up better during this decline can use these levels for comparison. Stocks that did not break below their August lows and 200-day moving...
READ MORE
MEMBERS ONLY

Welcome to 'Analyzing India'!
by Milan Vaishnav,
Founder and Technical Analyst, EquityResearch.asia and ChartWizard.ae
I seize this opportunity to welcome you all to this Blog "Analyzing India".
It is beyond all doubts that India remains one of the most important global markets. Out of all the Emerging Markets (EMs), the world's largest democracy certainly remains the most promising one.
As...
READ MORE
MEMBERS ONLY
Irrational Exuberance? Yes - OEX Loses IT Trend Model BUY Despite Rally
by Erin Swenlin,
Vice President, DecisionPoint.com
This morning on MarketWatchers LIVE, Tom and I were very cautious regarding today's rally. John Murphy and Arthur Hill are bearish. Carl is undecided but erring on the side of caution. So it was somewhat surprising and cause for a chuckle to see and hear the ridiculously excited...
READ MORE
MEMBERS ONLY

Introducing Milan Vaishnav, CMT, MSTA and "Analyzing India"
by Grayson Roze,
Chief Strategist, StockCharts.com
It is my distinct pleasure to welcome Milan Vaishnav, CMT, MSTA to the StockCharts family. As our newest contributing author, Milan will be sharing his analysis of the Indian markets each week through the "Analyzing India" blog. We are thrilled to have Milan on board and greatly look...
READ MORE
MEMBERS ONLY
The Yield Spread (Curve) Is Worrisome For Banks
by Tom Bowley,
Chief Market Strategist, EarningsBeats.com
Market Recap for Monday, October 15, 2018
A late afternoon selling binge pushed our major indices into negative territory by the close, with the lone exception being the small cap Russell 2000 ($RUT), which avoided a relative breakdown vs. the benchmark S&P 500. Small caps have been languishing...
READ MORE
MEMBERS ONLY
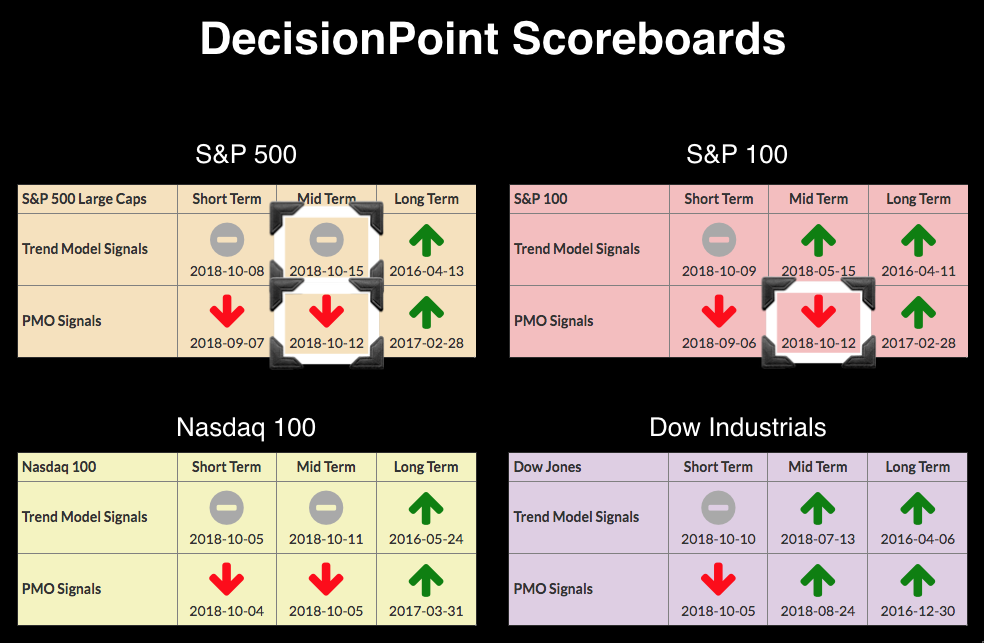
Intermediate-Term Trend Model NEUTRAL on SPX! More Buy Signals Extinguished
by Erin Swenlin,
Vice President, DecisionPoint.com
I've been updating these Scoreboards frequently starting on October 5th. Three very important signal changes arrived Friday and today. We don't generally see many updates to the Intermediate-Term Price Momentum Oscillator (PMO), but on Friday both the SPX and OEX followed the NDX and logged SELL...
READ MORE
MEMBERS ONLY

Ultra Beauty Turns After Pullback
by Arthur Hill,
Chief Technical Strategist, TrendInvestorPro.com
The broad market environment is a bit shaky right now, but Ultra Beauty (ULTA) is holding up relatively well with a normal pullback after a big breakout.
First and foremost, the stock is in a long-term uptrend after a breakout, surge and 52-week high in September. Also note that the...
READ MORE
MEMBERS ONLY
History Says To Watch Those 60 Minute Charts For Bottoming Clues
by Tom Bowley,
Chief Market Strategist, EarningsBeats.com
Market Recap for Friday, October 12, 2018
Finally, Wall Street saw buying pressure to end a trading session. That certainly felt great psychologically, although as I point out below, I doubt that the short-term bottom is in. It's possible, but the odds favor another short-term plunge. For now,...
READ MORE