MEMBERS ONLY
Capturing the US stock market from different angles using Relative Rotation Graphs

by Julius de Kempenaer,
Senior Technical Analyst, StockCharts.com
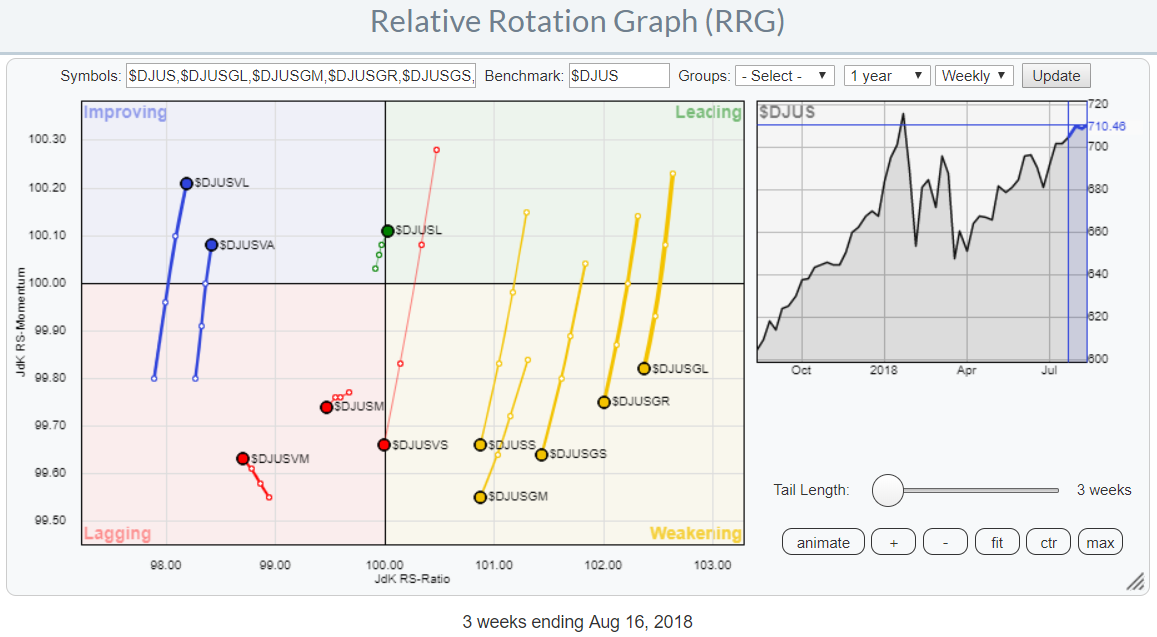
Instead of showing asset class rotation or sector rotation, Relative Rotation Graphs can also be used to show rotation among various market segments.
You have all seen or heard about a breakdown of the market in large-, mid-, and small-cap stocks. And maybe also the breakdown between growth and value...
READ MORE
MEMBERS ONLY
Throwback Thursday for Cerner

by Arthur Hill,
Chief Technical Strategist, TrendInvestorPro.com
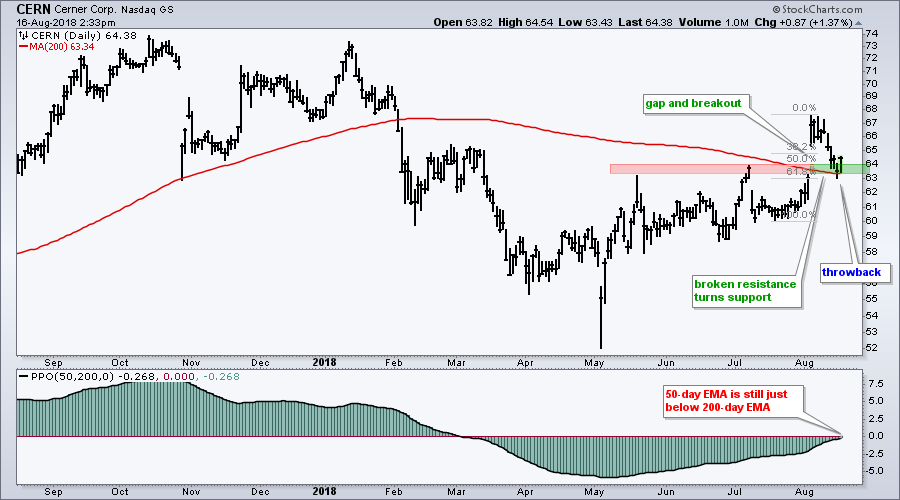
Cerner (CERN) remains in a long-term downtrend, but the stock broke a resistance level and pulled back to this breakout zone, which now turns into support. This is called a throwback and it could offer a second chance to partake in the breakout.
First and foremost, CERN is in the...
READ MORE
MEMBERS ONLY

STOCKS IN STRONG REBOUND AFTER SURVIVING TEST OF 50-DAY AVERAGES YESTERDAY -- ALL SECTORS ARE IN THE BLACK -- A REBOUND IN FOREIGN MARKETS IS ALSO HELPING -- NEWS OF CHINA NEGOTIATIONS MAY ALSO BE SUPPORTING THE STOCK UPTURN

by John Murphy,
Chief Technical Analyst, StockCharts.com
MAJOR STOCK AVERAGES REBOUND SHARPLY... U.S. stock indexes are having an unusually strong day. Chart 1 shows the Dow Jones Industrial Average climbing more than 400 points (1.6%) in afternoon trading. The Dow tested its 50-day average yesterday and held. Chart 2 shows the S&P 500...
READ MORE
MEMBERS ONLY
This Is How I Use The RSI

by Tom Bowley,
Chief Market Strategist, EarningsBeats.com
Note
I'll be traveling and on vacation this week, so my blog articles will focus on very brief topics regarding current market themes or my own trading strategies. I'll return to my "normal" blog postings regarding market action, outlook, historical tendencies, etc. when I...
READ MORE
MEMBERS ONLY

More Evidence Of A Commodity Bear Market

by Martin Pring,
President, Pring Research
* Commodities starting to generate some long-term sell signals
* Internals and commodity intermarket relationships are deteriorating
* Energy has been lagging on the downside but may be ready to play catch up
Earlier in the summer I wrote a couple of articles on copper and oil suggesting some short-term vulnerability, but concluding...
READ MORE
MEMBERS ONLY

FOREIGN STOCKS LEAD U.S. LOWER -- EMERGING MARKETS AND EAFE ISHARES FALL TO LOWEST LEVEL IN A YEAR -- STRONGER DOLLAR AND WEAKNESS IN CHINA PUSH METALS LOWER AND STOCKS TIED TO THEM -- ENERGY STOCKS ARE ALSO WEAKENING WITH OIL
by John Murphy,
Chief Technical Analyst, StockCharts.com
FOREIGN STOCK ETFS FALL TO NEW LOWS... Last Thursday's message expressed concern that weakness in foreign stocks could start to weigh on U.S. stocks, especially with the S&P 500 testing major resistance at its January high. That dangerous situation has taken a turn for the...
READ MORE
MEMBERS ONLY
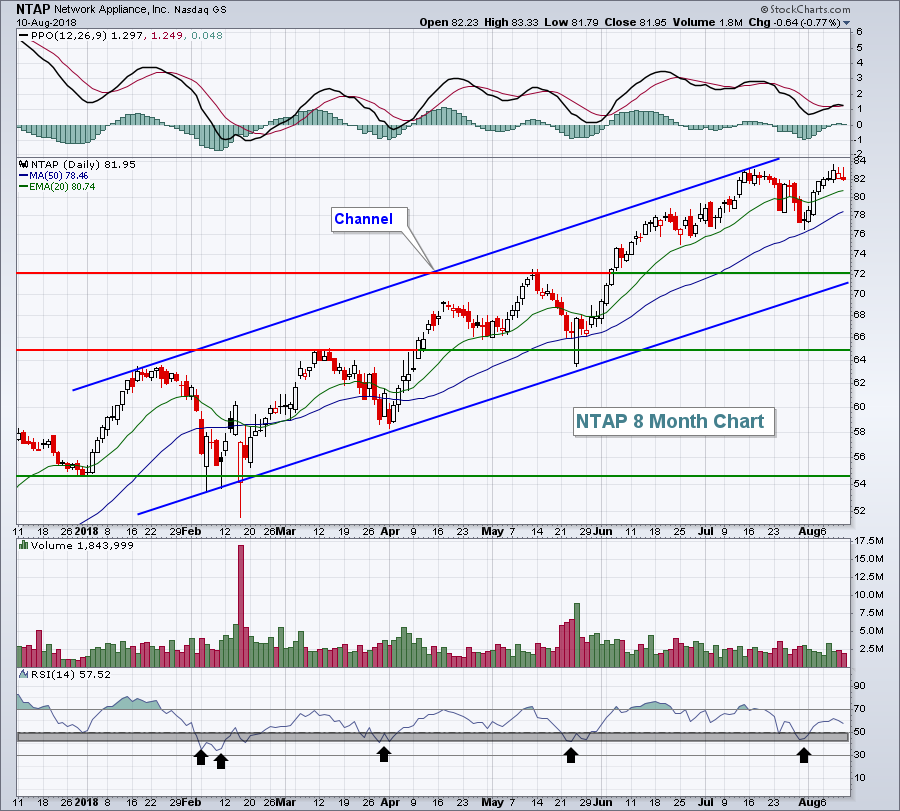
Combining The PPO And 20 Day EMA For Short-Term Trading
by Tom Bowley,
Chief Market Strategist, EarningsBeats.com
Note
I'll be traveling and on vacation this week, so my blog articles will focus on very brief topics regarding current market themes or my own trading strategies. I'll return to my "normal" blog postings regarding market action, outlook, historical tendencies, etc. when I...
READ MORE
MEMBERS ONLY
Beneficiaries Of A Strengthening Dollar
by Tom Bowley,
Chief Market Strategist, EarningsBeats.com
Note
I'll be traveling and on vacation this week, so my blog articles will focus on very brief topics regarding current market themes or my own trading strategies. I'll return to my "normal" blog postings regarding market action, outlook, historical tendencies, etc. when I...
READ MORE
MEMBERS ONLY

An Island Reversal for SPY - Minding the Gap
by Arthur Hill,
Chief Technical Strategist, TrendInvestorPro.com
* An Island Reversal for SPY.
* XLI and Lead the Gap Parade.
* SOXX Leads Tech Lower with Gap.
* IAI Forges Lower Highs.
* ITB Hits New Low for Year.
* Utes and Telecom Hold Up.
... There were short-term reversals last week as a number of stocks and ETFs gapped up on Tuesday and...
READ MORE
MEMBERS ONLY

Getting Through The Old Highs Could Be A Challenge
by Martin Pring,
President, Pring Research
* Last week's test of the highs leaves a lot to be desired
* Breadth and momentum indicators fail to confirm
* Some international charts not looking so good
Last week's test of the highs leaves a lot to be desired
If the charts in this article look a...
READ MORE
MEMBERS ONLY
Value seems to be taking over from growth while small-caps are losing ground
by Julius de Kempenaer,
Senior Technical Analyst, StockCharts.com
Every now and then I run a Relative Rotation Graph showing the rotation of various size and value/growth indices for the US market. They (can) give good insights into what areas of the stock market are in favor and which ones are rotating out of favor.
At the moment...
READ MORE
MEMBERS ONLY
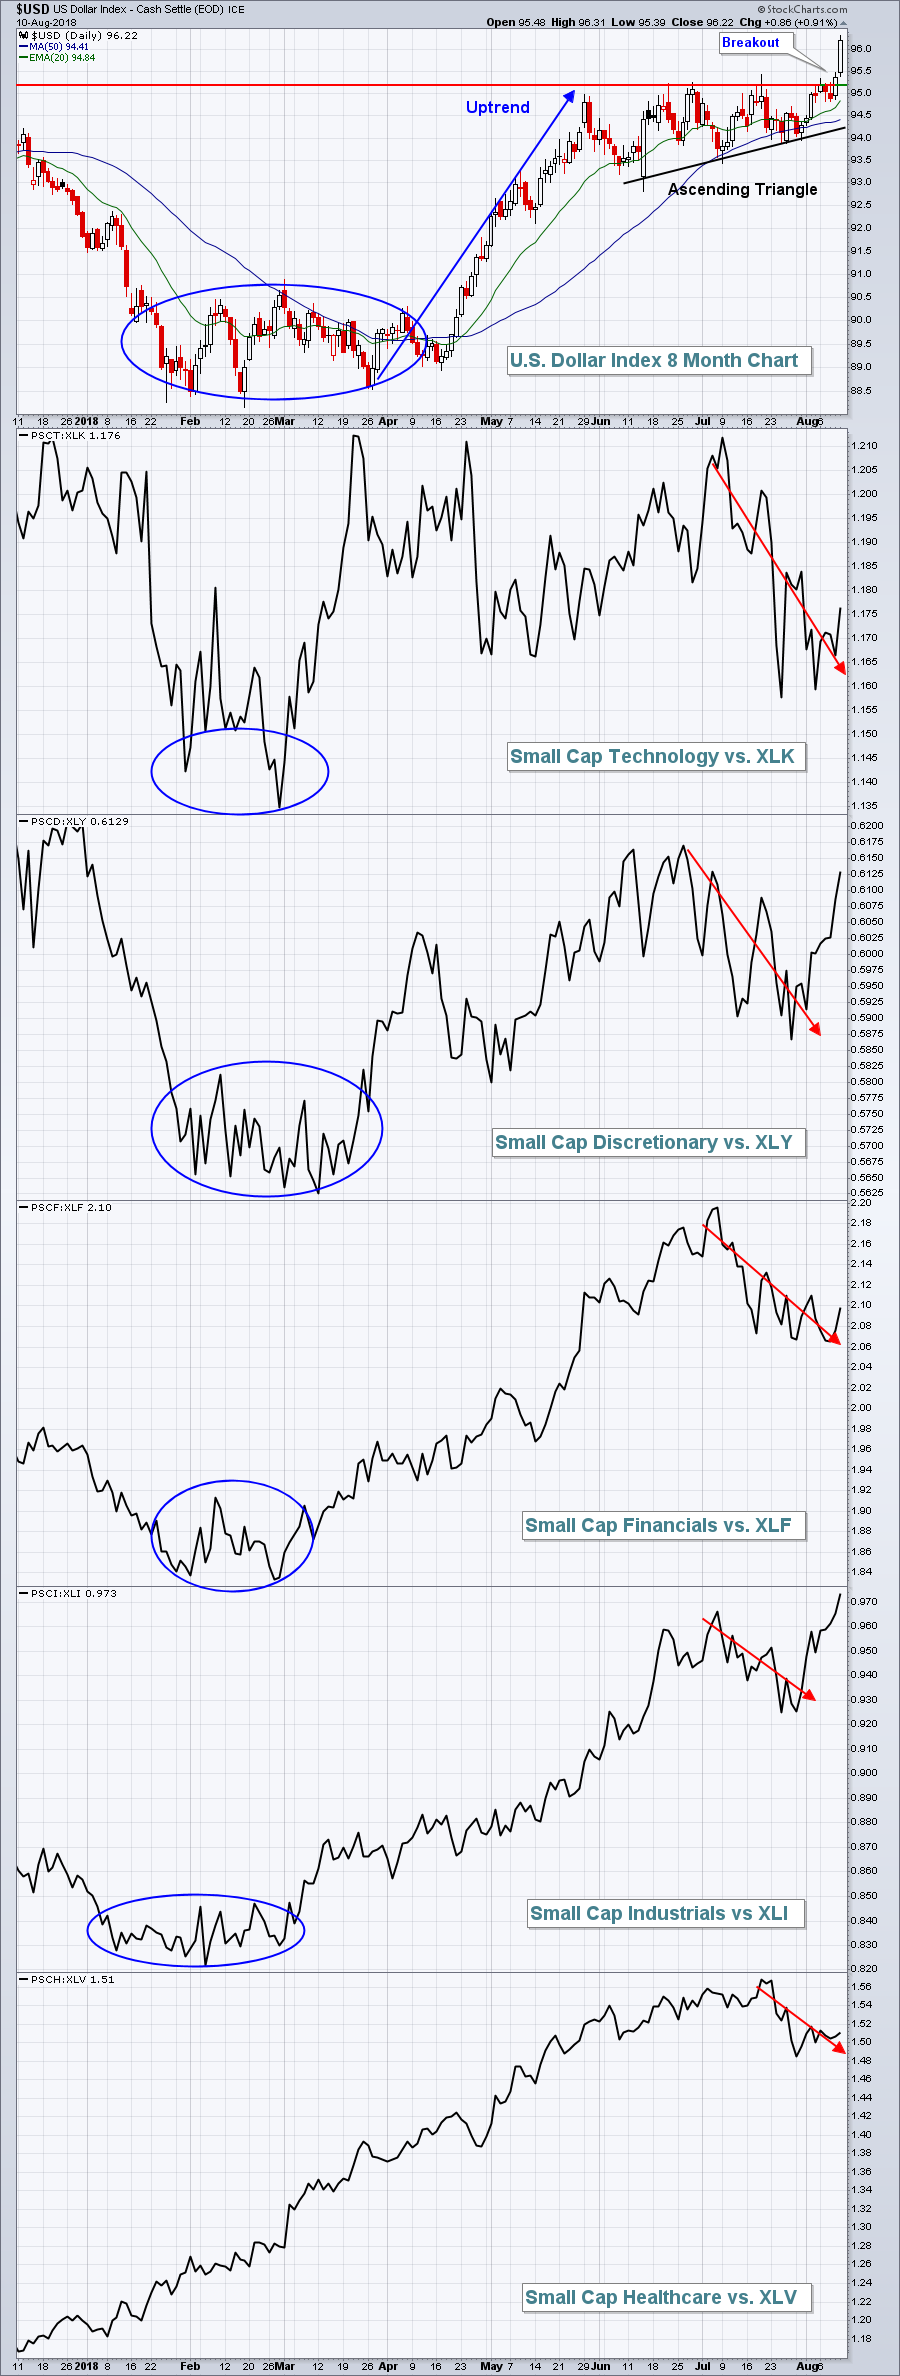
Dollar Breakout Signals Resurgence In Small Cap Relative Strength
by Tom Bowley,
Chief Market Strategist, EarningsBeats.com
Note
I'll be traveling and on vacation this week, so my blog articles will focus on very brief topics regarding current market themes or my own trading strategies. I'll return to my "normal" blog postings regarding market action, outlook, historical tendencies, etc. when I...
READ MORE
MEMBERS ONLY

Anadarko Gets a Mean-Reversion Bounce
by Arthur Hill,
Chief Technical Strategist, TrendInvestorPro.com
Anadarko Petroleum (APC) has had quite a good year with a 25% gain in 2018 and 52-week highs in June and July. The stock fell over the last five weeks, but this decline is viewed as a correction within a bigger uptrend. Moreover, RSI became oversold and a mean-reversion bounce...
READ MORE
MEMBERS ONLY

Weekly Market Review and Outlook (with Video) - Small-Caps Lead and Bonds Spring
by Arthur Hill,
Chief Technical Strategist, TrendInvestorPro.com
* Weekly Performance Review.
* Market Overview.
* A Correction for the S&P 500?
* First Levels to Watch for SPY.
* QQQ Double Top - NOT!
* IJR is Holding up Just Fine.
* XLV, XLK and XLY are Leading.
* XLI and XLF Hit Resistance.
* XLE Remains Stuck (plus XES).
* Oil Corrects within Uptrend....
READ MORE
MEMBERS ONLY
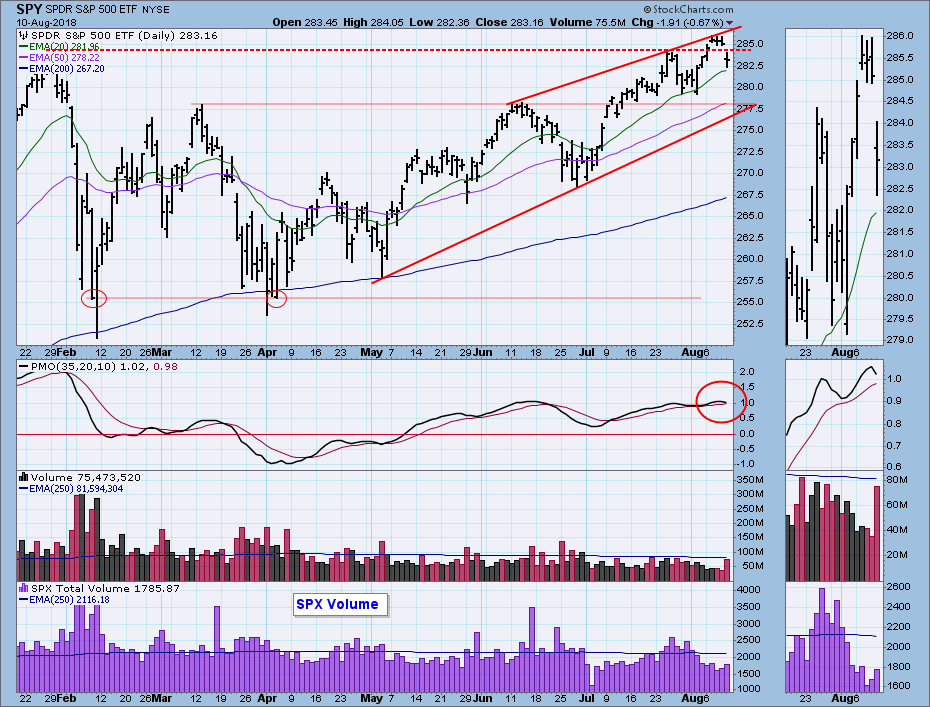
DP Weekly Wrap: Skinny Breakout Fails

by Carl Swenlin,
President and Founder, DecisionPoint.com
Last week I said I expected to see new, all-time highs for SPY, and on Monday that expectation was fulfilled in a marginal way. While I didn't say I expected that the market would close higher this week, it was implied, but the market's low volume...
READ MORE
MEMBERS ONLY
Banks Showing Renewed Strength; ChartCon FINAL CALL
by Tom Bowley,
Chief Market Strategist, EarningsBeats.com
ChartCon Starts Today!
If you haven't already, I'd highly recommend that you join me and many of my StockCharts.com colleagues from around the globe for ChartCon 2018. We did our rehearsals and walkthroughs yesterday and my great friend Greg Schnell kicks off the conference in...
READ MORE
MEMBERS ONLY

U.S. STOCKS MAY BE GETTING TOO FAR AHEAD OF THE REST OF THE WORLD -- U.S. STOCKS USUALLY DO BETTER WHEN FOREIGN STOCKS ARE ALSO RISING -- U.S. STOCK RECORDS IN 2012 AND 2016 WERE SUPPORTED BY RISING FOREIGN SHARES
by John Murphy,
Chief Technical Analyst, StockCharts.com
S&P 500 IS TESTING ITS JANUARY HIGH ... The black bars in Chart 1 show the S&P 500 nearing a test of its January high. That's an important test for it and the rest of the market. A test of a previous high is very...
READ MORE
MEMBERS ONLY
When Financials Lead On A Relative Basis, This Usually Happens
by Tom Bowley,
Chief Market Strategist, EarningsBeats.com
Market Recap for Wednesday, August 8, 2018
Wall Street ended Wednesday's action in a bifurcated state as the NASDAQ withstood a final 20 minute selloff to finish with a slight 4 point gain. The other major indices finished lower, but just fractionally so. In sector performance, slight gains...
READ MORE
MEMBERS ONLY

DP Alert: New PMO BUY Signal on NDX - Dollar Pulls Back a Little More

by Erin Swenlin,
Vice President, DecisionPoint.com
The DecisionPoint Scoreboards are nearly all "green" with BUY signals. Today the NDX completed its green Scoreboard with a PMO BUY signal on the daily chart. The Technology Sector (XLK) and the NDX ETF (QQQ) also logged new Short-Term PMO BUY signals. It appears the tech sector is...
READ MORE
MEMBERS ONLY

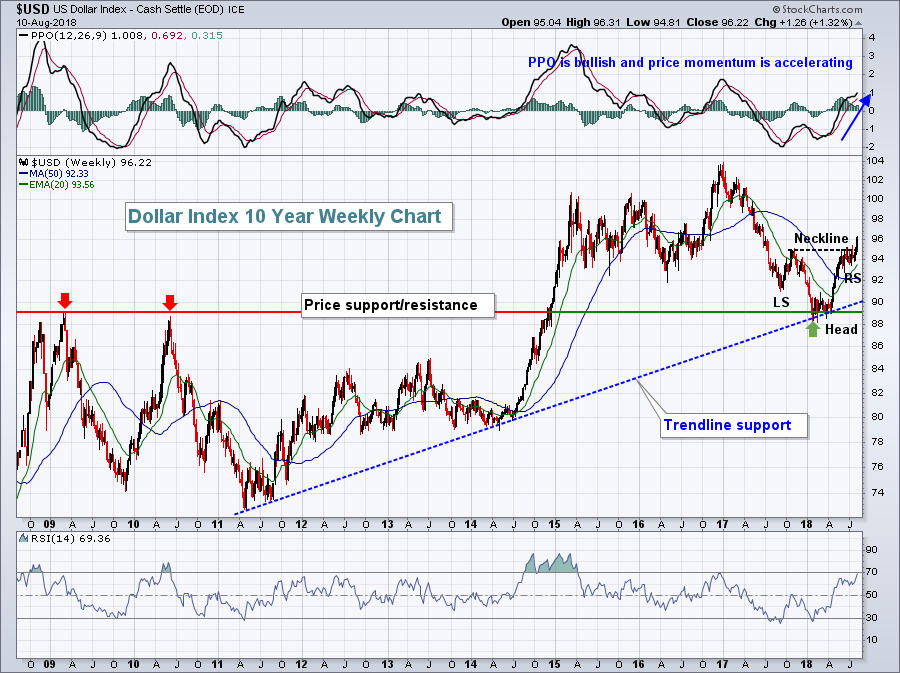
LONG-RANGE DOLLAR UPTREND REMAINS INTACT -- LATE CYCLE COMMODITY UPTURN IS UNLIKELY WITH A RISING DOLLAR -- STRONG DOLLAR FAVORS U.S. OVER FOREIGN STOCKS -- ESPECIALLY EMERGING MARKETS
by John Murphy,
Chief Technical Analyst, StockCharts.com
LONG-TERM TREND OF THE DOLLAR IS STILL UP... The direction of the U.S. dollar is important because it influences (or is influenced by) by a lot of other markets. That includes commodities, global interest rates, and global stocks. Dollar direction also influences the relative performance of small cap stocks...
READ MORE
MEMBERS ONLY
Energy And Industrials Lead Wall Street Rally, But Here's The Bullish News
by Tom Bowley,
Chief Market Strategist, EarningsBeats.com
Market Recap for Tuesday, August 7, 2018
It was another nice rally on Wall Street, led by energy (XLE, +0.74%) and industrials (XLI, +0.71%). Since the beginning of July, we've seen renewed strength in larger cap stocks. Industials, along with financials (XLF, +0.46%) have been...
READ MORE
MEMBERS ONLY
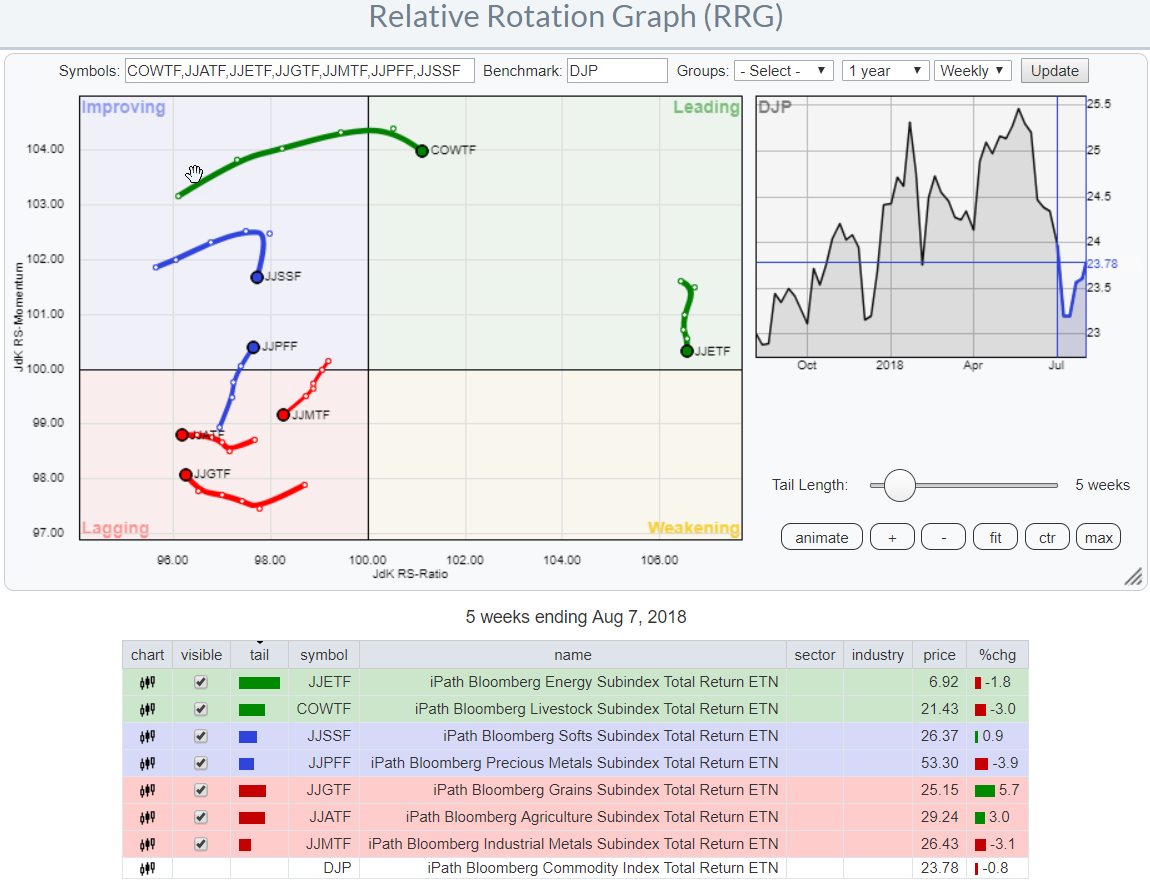
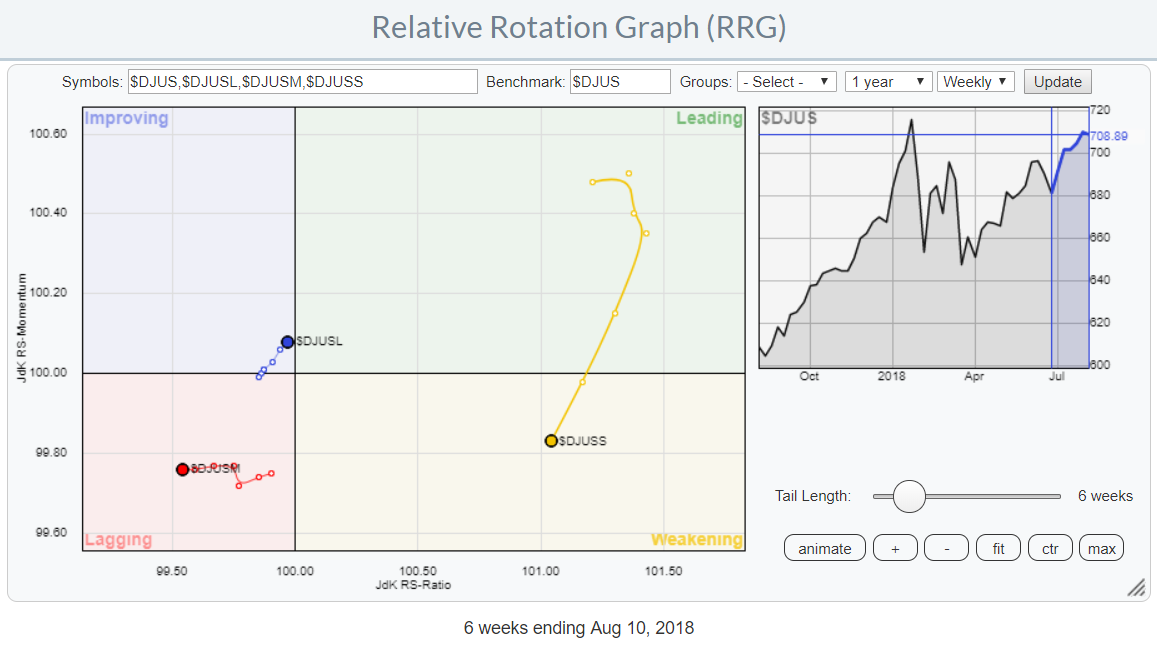
Relative Rotation Graphs can show (much) more than just equity sectors (extended)
by Julius de Kempenaer,
Senior Technical Analyst, StockCharts.com
Relative Rotation Graphs are a great tool to visualize equity sector rotation and they are probably most used for that purpose. However, there are many more areas where RRGs can be used to get a big picture view of what is going on among a group of securities or related...
READ MORE
MEMBERS ONLY

Dollar Gains Momentum, PMO BUY Signal Triggered
by Erin Swenlin,
Vice President, DecisionPoint.com
Yesterday's breakout on UUP was impressive and although the Dollar pulled back slightly today, it didn't matter to the Price Momentum Oscillator (PMO) as it crossed its signal line and triggered a BUY signal.
While studying the OHLC chart for UUP, I realized if I looked...
READ MORE
MEMBERS ONLY

FINANCIAL SPDR ACHIEVES BULLISH BREAKOUT -- INDUSTRIAL SPDR MAY BE NEXT -- MATERIALS SPDR REGAINS MOVING AVERAGE LINES -- THE DOW INDUSTRIALS AND TRANSPORTS ARE BREAKING OUT TOGETHER -- THE S&P 500 NEARS TEST OF JANUARY HIGH
by John Murphy,
Chief Technical Analyst, StockCharts.com
FINANCIALS SPDR BREAKS OUT ... Global stocks are having a strong day. Rebounds in foreign developed and emerging markets set the tone for higher trading in the states. All major U.S. indexes are in the black, as are most stock sectors. The strongest sectors are energy, financials, industrials, and materials....
READ MORE
MEMBERS ONLY
Weight of the Evidence

by Greg Morris,
Veteran Technical Analyst, Investor, and Author
In my recent Building a Rules-Based Trend Following Model series, I talked extensively about the Weight of the Evidence. This is my measure to tell me what the market is doing based upon nine different technical measures made up of price, breadth, and relative strength (PBR, like the beer). Tushar...
READ MORE
MEMBERS ONLY
Small Caps Ready To Flourish With Dollar Surge? Watch This Signal
by Tom Bowley,
Chief Market Strategist, EarningsBeats.com
Market Recap for Monday, August 6, 2018
The Russell 2000 and NASDAQ paced a day of strength on Wall Street as they gained 0.65% and 0.61%, respectively. The S&P 500 and Dow Jones enjoyed smaller gains as money rotated back towards more aggressive areas. The 10...
READ MORE
MEMBERS ONLY

Are We Seeing The Early Sign Of A Change In Market Leadership?
by Martin Pring,
President, Pring Research
* The Inflation/Deflation ratio
* Lagging sectors
* Defensive sectors
The Inflation/Deflation ratio
Last week I charted my Inflation/deflation ratio for the first time in a while and was surprised to see that it had broken to the downside. For those unfamiliar with the concept, the Inflation Ratio (!PRII) consists...
READ MORE
MEMBERS ONLY
Friday Action Bifurcated As Dollar Awaiting Bullish Breakout
by Tom Bowley,
Chief Market Strategist, EarningsBeats.com
Market Recap for Friday, August 3, 2018
The stock market has clearly turned more defensive over the past 2-3 months and Friday was another perfect example of that. The more aggressive small cap Russell 2000 was the laggard, dropping 0.52%. Meanwhile, the NASDAQ produced only a minor 0.12%...
READ MORE
MEMBERS ONLY

Gilead Gets another Bollinger Band Squeeze
by Arthur Hill,
Chief Technical Strategist, TrendInvestorPro.com
Gilead is in the midst of its fourth Bollinger Band squeeze in the past year. The last four instances foreshadowed pretty strong moves so I will be watching the current squeeze closely for the next directional clue.
A Bollinger Band squeeze occurs when the bands contract and the Bandwidth indicator...
READ MORE
MEMBERS ONLY

Homework Assignment

by Bruce Fraser,
Industry-leading "Wyckoffian"
ChartCon 2018 is fast approaching and preparations are being made. Let’s take a few minutes during this busy week to study some charts. For contrast we will compare the NASDAQ Composite, which is one of the leadership indexes, to the Dow Jones Industrials, which is a laggard.
A big...
READ MORE
MEMBERS ONLY

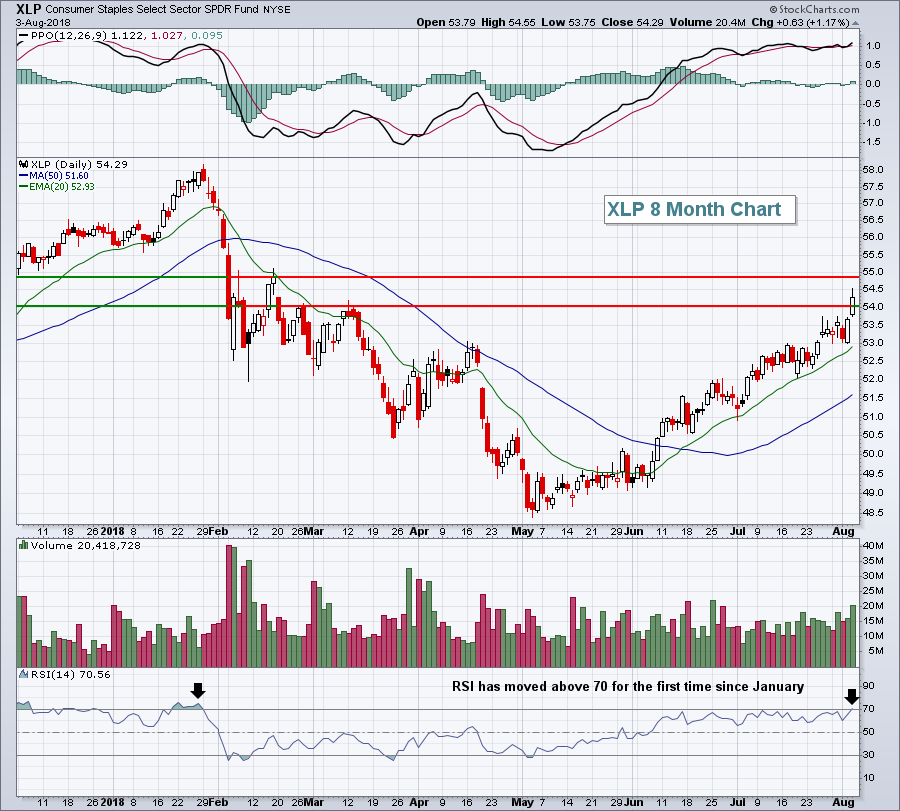
DEFENSIVE STOCKS ARE LEADING THE MARKET HIGHER -- CONSUMER STAPLES SPDR TURNS UP AND SHOWS MARKET LEADERSHIP -- SO DO UTILITIES AND REITS -- PHARMA IS LEADING HEALTHCARE SECTOR HIGHER -- ALL OF WHICH SUGGESTS INVESTORS MAY BE TURNING MORE DEFENSIVE
by John Murphy,
Chief Technical Analyst, StockCharts.com
CONSUMER STAPLES TURN UP... Although the stock market continued to climb this week, it's a little surprising to see defensive stocks leading it higher. The four strongest sectors this past week were REITs (+3.3%), healthcare (+2.1%), consumer staples (+1.7%), and utilities (+1.2%). All did...
READ MORE
MEMBERS ONLY
The Question Rarely Addressed - When Do I Sell?
by Tom Bowley,
Chief Market Strategist, EarningsBeats.com
Buying is so easy. When you pull that trigger to buy, optimism abounds. Maybe it was a recommendation from a friend. Perhaps there was water cooler talk of the next Apple (AAPL). You might even have uncovered it from a time-tested scan. The reason doesn't really matter. The...
READ MORE
MEMBERS ONLY
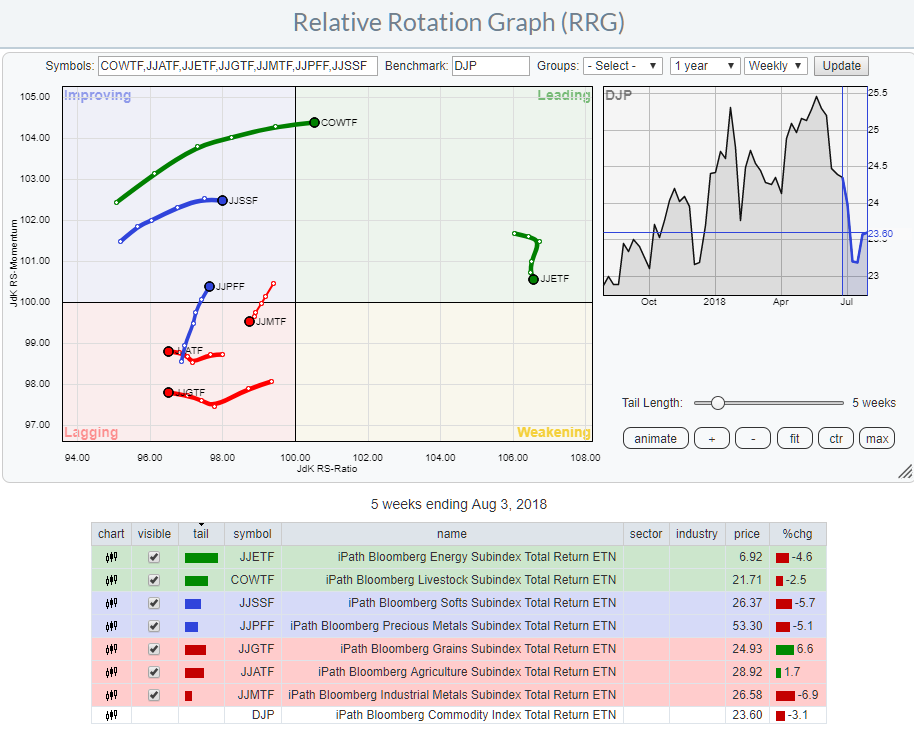
Relative Rotation Graphs can show (much) more than just equity sectors
by Julius de Kempenaer,
Senior Technical Analyst, StockCharts.com
Relative Rotation Graphs are a great tool to visualize equity sector rotation and they are probably most used for that purpose. However, there are many more areas where RRGs can be used to get a big picture view of what is going on among a group of securities or related...
READ MORE
MEMBERS ONLY
Finding Leading Stocks in Strong Uptrends (Trend Following)
by Arthur Hill,
Chief Technical Strategist, TrendInvestorPro.com
Trend following strategies are built on the premise that trends persist and we can make money by simply following the trend until it ends. There will be losers along the way, but a few strong trends will more than make up for the losses. It sounds great in theory, but...
READ MORE
MEMBERS ONLY
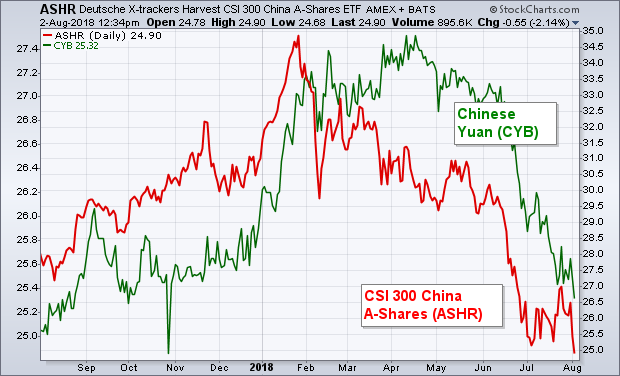
Selling in China Unsettles Global Stocks This Morning on Tariff Threats -- But US Stock Indexes Are Recovering from Early Selling
by John Murphy,
Chief Technical Analyst, StockCharts.com
Editors Note: This article was originally published in John Murphy's Market Message on Thursday, August 2nd at 1:43pm ET.
TARIFF THREATS PUSH CHINESE MARKETS LOWER ... Threats of higher tariffs on Chinese imports, combined with Chinese threats of retaliation, put international markets on the defensive today. It started...
READ MORE
MEMBERS ONLY
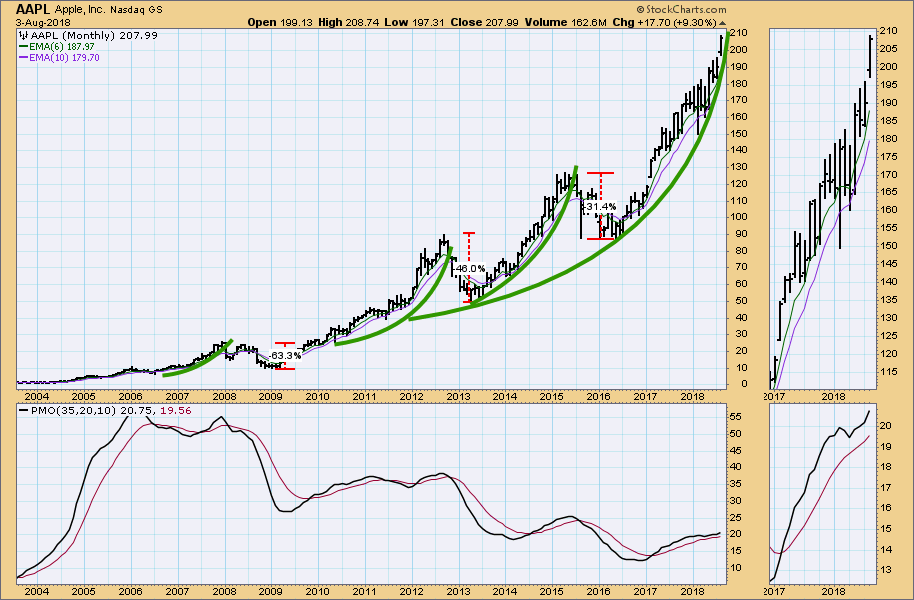
DP Weekly Wrap: Apple Hits $1 Trillion
by Carl Swenlin,
President and Founder, DecisionPoint.com
On Thursday, when Apple's (AAPL) market cap went over the $1 trillion mark, Dennis Gartman (The Gartman Letter) said something to the effect that this is the kind of thing we see at market tops, not in the middle of a long advance. I felt the same way....
READ MORE
MEMBERS ONLY
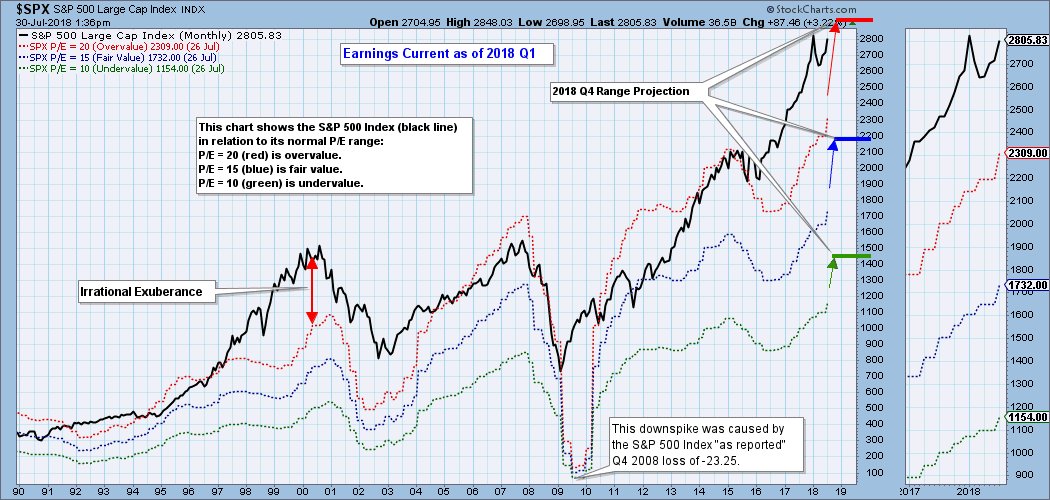
Fundamentals: Market Still Extremely Overvalued
by Carl Swenlin,
President and Founder, DecisionPoint.com
What's a technical guy doing talking about fundamentals? Well, I believe that charts of fundamental data are as useful as price charts in helping us visualize fundamental context and trends. In the case of earnings, the following chart shows us where the S&P 500 would have...
READ MORE
MEMBERS ONLY

Weekly Market Review and Outlook - 3 Sectors Pick up the Slack
by Arthur Hill,
Chief Technical Strategist, TrendInvestorPro.com
* Weekly Performance Review.
* Changing of the Guard Continues
* S&P SmallCap iShares Outperforms Russell 2000 iShares
* S&P 500 is in a Bull Market
* High-Low Lines Continue to Rise
* QQQ Becomes Short-term Oversold
* IJR Consolidates Near Highs
* Measuring Trend Strength with Stochastics
* XLF and XLI Challenge Resistance
* This...
READ MORE
MEMBERS ONLY
Apple Tops $1 Trillion Market Cap, Leads Technology Higher
by Tom Bowley,
Chief Market Strategist, EarningsBeats.com
Special Note
I will be traveling to Seattle this weekend for ChartCon 2018. My schedule the next two weeks is likely to be quite different and sporadic, perhaps posting articles during the trading day or possibly even after the market closes. If you've grown accustomed to my articles...
READ MORE
MEMBERS ONLY

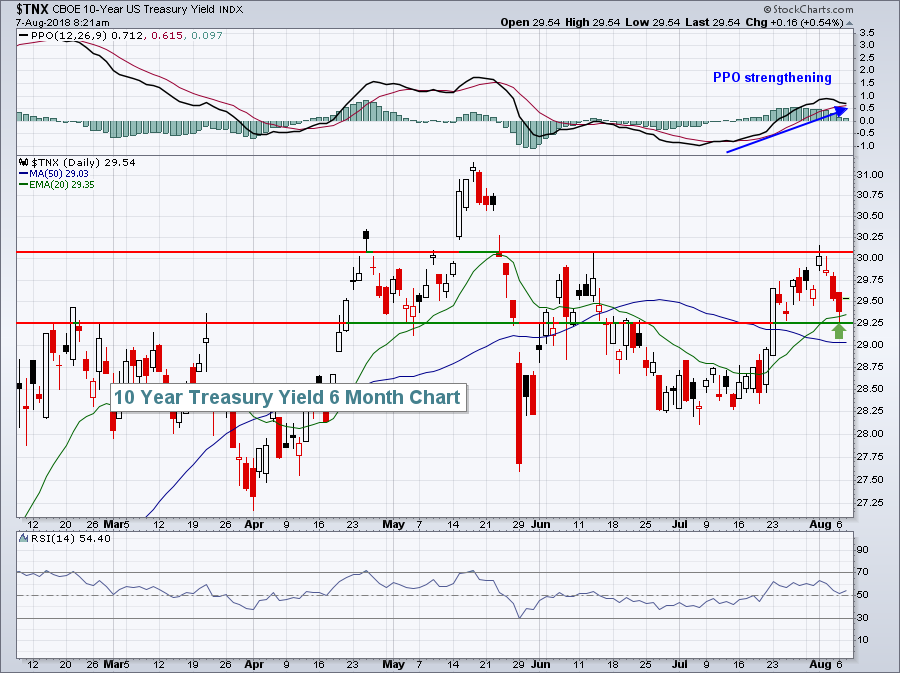
Bond Yields Hit Mega Resistance. Will They Go Through?
by Martin Pring,
President, Pring Research
* 3- and 10-year series challenging their secular down trendlines
* Three indicators that suggest lower bond yields
* The Crunch Chart
3- and 10-year series challenging their secular down trend lines
US government bond yields have reached very important resistance, at a time when they are overextended on a long-term momentum basis....
READ MORE