MEMBERS ONLY
Watch For These Seasonality Patterns in 2025

by Julius de Kempenaer,
Senior Technical Analyst, StockCharts.com
In this exclusive StockCharts video,Julius shares a new approach to seasonality by using a more granular, data-set constructed UDI (User Defined Index) for every sector. Using the UDI functionality on StockCharts.com allows Julius to plot the seasonal patterns for each sector forward to the end of 2025 and...
READ MORE
MEMBERS ONLY
Forget Technology and Take a Look at This Sector

by Martin Pring,
President, Pring Research
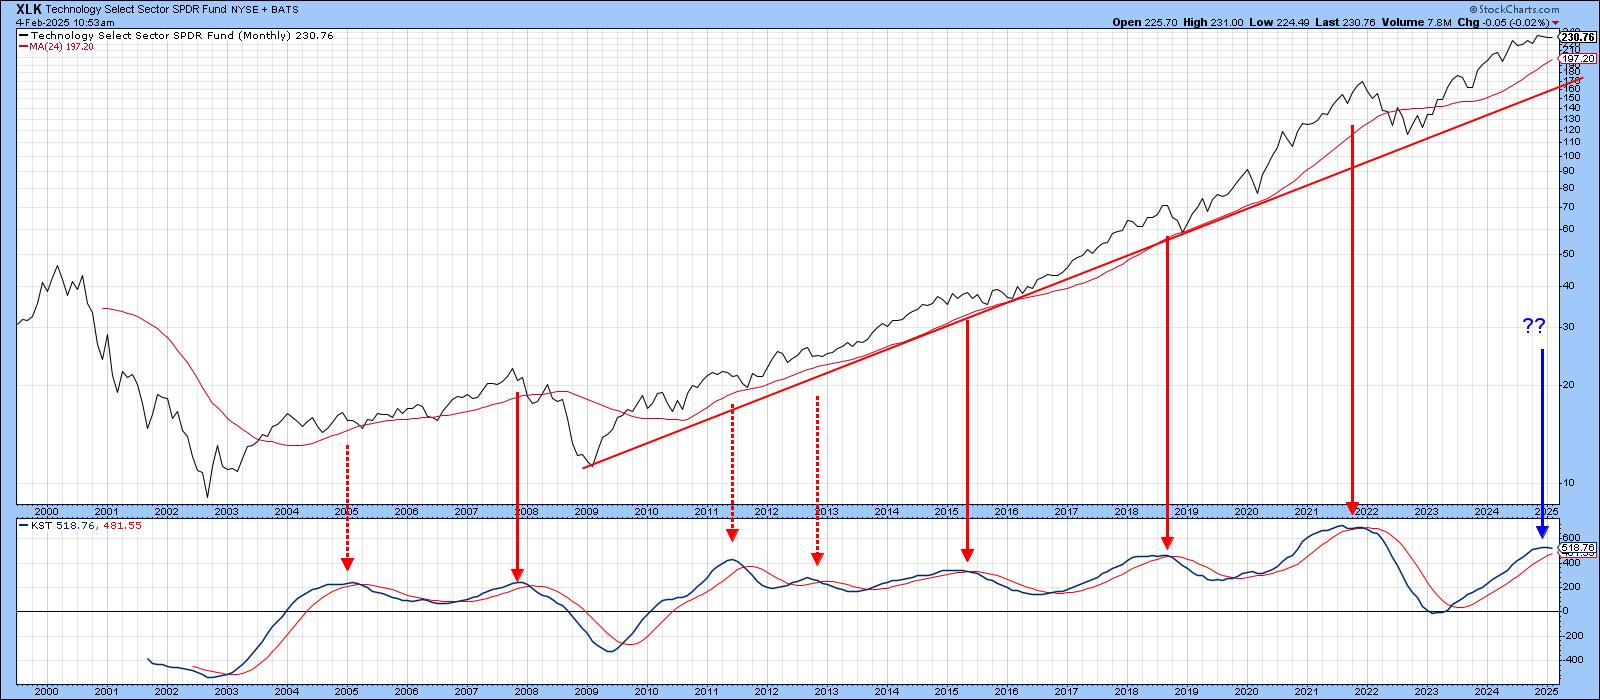
Technology stocks, in the form of the SPDR Technology ETF (XLK), have been on a tear since their secular low in 2009. That strength has not only resulted in higher absolute prices, but also striking relative action.
Chart 1 compares the XLK to its long-term KST. Reversals in this indicator...
READ MORE
MEMBERS ONLY

Walmart, Costco, and Sprouts: The Ultimate Trade War Survivors?

by Karl Montevirgen,
The StockCharts Insider
KEY TAKEAWAYS
* A breakout above resistance in Costco's stock price could see the stock move higher.
* Walmart's stock price continues to trend higher, but volume and momentum may be giving.
* Sprouts Farmers Markets Inc. has the momentum to take the stock price higher.
Monday's...
READ MORE
MEMBERS ONLY

BULLISH on These Options Trade Ideas

by Tony Zhang,
Chief Strategist, OptionsPlay
In this video, Tony shares his weekly market review, discussing growth vs. value, volatility, commodities, and more. From there, he shares his list of bearish and bullish options trade ideas, including META, AMGN, GOOGL, NVDA, DIS, and more.
This video premiered on February 3, 2025....
READ MORE
MEMBERS ONLY

Volatility ($VIX) May Be Providing Clues of a Big Market Drop

by Tom Bowley,
Chief Market Strategist, EarningsBeats.com
Secondary market signals are beginning to line up for a further drop, which can sometimes provide false signals. The primary indicator for me is always the combination of price/volume. When I only look at price/volume on the S&P 500, it still remains easy to be long...
READ MORE
MEMBERS ONLY

DP Trading Room: Tariff Trepidation

by Erin Swenlin,
Vice President, DecisionPoint.com
Trading is being affected by the scare of a trade war. With new tariffs being placed on Mexico, Canada and China, the market fell heavily on Friday. The same was occurring this morning, but then the tariff on Mexico was delayed by one month which helped the market breathe a...
READ MORE
MEMBERS ONLY
Be Careful With These Topping Candles
by Tom Bowley,
Chief Market Strategist, EarningsBeats.com
"When do I sell?" is easily the most-asked question I've received over the years. There are multiple answers to this question based on certain variables. The first key variable is whether you're a day trader, short-term swing trader, or long-term buy and holder. I...
READ MORE
MEMBERS ONLY
We're Topping With BEARISH Action Ahead!
by Tom Bowley,
Chief Market Strategist, EarningsBeats.com
Listen, I'm generally a fairly optimistic guy. I tend to see the good in the stock market, while many others continuously focus on potential selloffs ahead. I remain mostly bullish for good reason as the S&P 500 has risen 75% of all years since 1950. It...
READ MORE
MEMBERS ONLY
DeepSeek Rattles AI Stocks - Should You Buy The Dip?

by Mary Ellen McGonagle,
President, MEM Investment Research
In this video, Mary Ellen unpacks the week after the news drop roiled markets; coupled with major earnings reports, it's been a rough week. She highlights what drove the biggest winners last week as we head into one of the busiest time for earnings!
This video originally premiered...
READ MORE
MEMBERS ONLY
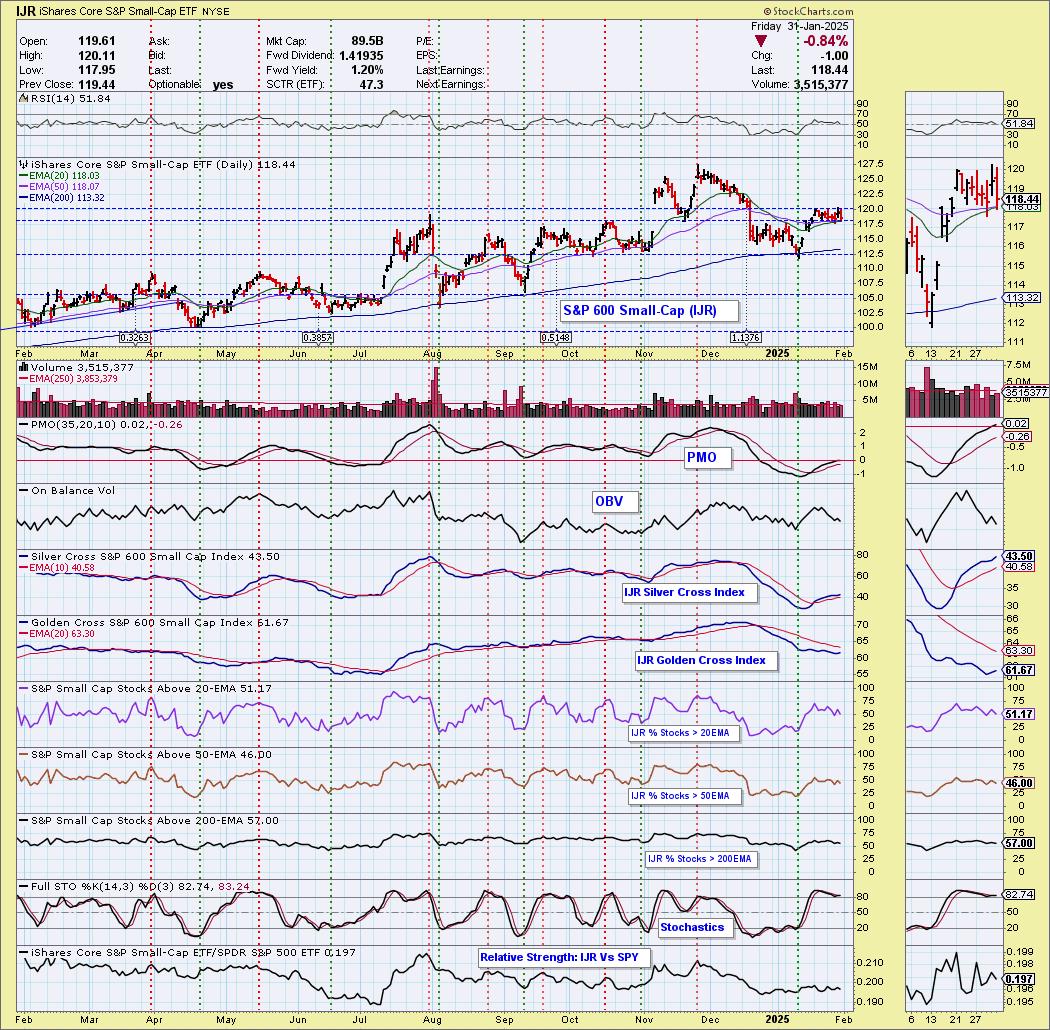
S&P 600 (IJR) Silver Cross BUY Signal May Arrive Too Late
by Erin Swenlin,
Vice President, DecisionPoint.com
Today on the S&P 600 (IJR), the 20-day EMA nearly crossed above the 50-day EMA for a "Silver Cross" IT Trend Model BUY Signal. Price is really going nowhere. Bulls might look at it as a bull flag, but the 'flag' is horizontal, not...
READ MORE
MEMBERS ONLY
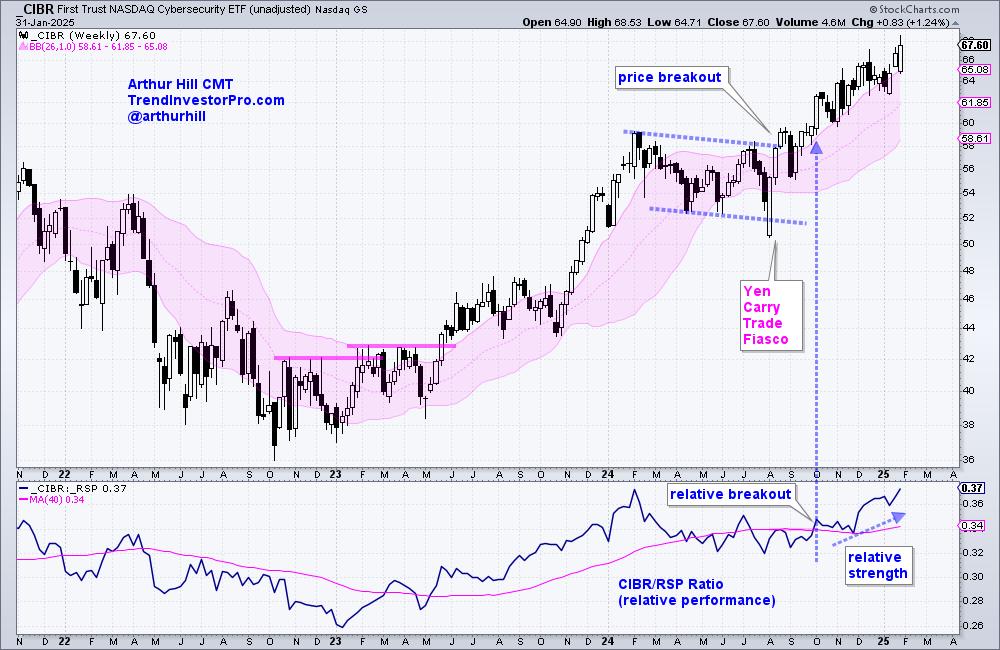
Cybersecurity Makes Yet Another Statement

by Arthur Hill,
Chief Technical Strategist, TrendInvestorPro.com
KEY TAKEAWAYS
* Chartists can use weekly charts to find strong uptrends and leaders.
* We can then turn to the daily chart to find tradeable pullbacks along the way.
* Oversold conditions in Percent-B also present opportunities.
The Cybersecurity ETF (CIBR) has been leading the market for a solid four months and...
READ MORE
MEMBERS ONLY
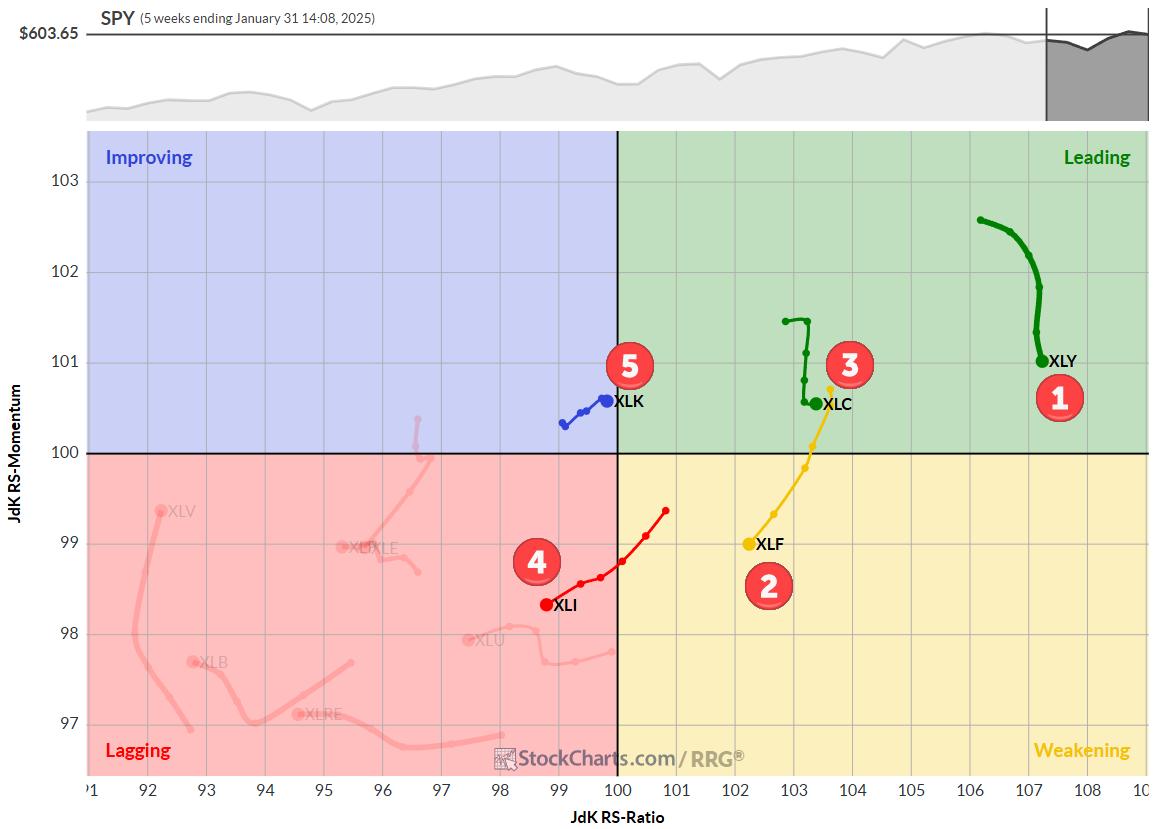
The Best Five Sectors, #5
by Julius de Kempenaer,
Senior Technical Analyst, StockCharts.com
KEY TAKEAWAYS
* Technology (XLK) re-enters top 5 sectors, displacing Energy (XLE)
* Consumer Discretionary (XLY) maintains #1 position
* Weekly and daily RRGs show supportive trends for leading sectors XLY and XLC
* Top-5 portfolio outperforms S&P 500 by nearly 50 basis points
Technology Moves Back into Top-5
As we wrap...
READ MORE
MEMBERS ONLY

XLF's Record Highs: Buy the Dip or Bail Out Now?
by Karl Montevirgen,
The StockCharts Insider
KEY TAKEAWAYS
* XLF, heavily weighted in bank stocks, broke into all-time high territory, though conviction appears low.
* Breadth, momentum, and technical strength are leaning bullish.
* A likely pullback signals an opportunity for entry.
As the FOMC prepared to announce its rate decision on Wednesday, the Financial Select Sector SPDR Fund...
READ MORE
MEMBERS ONLY
An Enticing Gold Mining Stock with a Strong SCTR Score

by Jayanthi Gopalakrishnan,
Director of Site Content, StockCharts.com
KEY TAKEAWAYS
* Gold stocks have been rising, which has helped gold mining stocks.
* This gold mining stock is close to its all-time high.
* In this article, we will present an analysis of the monthly and daily charts.
Gold stocks have risen, even after the Federal Reserve decided to keep interest...
READ MORE
MEMBERS ONLY

Quantum Computing Stocks You NEED to See

by Joe Rabil,
President, Rabil Stock Research
In this exclusive StockCharts video, Joe shares the details of his favorite MACD setup. Joe then covers NVDA, and cryptocurrencies, before covering which Quantum Computing stocks look the best right now, including IONQ and RGTI. Finally, he goes through the symbol requests that came through this week, including AAPL, COIN,...
READ MORE
MEMBERS ONLY

AI Stocks and Their Impact on the Stock Market: Hype or Reality?
by Jayanthi Gopalakrishnan,
Director of Site Content, StockCharts.com
KEY TAKEAWAYS
* The release of an efficient and cost-effective AI sent waves through the stock market.
* After the initial reaction, Wall Street reassessed the situation and stocks like NVDA recovered.
* The price action of the broader indexes suggests the bullish sentiment hasn't gone away.
The week started with...
READ MORE
MEMBERS ONLY
Snowflake and Twilio Stocks are Surging: Here's What to Do Now!
by Karl Montevirgen,
The StockCharts Insider
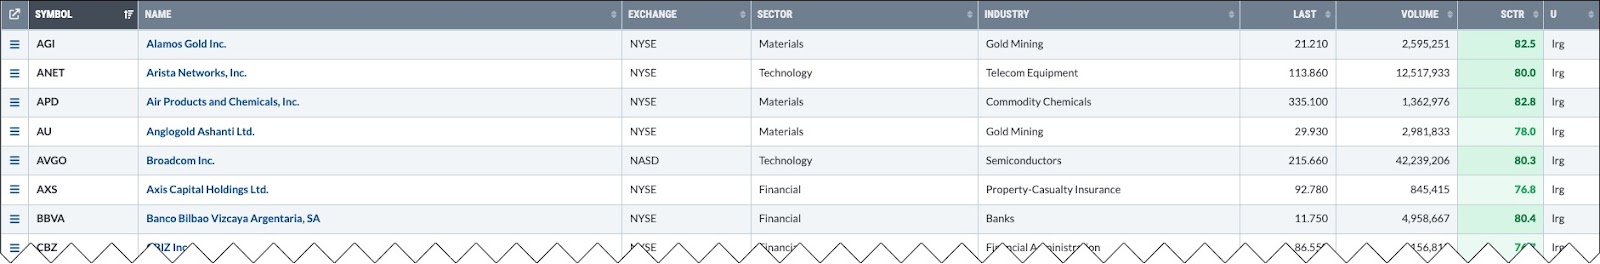
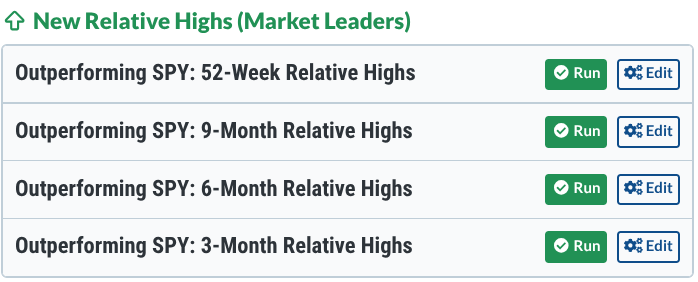
KEY TAKEAWAYS
* SNOW and TWLO stocks are outperforming the market based on a three-month relative highs scan.
* Both stocks show bullish momentum, but conflicting volume signals suggest caution.
* Monitor the key support and resistance levels for potential trade opportunities.
While StockCharts offers numerous tools you can use to find top...
READ MORE
MEMBERS ONLY

Investing in the Age of Tariffs: Safeguard Your Portfolio Now
by Jayanthi Gopalakrishnan,
Director of Site Content, StockCharts.com
KEY TAKEAWAYS
* Investors should monitor the broader US stock market indexes and their performance relative to international markets.
* The strength of the US dollar can help gauge the strength of the US economy.
* If tariffs are imposed, specific sectors, such as Materials and Industrials, will feel more pain than others....
READ MORE
MEMBERS ONLY

DP Trading Room: Black Swan Monday
by Erin Swenlin,
Vice President, DecisionPoint.com
The market opened with a bang as news of a cheaper Artificial Intelligence program, DeepSeek out of China. It has spurred investors to rethink the overbought Technology space, AI in particular. NVDA was down over 17% and other high profile AI companies also suffered.
Carl reviewed the DP Signal Tables...
READ MORE
MEMBERS ONLY
Some Silver Linings Following a Day of AI Panic
by Martin Pring,
President, Pring Research
I woke up this morning noting that NASDAQ futures had been down nearly 1,000 points at their overnight intraday low. Later, I tuned into a couple of general purpose, as opposed to financial, cable news channels. They, too, were talking about the sell-off and its rationale. I began to...
READ MORE
MEMBERS ONLY

What's NEXT for Semiconductors After Monday's SHOCKING Drop?

by David Keller,
President and Chief Strategist, Sierra Alpha Research
In this video, Dave reviews the VanEck Semiconductor ETF (SMH) from a technical analysis perspective. He focuses on the recent failure at price gap resistance, the breakdown below price and moving average support, and the frequent appearance of bearish engulfing patterns which have often indicated major highs over the last...
READ MORE
MEMBERS ONLY

Still BULLISH NVDA Despite DeepSeek?
by Tony Zhang,
Chief Strategist, OptionsPlay
In this video, Tony gives a macro review of where we currently stand with the broader markets given the impact of DeepSeek on the AI space. He then shares some trade ideas for the week, including NVDA, META, LULU, DIS, & AAPL.
This video premiered on January 27, 2025....
READ MORE
MEMBERS ONLY
Six Dance Steps to Remember for an Extended Market

by Gatis Roze,
Author, "Tensile Trading"
"An investment in Knowledge pays the best interest." — Benjamin Franklin
It's time to revisit a few timeless lessons regarding extended markets.
As I write this, the last correction of any significance was in 2022. The past two years have been one heck of a dance if...
READ MORE
MEMBERS ONLY
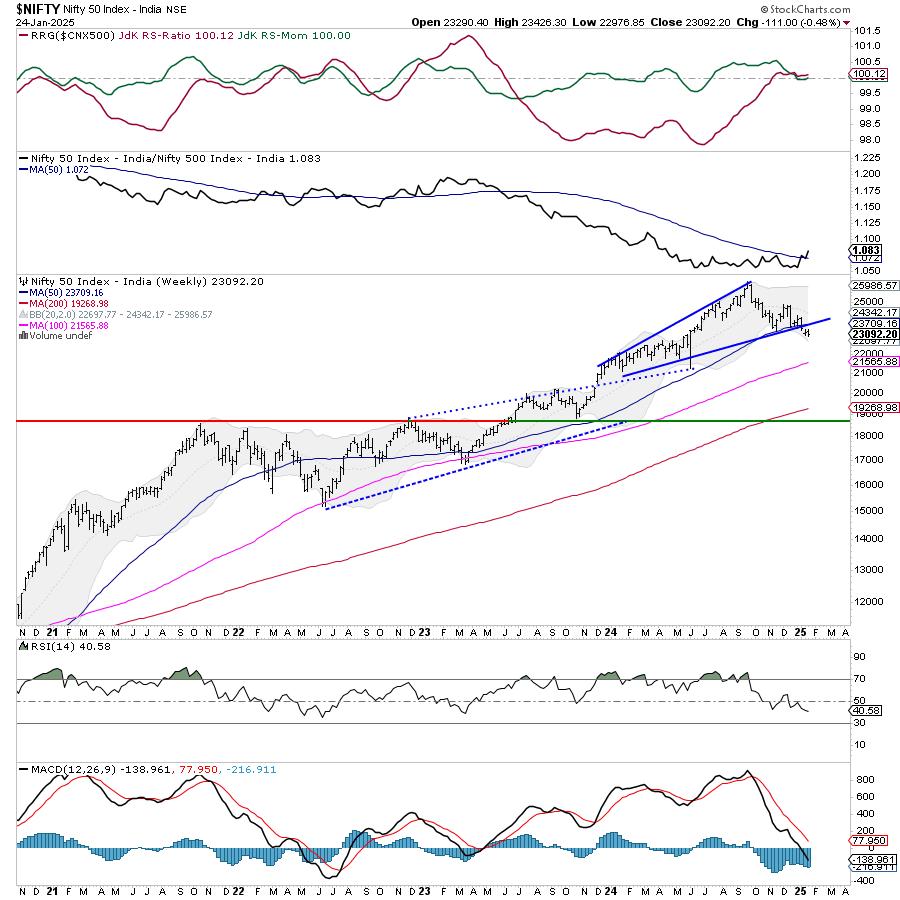
Week Ahead: NIFTY to Stay Tentative Over 6-Day Trading Week; RRG Shows Defensive Sectoral Setup

by Milan Vaishnav,
Founder and Technical Analyst, EquityResearch.asia and ChartWizard.ae
The Indian equities continued to trade with a corrective undertone as they ended the week on a mildly negative note.
Over the past five sessions, the Nifty continued facing selling pressure at higher levels while staying mainly in a range. The markets remained in a very defined trading range and...
READ MORE
MEMBERS ONLY
BEWARE! META, TSLA, AMZN, MSFT & AAPL Report Earnings Next Week!
by Mary Ellen McGonagle,
President, MEM Investment Research
In this video, Mary Ellen reviews the new uptrend in the S&P 500, and highlights what's driving it higher. She then shares new pockets of strength that are poised to take off, and what to be on the lookout for ahead of next week's...
READ MORE
MEMBERS ONLY
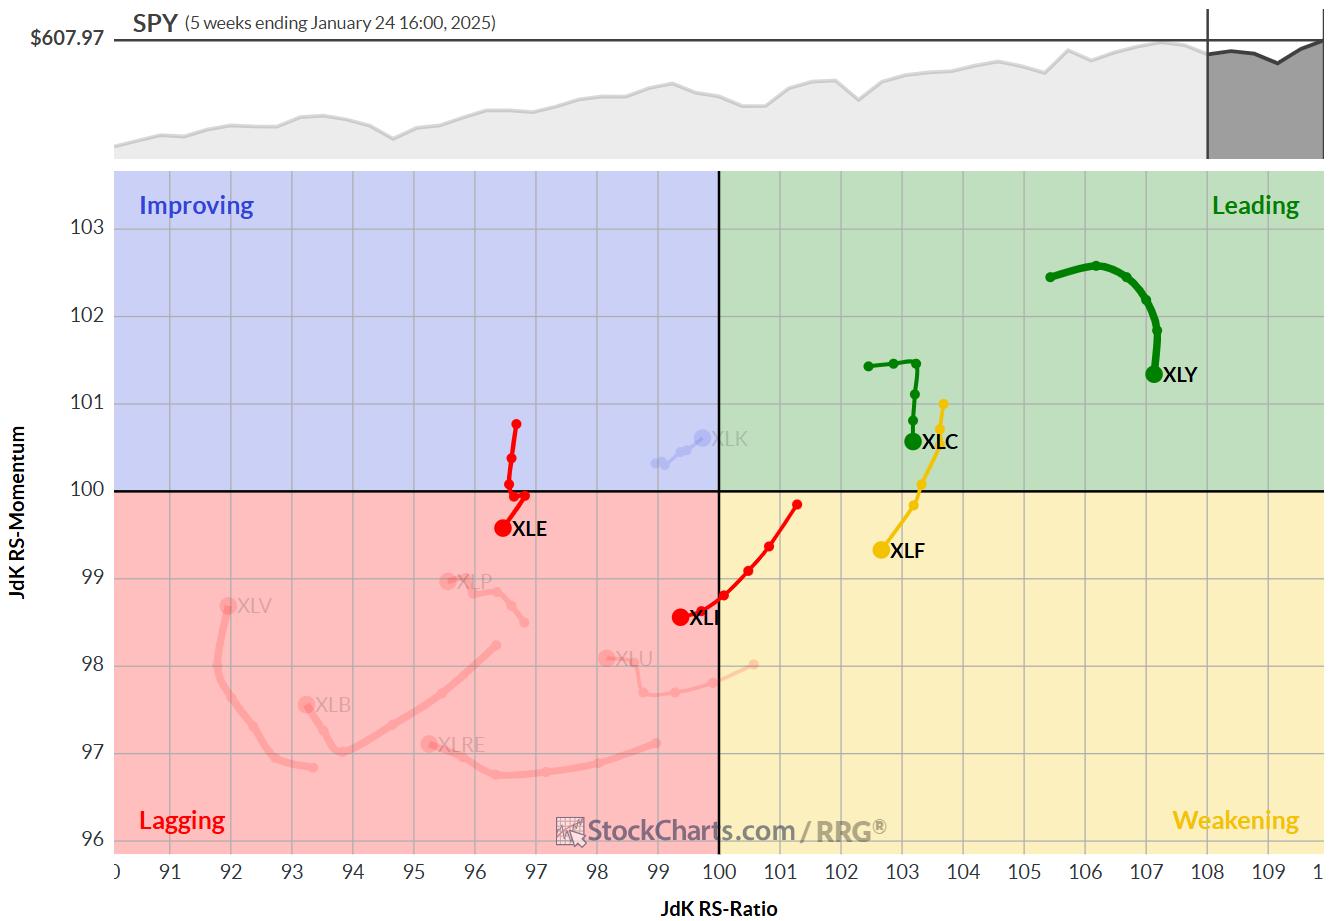
The Best Five Sectors, #4
by Julius de Kempenaer,
Senior Technical Analyst, StockCharts.com
KEY TAKEAWAYS
* No changes in top-5 sectors
* XLC showing strong break from consolidation flag
* XLE remains just barely above XLK as a result of strong daily RRG
No changes in the top-5
At the end of this week, there were no changes in the ranking of the top-5 sectors.
1....
READ MORE
MEMBERS ONLY
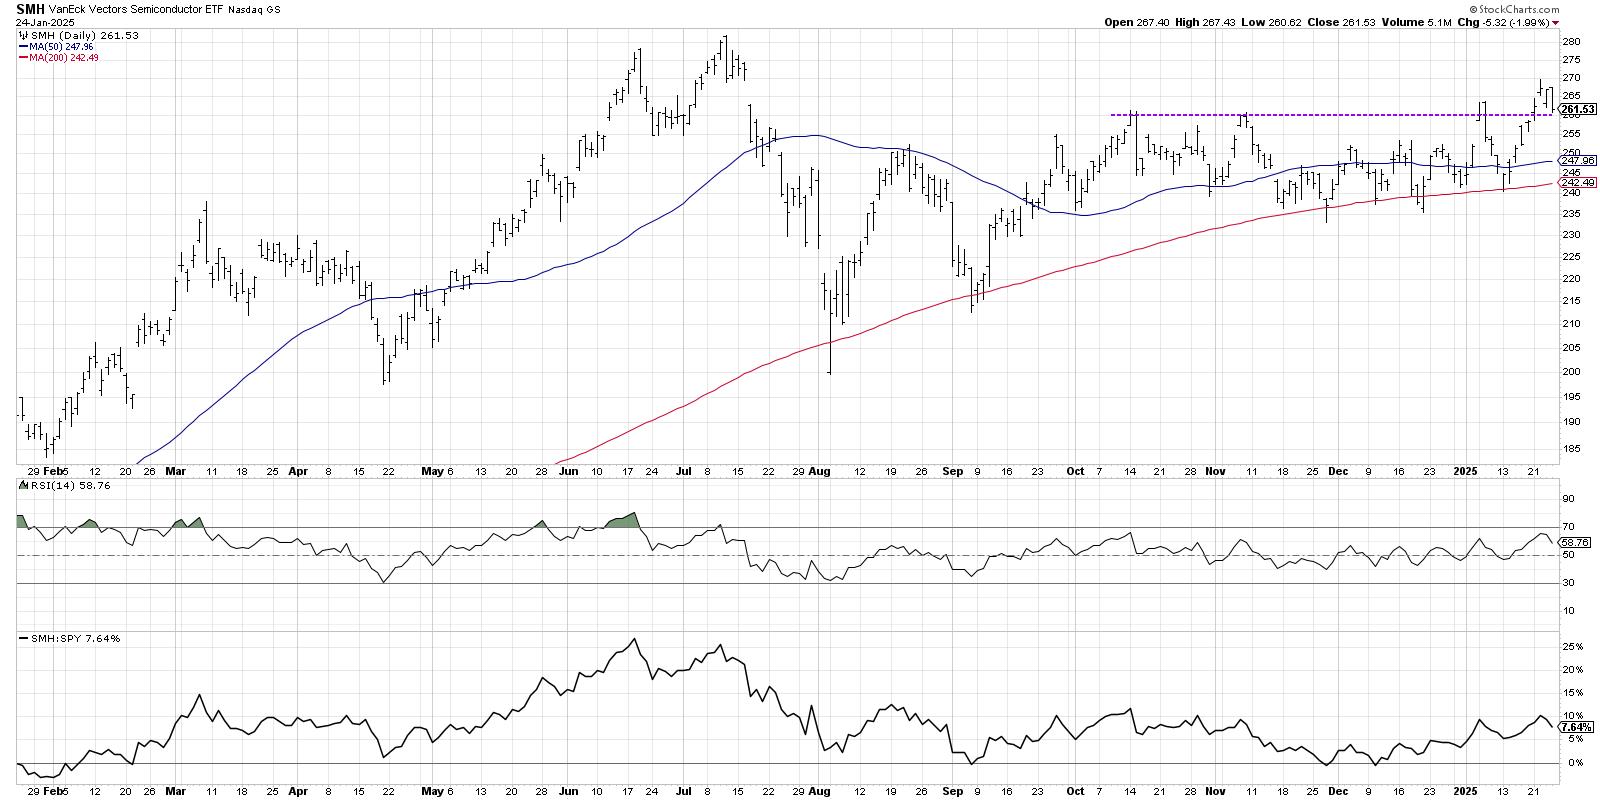
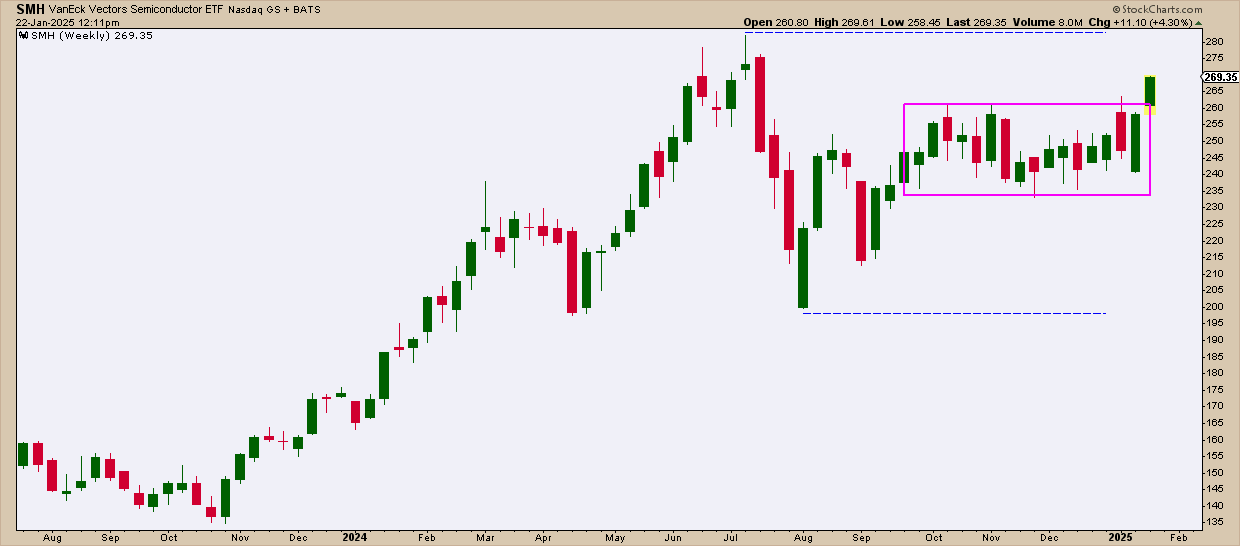
Semiconductors Have More to Prove Before Breakout is Believed
by David Keller,
President and Chief Strategist, Sierra Alpha Research
KEY TAKEAWAYS
* The VanEck Vectors Semiconductor ETF (SMH) broke out of a six-month base this week, suggesting further upside potential.
* While the breakout in SMH appears bullish, the ETF still has yet to eclipse a key price gap from July 2025.
* A bearish engulfing pattern to end the week indicates...
READ MORE
MEMBERS ONLY

Investors are Pouring Into Gold Miners—Here's What You Need to Know!
by Karl Montevirgen,
The StockCharts Insider
KEY TAKEAWAYS
* There's a renewed interest in gold mining stocks.
* Does gold outperforming miners signal an increase in mining activity and profitability?
* Miners are at a critical turning point, and the key levels discussed can help you assess whether the trend will turn bullish or bearish.
Gold mining...
READ MORE
MEMBERS ONLY
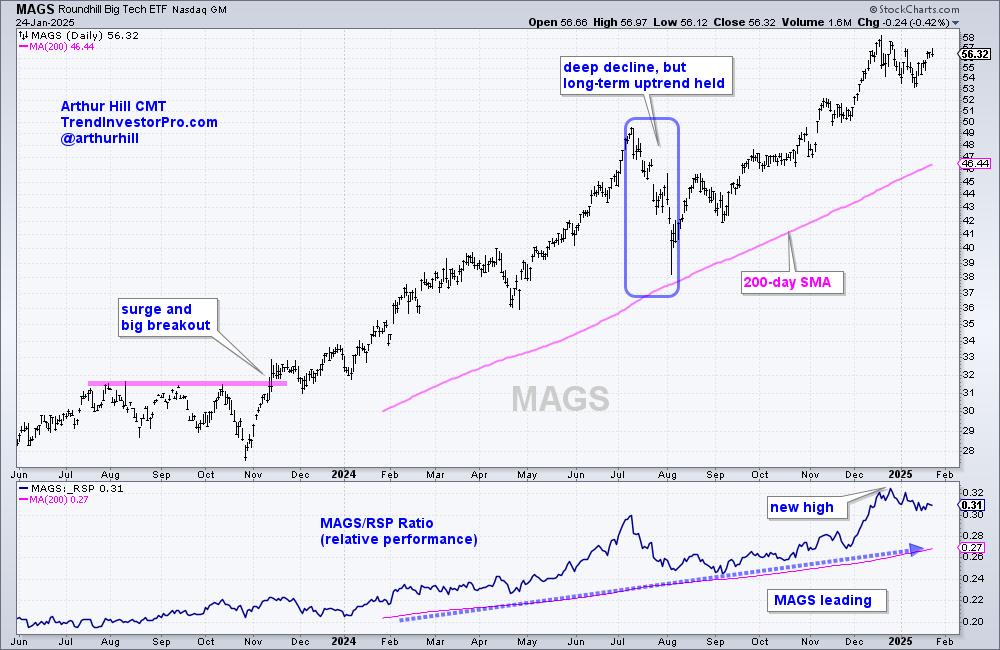
Mag7 ETF Leads as Bullish Pattern Forms - Charting the Trends and Trading Setups for the Mag7 Stocks
by Arthur Hill,
Chief Technical Strategist, TrendInvestorPro.com
KEY TAKEAWAYS
* The Mag7 ETF (MAGS) is outperforming the market and in a strong uptrend.
* MAGS broke out of a short-term bullish continuation pattern this week.
* Nvidia, Tesla, Amazon and Meta are powering MAGS higher.
The Mag7 ETF (MAGS) formed another short-term bullish continuation pattern as it worked its way...
READ MORE
MEMBERS ONLY

Biotechs Looking Up - Two Stocks To Take Advantage
by Erin Swenlin,
Vice President, DecisionPoint.com
The Biotech industry group is making a comeback, with the 'under the hood' chart displaying new strength coming into the group. We have a constructive bottom that price is breaking from and, while it does need to overcome resistance at the 200-day EMA, it looks encouraging. What was...
READ MORE
MEMBERS ONLY

Lowering the Bar: Why Lowe's Could Head South
by Tony Zhang,
Chief Strategist, OptionsPlay
KEY TAKEAWAYS
* Lowe's stock is showing signs of weakness.
* A bear call spread can capitalize on the neutral to bearish bias on Lowe's stock price.
* The bear call spread has a high probability of profit.
Despite periodic rallies that have buoyed the home improvement retail sector,...
READ MORE
MEMBERS ONLY

What's the Secret to Crushing the S&P 500?
by Tom Bowley,
Chief Market Strategist, EarningsBeats.com
Remember that old commercial, "It's not nice to fool Mother Nature?" Well, there should be another one pertaining to the stock market, "Don't bet against a secular bull market advance!" We're all trained, or brainwashed, if you will, to believe...
READ MORE
MEMBERS ONLY
NVDA, TSMC, and Broadcom: Top Semiconductor Plays as SMH Hits New Highs
by Karl Montevirgen,
The StockCharts Insider
KEY TAKEAWAYS
* SMH has broken out of its three-month trading range.
* Trump's $500 billion Stargate AI initiative has injected optimism into the sector, accelerating gains in AI-related semiconductor stocks.
* Monitor the key levels for Nvidia, Broadcom, and TSMC for buying opportunities.
In the last quarter of 2024, semiconductors...
READ MORE
MEMBERS ONLY
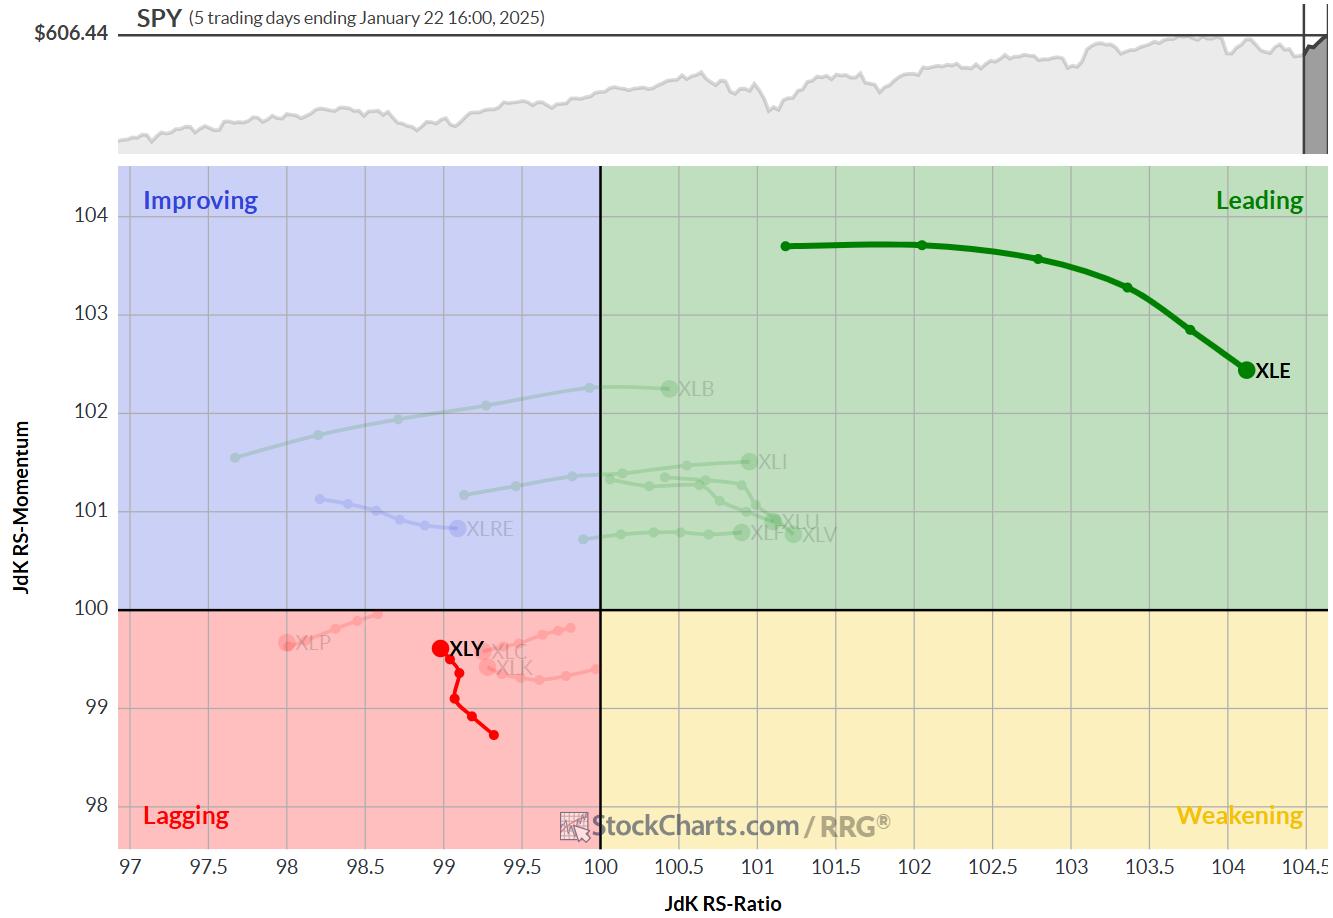
Energy Picks Up and Consumer Discretionary Continues to Lead
by Julius de Kempenaer,
Senior Technical Analyst, StockCharts.com
KEY TAKEAWAYS
* Short term strength drags enery sector up
* Long term strength keeps consumer discretionary on top
* Massive upside potential ready to get unlocked in EOG
I have been traveling in the US since 1/15 and attended the CMTA Mid-Winter retreat in Tampa, FL 1/16-1/17 and then...
READ MORE
MEMBERS ONLY

Market Internals Point to Large Growth Leadership
by David Keller,
President and Chief Strategist, Sierra Alpha Research
KEY TAKEAWAYS
* While the stronger US Dollar suggests caution for growth stocks, the ratios shows that growth continues to dominate value.
* While macro conditions appear beneficial for small cap stocks, large caps are back to a confirmed leadership role.
* Measures of offense vs. defensive suggest that investors are favoring offense...
READ MORE
MEMBERS ONLY
Discover the BEST Way to Spot TREND CHANGES
by Joe Rabil,
President, Rabil Stock Research
In this exclusive StockCharts video, Joe demonstrates how to use the 1-2-3 reversal pattern as a buy signal on the weekly chart. This approach can be used when the monthly chart is in a strong position. Joe shares how to use MACD and ADX to help when the trendline pattern...
READ MORE
MEMBERS ONLY

Cisco Systems' Stock Keeps Hitting All-Time Highs: Investment Tips to Maximize Your Success
by Jayanthi Gopalakrishnan,
Director of Site Content, StockCharts.com
KEY TAKEAWAYS
* Cisco Systems' stock has made substantial investments in AI, which has helped the stock rally higher.
* CSCO's stock price has been making all-time highs recently and is worth monitoring.
* Look for a pullback and reversal with strong momentum before entering a long position.
When you...
READ MORE
MEMBERS ONLY
Five Key Market Ratios Every Investor Should Follow
by David Keller,
President and Chief Strategist, Sierra Alpha Research
In this video, Dave shares five charts from his ChartList of market ratios that investors can use to track changing market conditions through 2025. If you want to better track shifts in market leadership, identify where funds are flowing, and stay on top of evolving market trends, make sure to...
READ MORE
MEMBERS ONLY

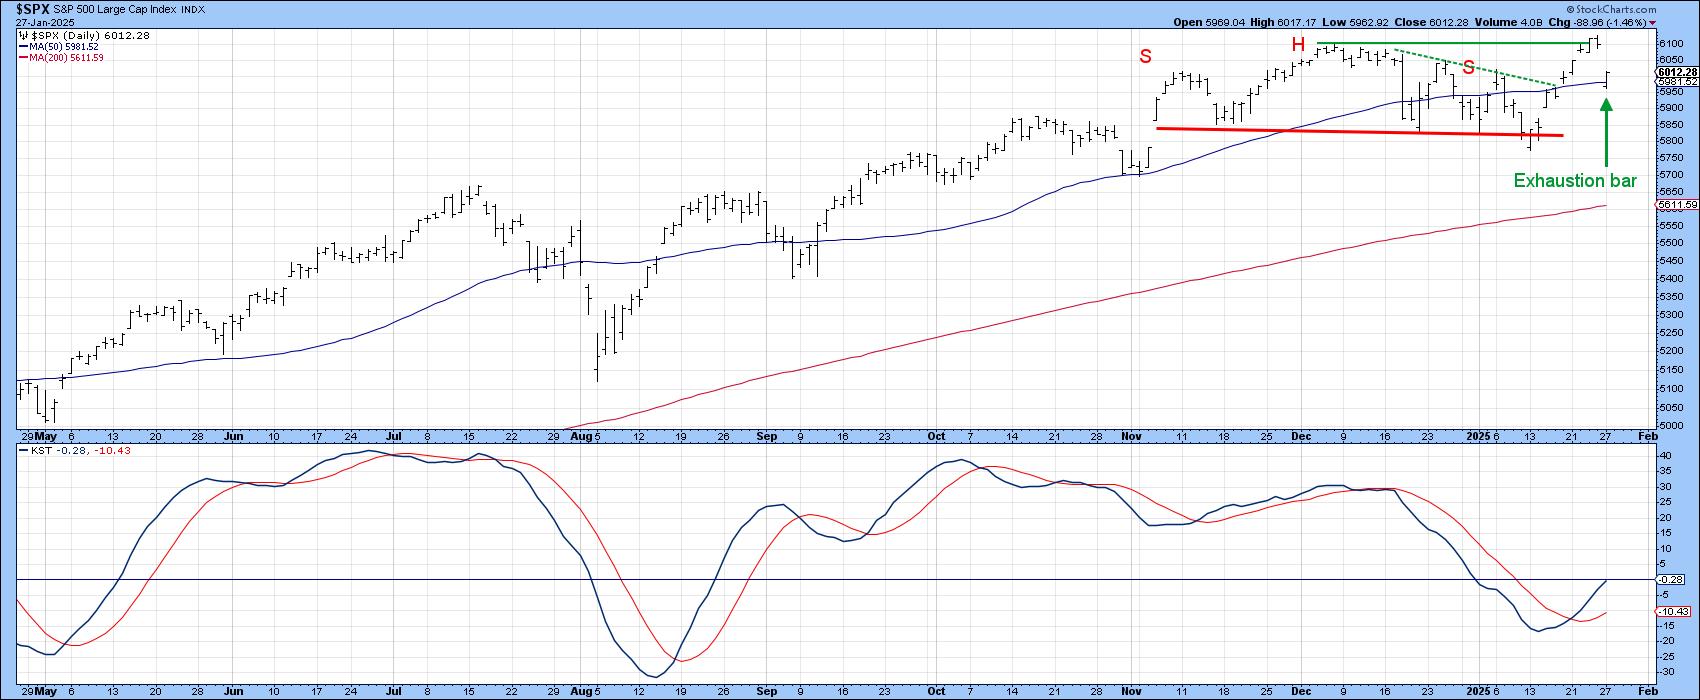
Stocks are Facing an Important Test
by Martin Pring,
President, Pring Research
I have been expecting a bull market correction for about a month, but it's not been as deep as I expected. Now, however, several indexes have completed small bullish two-bar reversal patterns on the weekly charts. If they work, that would be a characteristic of a bull market,...
READ MORE
MEMBERS ONLY
Here's How To Find The Best Upcoming Earnings Reports
by Tom Bowley,
Chief Market Strategist, EarningsBeats.com
Our strategy at EarningsBeats.com just simply makes good common sense. If you want to find the best earnings reports BEFORE they're reported, follow relative strength. I've explained this many times, but let me do it again. Wall Street firms talk to management of companies throughout...
READ MORE