MEMBERS ONLY

SMALL AND MIDCAP STOCKS LEAD LARGE CAPS LOWER -- THE S&P 500 IS IN DANGER OF CLOSING BELOW ITS 50-DAY AVERAGE -- RISING DOLLAR PUSHES ENERGY SECTOR INTO ANOTHER TEST OF 200-DAY AVERAGE

by John Murphy,
Chief Technical Analyst, StockCharts.com
S&P SMALL AND MIDCAP INDEXES FAIL TEST OF 50-DAY AVERAGE... The pullback in stocks that started yesterday is continuing today. And it's being led down by smaller stocks. Chart 1 shows the S&P 600 Small Cap Index ($SML) falling decisively back its blue 50-day...
READ MORE
MEMBERS ONLY
Nine tech stocks to watch from an RRG perspective

by Julius de Kempenaer,
Senior Technical Analyst, StockCharts.com
An inspection of the weekly Relative Rotation Graph for US sectors at the beginning of this week (ending 2 March) reveals that we have:
* 3 sectors in leading
* 2 sectors in weakening
* 4 sectors in lagging
* 1 sector in improving
Out of these 10 sectors, we have only 2 at...
READ MORE
MEMBERS ONLY

P&G Weighs on Consumer Staples Sector

by Arthur Hill,
Chief Technical Strategist, TrendInvestorPro.com
The Consumer Staples SPDR (XLP) is one of the worst performing sectors year-to-date with a loss greater than 8 percent. The sector is also the second weakest in February because it failed to hold its bounce over the last two weeks.
The chart shows XLP with its biggest component (P&...
READ MORE
MEMBERS ONLY
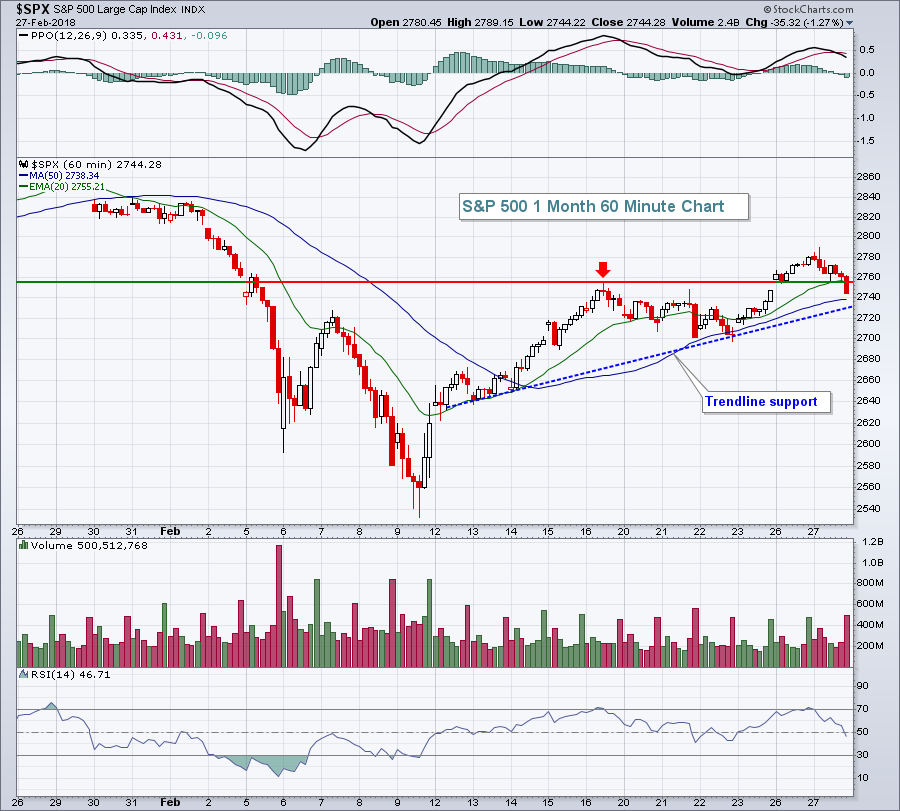
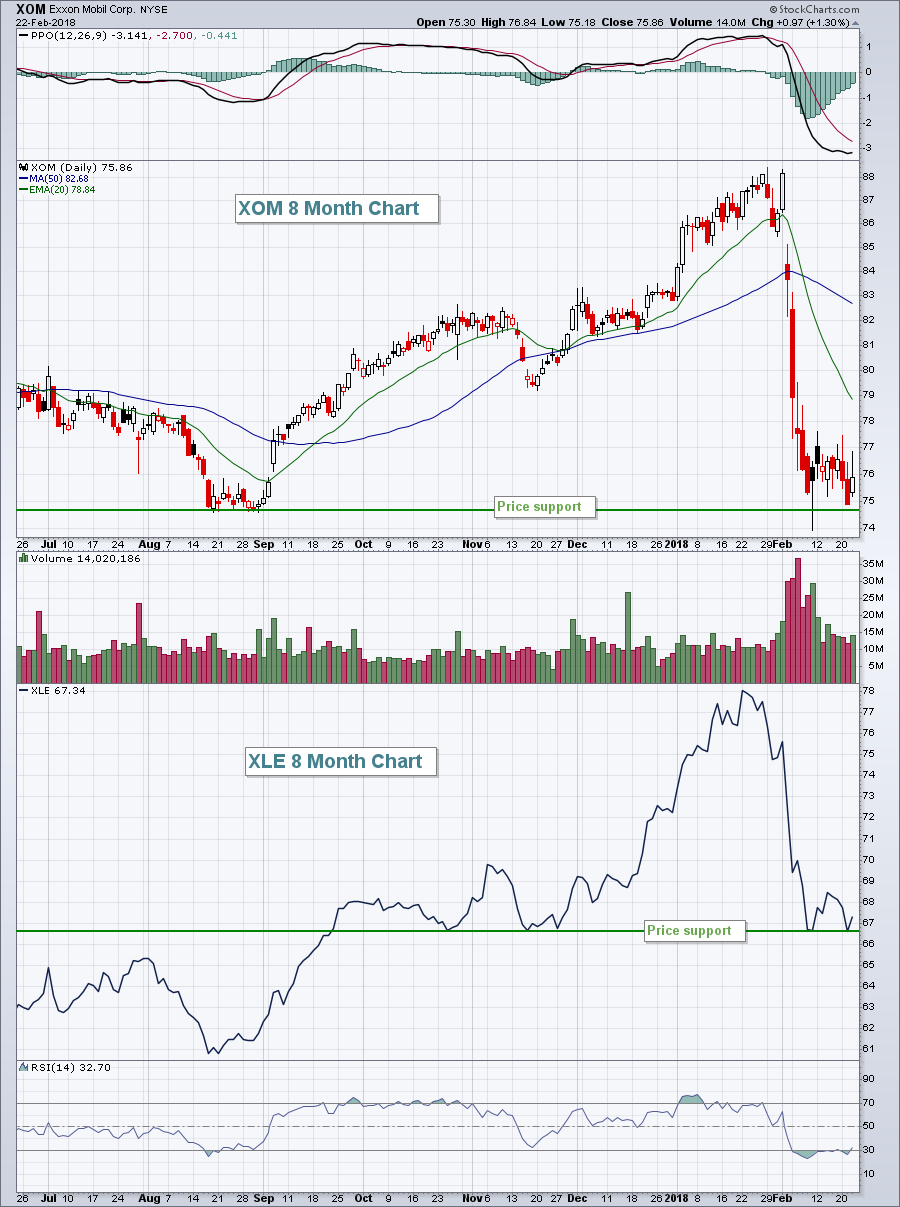
3 Takeaways From Tuesday's Renewed Selling...And Why I'd Avoid Gold

by Tom Bowley,
Chief Market Strategist, EarningsBeats.com
Market Recap for Tuesday, February 27, 2018
During a day filled with renewed selling, especially in the final 10 minutes, there were 3 key takeways as far as I'm concerned. First, the short-term uptrend appeared to have been broken at the end of the day as gap, price...
READ MORE
MEMBERS ONLY

US Equities Emerging from The February Shakeout As A Global Leader Again

by Martin Pring,
President, Pring Research
* US is breaking out relative to the world
* Growth breaks decisively against value
* Blue Tuesday
US is breaking out relative to the world
Chart 1 shows that the ratio between the US stock market, in the form of the S&P Composite ($SPX), and the World Index (ACWI) often...
READ MORE
MEMBERS ONLY
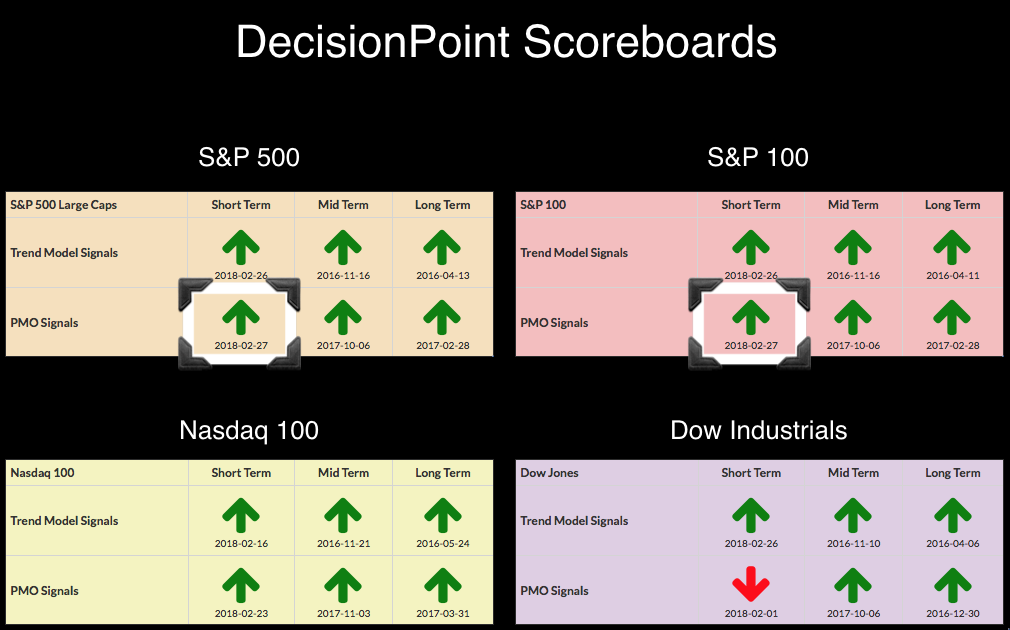
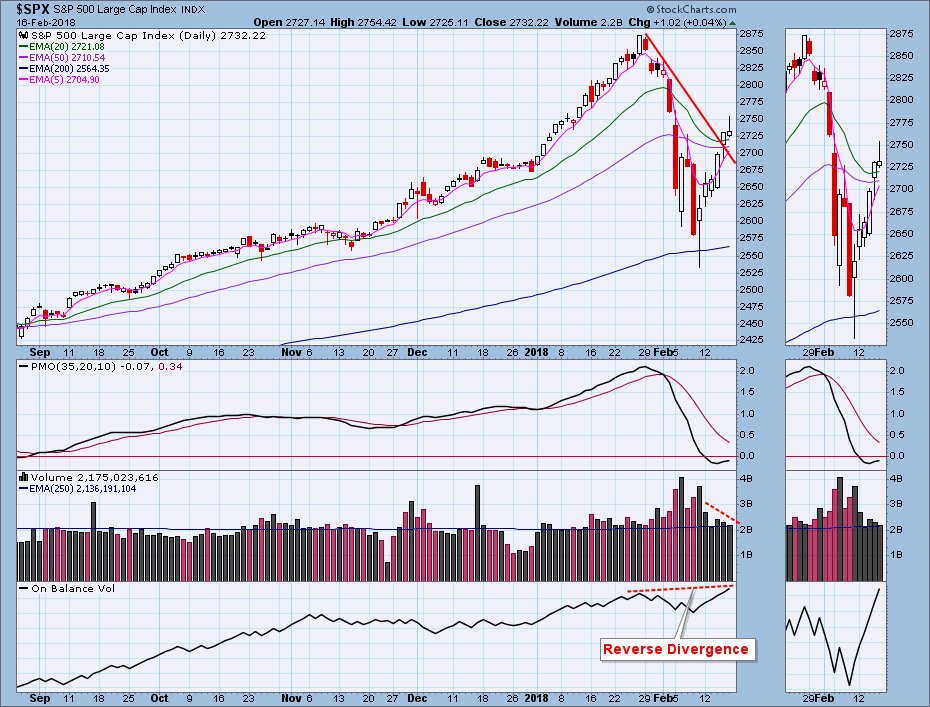
DP Bulletin: SPX and OEX New BUY Signals - Beware Outside Reversal Days

by Erin Swenlin,
Vice President, DecisionPoint.com
Two items I need to call your attention to. First, the PMOs crossed their signal lines on the SPX and OEX to trigger ST PMO (Price Momentum Oscillator) BUY signals. The Dow's PMO is stubbornly staying below its signal line, but that should disappear tomorrow given it'...
READ MORE
MEMBERS ONLY

JUMP IN BOND YIELDS PUTS STOCK REBOUND IN JEOPARDY -- QQQ IS PULLING BACK FROM TEST OF OLD HIGH -- S&P 500 LOOKS OVEREXTENDED -- BOUNCING DOLLAR WEAKENS GOLD -- EMERGING MARKETS ARE ALSO EXPERIENCING PROFIT-TAKING
by John Murphy,
Chief Technical Analyst, StockCharts.com
TEN-YEAR BOND YIELD IS BACK OVER 2.90% ... After a modest pullback that started last Thursday, bond yields are climbing again today. The daily bars in Chart 1 show the 10-Year Treasury Yield ($TNX) jumping 6 basis points to 2.92% and within striking distance of its four-year high reached...
READ MORE
MEMBERS ONLY
Software Breaks Out; Semis, Computer Hardware Next In Line
by Tom Bowley,
Chief Market Strategist, EarningsBeats.com
Market Recap for Monday, March 26, 2018
Monday was a very solid day for U.S. equities. All of our major indices roared to higher levels, led by the 400 point gain on the Dow Jones Industrial Average ($INDU). Eight of nine sectors advanced, with only the defensive utilities group...
READ MORE
MEMBERS ONLY

The 800-Pound Gorilla in the Market - Charting the Fab Five
by Arthur Hill,
Chief Technical Strategist, TrendInvestorPro.com
* SPY Leads with First Breakout.
* Small Caps and Mid Caps Still Lagging.
* Six Sectors and Six Upswings.
* Techs and Materials Lead New High List.
* The 800-pound Sector in the Market.
* Charting the Fab Five (AAPL, GOOGL, FB, AMZN, MSFT).
* Retail and Housing Lag.
SPY Leads with First Breakout...
For the...
READ MORE
MEMBERS ONLY
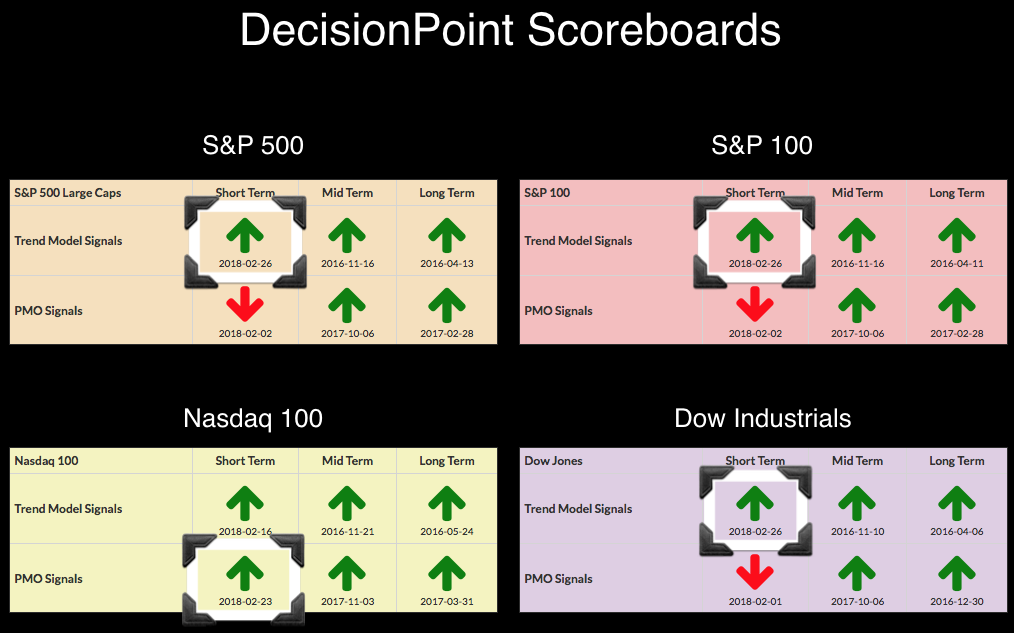
Flags Execute on Major Indexes - New BUY Signals on DP Scoreboards
by Erin Swenlin,
Vice President, DecisionPoint.com
The DP Scoreboard transformation actually began on Friday when the NDX grabbed a new PMO BUY signal after already logging a ST Trend Model BUY signal. It appears the other indexes are falling in line as their 5-EMAs crossed above 20-EMAs to generate ST Trend Model BUY signals too. When...
READ MORE
MEMBERS ONLY

STOCKS REGAIN THREE-QUARTERS OF FEBRUARY SELLOFF -- QQQ NEARS TEST OF OLD HIGH -- AMERICAN AIRLINES AND UNION PACIFIC LEAD TRANSPORTS HIGHER -- COMMODITIES ARE ALSO RECOVERING
by John Murphy,
Chief Technical Analyst, StockCharts.com
STOCK INDEXES GAIN MORE GROUND -- QQQ NEARS TEST OF OLD HIGH... U.S. stock indexes continue to gain more ground today and have now regained about three-quarters of their recent correction. Charts 1 and 2 show the Dow Industrials and S&P 500 trading at three-week highs after...
READ MORE
MEMBERS ONLY

Humana Tests Breakout Zone as PPO Turns
by Arthur Hill,
Chief Technical Strategist, TrendInvestorPro.com
Humana (HUM) is part of the HealthCare Providers ETF (IHF) and this group led the market from mid-October to late January with a 20+ percent surge to new highs. The group pulled back in February, but the long-term trend is up and this bodes well for stocks in the group....
READ MORE
MEMBERS ONLY
Looking For March Seasonal Strength? Check These Two Out
by Tom Bowley,
Chief Market Strategist, EarningsBeats.com
Market Recap for Friday, February 23, 2018
After a steady diet of afternoon flops recently, our major indices soared into Friday's close, clearing important overhead resistance in the process. All major indices finished with 1% gains or more, setting the stage for what could be a very solid...
READ MORE
MEMBERS ONLY

Whipsaws!

by Greg Morris,
Veteran Technical Analyst, Investor, and Author
I had another article planned but think writing about something that just occurred in the market is a much better learning/teaching experience. Trend following has one issue that will constantly plague the investor and usually at the least expected time, and that is whipsaws. I must admit, I think...
READ MORE
MEMBERS ONLY
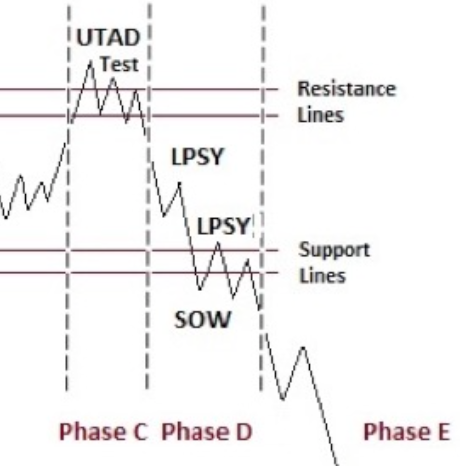
Distribution Review

by Bruce Fraser,
Industry-leading "Wyckoffian"
It has been a long time since we have explored the intricacies of the Wyckoff Distribution structure. But since 2018 has opened with a Bang, by going straight up in January and then early February’s retracement of the prior month’s advance, it is time to review. The year...
READ MORE
MEMBERS ONLY
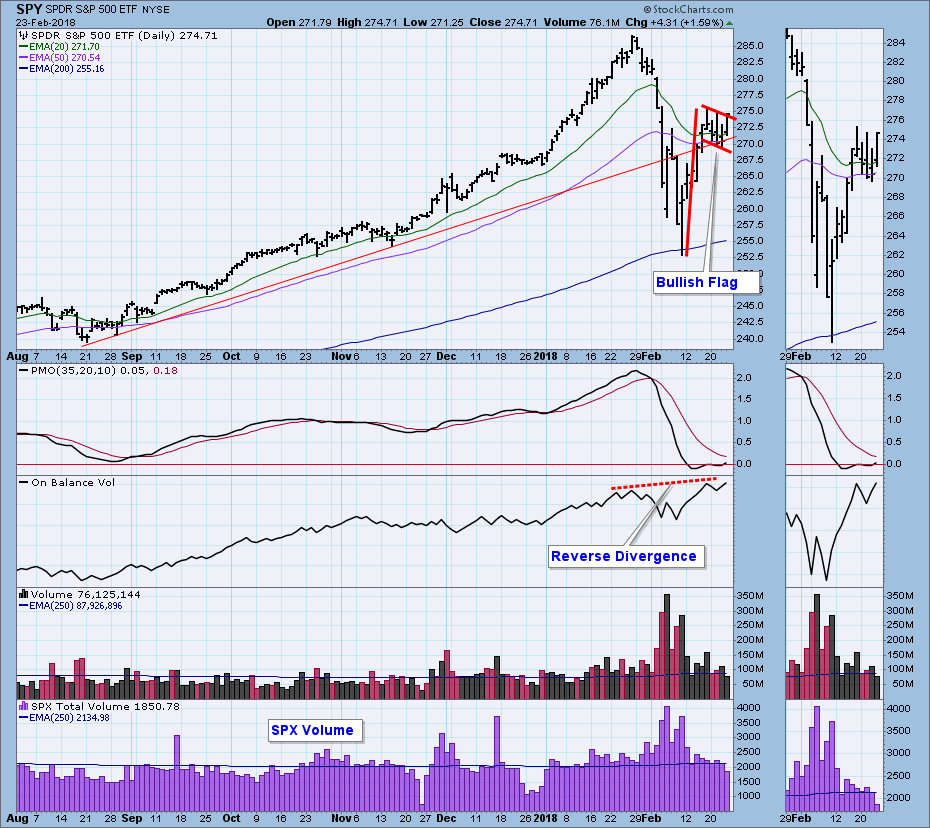
DP Weekly Wrap: Promising Flag Formation

by Carl Swenlin,
President and Founder, DecisionPoint.com
Nothing has happened this week to support my belief that we are in a bear market. If the market were in that much trouble, it seems to me that this week it should have headed lower. Instead, it has consolidated and formed a bullish flag formation. If the flag fulfills...
READ MORE
MEMBERS ONLY

BOND YIELDS ARE STARTING TO WEAKEN FROM OVERBOUGHT CONDITION -- THAT'S GIVING A BOOST TO BOND PROXIES LIKE UTILITIES, REITS, AND TELECOM -- HIGH YIELD BONDS ARE BOUNCING BACK WHICH IS GOOD FOR STOCKS
by John Murphy,
Chief Technical Analyst, StockCharts.com
TEN-YEAR BOND YIELD IS WEAKENING ... The uptrend in bond yields is starting to weaken. The daily bar in Chart 1 show the 10-Year Treasury yield falling 5 basis points to 2.87%. More importantly, its 14-day RSI line overlaid over the price bars is falling to the lowest level since...
READ MORE
MEMBERS ONLY

Free Style Tips: How I Organize My Custom ChartStyles!

by Grayson Roze,
Chief Strategist, StockCharts.com
Well, I did it again. Yesterday morning, I joined Tom Bowley and Erin Swenlin on MarketWatchers LIVE as part of the weekly "Everything StockCharts" segment, which covers important tips, tricks and other information that all StockCharts users can benefit from.
My appearance was a demonstration in style...ChartStyle!...
READ MORE
MEMBERS ONLY
Higher Treasury Yields Crushing Last Year's Darling - Home Construction
by Tom Bowley,
Chief Market Strategist, EarningsBeats.com
Market Recap for Thursday, February 22, 2018
U.S. indices continued to tread water on Thursday, with mixed action among our major indices and sectors. The Dow Jones posted a triple digit gain (165 points), but the more aggressive NASDAQ and Russell 2000 indices both fell fractionally. Volatility ($VIX) subsided...
READ MORE
MEMBERS ONLY

Weekly Market Review & Outlook (with Video) - Something for Everyone
by Arthur Hill,
Chief Technical Strategist, TrendInvestorPro.com
* Bulls, Bears and Fishermen.
* Long-term Picture Still Bullish.
* Rising SMAs for the S&P 500.
* A Short-term Bullish Pattern for SPY.
* Small-caps Show some Short-term RS.
* Lots of Little Consolidations.
* Oil Extends Bounce off Support.
* Energy Stocks are Not Impressed.
* Gold Miners Not Impressed Either.
* Notes from the Art&...
READ MORE
MEMBERS ONLY
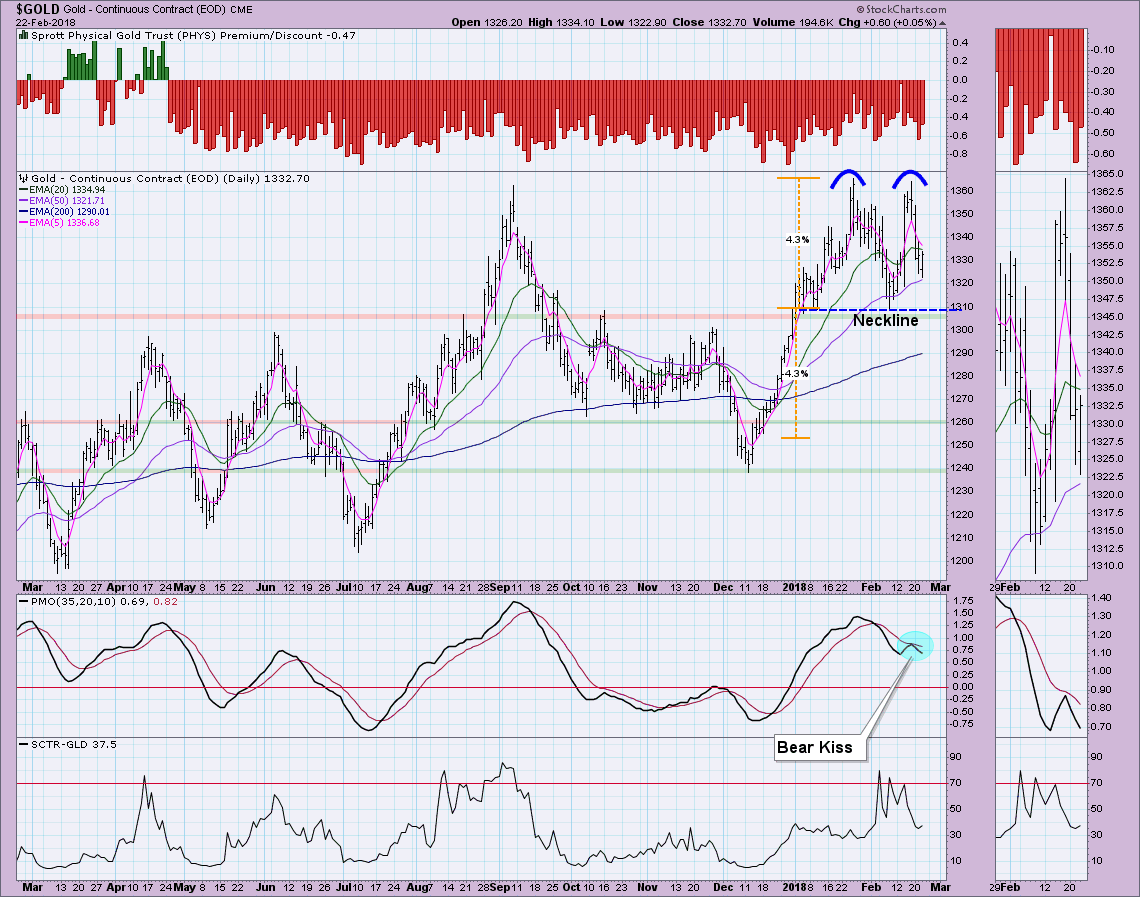
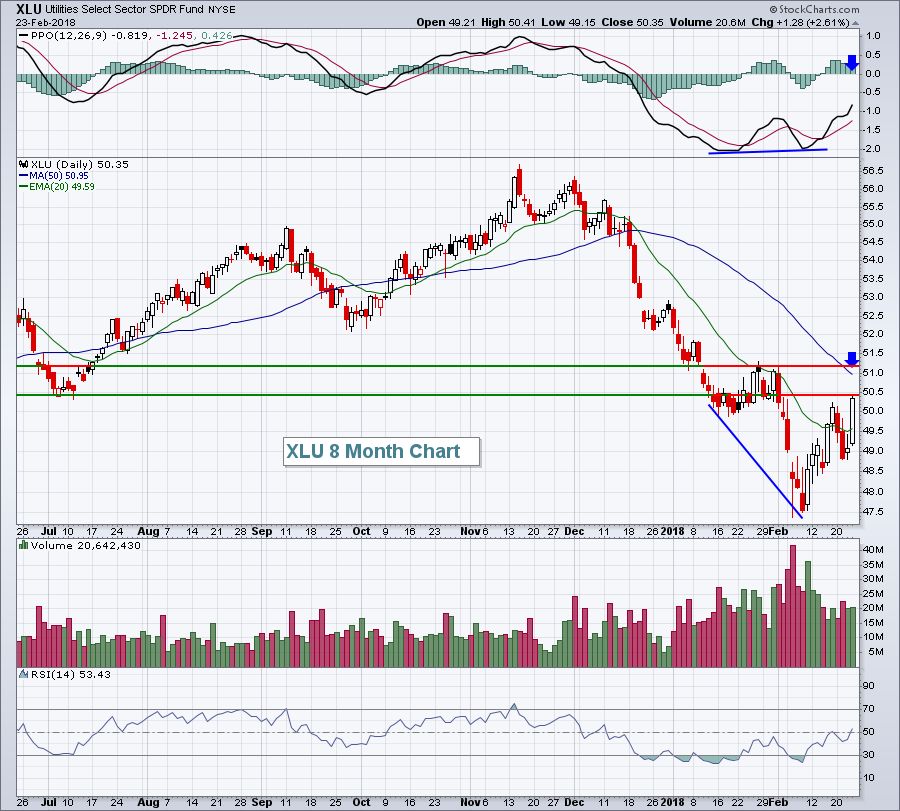
Why So Down on Gold?
by Erin Swenlin,
Vice President, DecisionPoint.com
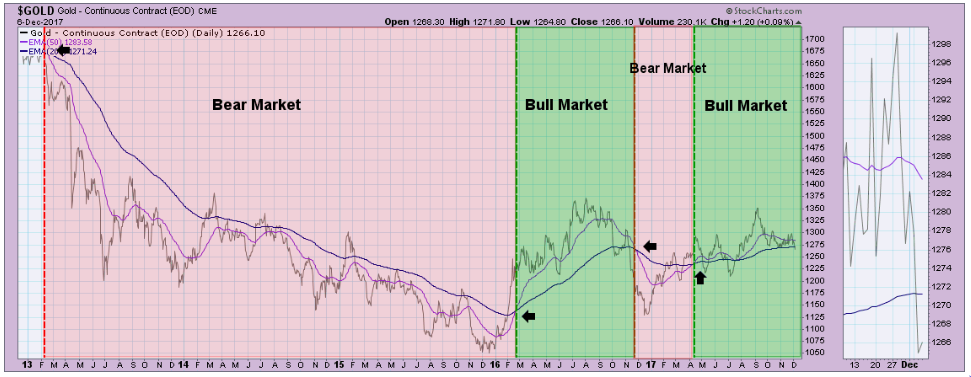
I was asked during the MarketWatchers LIVE program today about my thoughts regarding Gold v. Dollar and particularly, why I'm bearish on Gold right now. I'll explain.
The chart for Gold is bearish on many counts. First there is the PMO with its "bear kiss&...
READ MORE
MEMBERS ONLY

SystemTrader - In-Sample and Out-of-Sample Results for Two Momentum Systems - Measuring Performance and Drawdowns
by Arthur Hill,
Chief Technical Strategist, TrendInvestorPro.com
* Revisiting Two Momentum Systems from 2017.
* A Simple Momentum Rotation System.
* Live by the Sword, Die by the Sword.
* A Trend-Momentum System with a Profit Target.
* Successful and Unsuccessful Trades.
* In-Sample and Out-of-Sample Performance.
* Drawdowns are Unavoidable.
* Conclusions and Takeaways.
* Consulting, Software and Data.
Revisiting Two Momentum Systems
I introduced...
READ MORE
MEMBERS ONLY
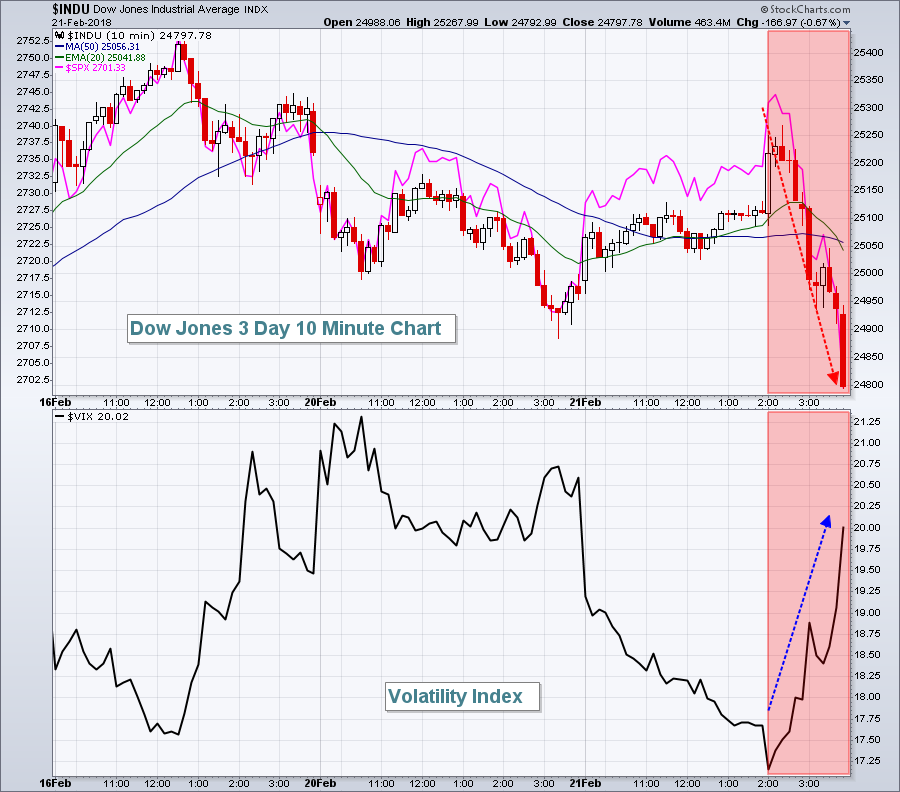
FOMC Minutes Spook Traders, Equities Tumble In Final Two Hours
by Tom Bowley,
Chief Market Strategist, EarningsBeats.com
Market Recap for Wednesday, February 21, 2018
Well, the U.S. stock market was humming right along.....until the FOMC minutes were released at 2pm EST. Take a look at this intraday chart on the Dow Jones and S&P 500 and I think you'll fairly quickly...
READ MORE
MEMBERS ONLY

DP Alert - ST Indicators Suggest Pullback
by Erin Swenlin,
Vice President, DecisionPoint.com
The NDX switched back to a Short-Term Trend Model BUY Signal on the DecisionPoint Scoreboards. The 5-EMA crossed above the 20-EMA which triggered the signal (the chart is below the scoreboards for your review).
The purpose of the DecisionPoint Alert Update is to quickly review the day's action,...
READ MORE
MEMBERS ONLY

Emerging From The Correction The Best And Worst Looking Sectors
by Martin Pring,
President, Pring Research
* General market thoughts
* Sectors under pressure
* Stronger looking sectors
General market thoughts
My thoughts on the recent correction is that we have likely seen the low, that more ranging action is likely, probably involving a test of that low, but that eventually US equities will see new bull market highs....
READ MORE
MEMBERS ONLY

STRONG TECH SECTOR CONTINUES TO SUPPORT MARKET -- FINANCIALS, CYCLICALS, AND INDUSTRIALS ARE ALSO LEADING -- SMALLS CAPS LOOK STRONGER -- AMERICAN AIRLINES AND KANSAS CITY SOUTHERN LEAD TRANPORTS HIGHER
by John Murphy,
Chief Technical Analyst, StockCharts.com
TECHNOLOGY SECTOR CONTINUES TO SUPPORT MARKET ... My last sentence from yesterday's message was that the stock market was unlikely to suffer any serious short-term damage as long as technology stocks kept rising. That's because technology is such a big part of the stock market. And they&...
READ MORE
MEMBERS ONLY

Regional Bank ETF Rises to the Top
by Arthur Hill,
Chief Technical Strategist, TrendInvestorPro.com
Even though I am currently in the "correction" camp for the broader market, there are clearly pockets of strength in some key groups. The Software iShares (IGV), Cyber Security ETF (HACK), Internet ETF (FDN) and Networking iShares (IGN) are leading the technology rebound and all are close to...
READ MORE
MEMBERS ONLY
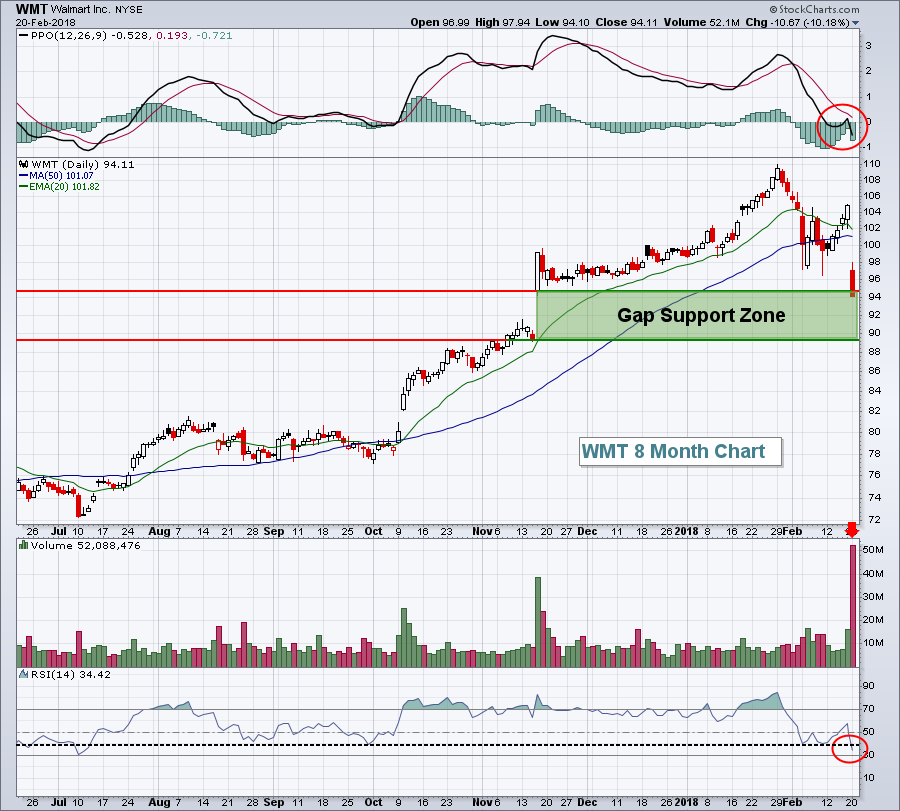
Walmart Results Take A Big Bite Out Of Dow Jones, Ends Winning Streak
by Tom Bowley,
Chief Market Strategist, EarningsBeats.com
Market Recap for Tuesday, February 20, 2018
Selling returned to Wall Street as its six day winning streak came to an end. The Dow Jones was easily the biggest loser as Walmart, Inc (WMT) disappointed traders with its latest quarterly earnings report and had its worst trading day in many...
READ MORE
MEMBERS ONLY

SEMICONDUCTORS LEAD THE NASDAQ AND TECHNOLOGY SECTOR HIGHER TODAY -- CHIP LEADERS INCLUDE APPLIED MATERIALS, KLA-TENCOR, AND LAM RESEARCH -- MOST OTHER SECTORS ARE IN THE RED -- DOW AND S&P 500 ARE STRUGGLING AT MOVING AVERAGE LINES
by John Murphy,
Chief Technical Analyst, StockCharts.com
SEMICONDUCTOR ISHARES HAVE A STRONG DAY... Semiconductor stocks are the strongest part of the market today. Chart 1 shows the PHLX Semiconductor iShares (SOXX) trading more than 2% higher today and moving further above its 50-day moving average. The SOXX has also risen above its 20-day moving average (green line)...
READ MORE
MEMBERS ONLY
Never Short a Dull Market or Go Long a Volatile One
by Arthur Hill,
Chief Technical Strategist, TrendInvestorPro.com
* Go Long a Volatile Market?
* Setting Correction Targets for S&P 500.
* Leaders and Laggards During the Rebound.
* Scanning for Percent from High.
* Semis, Housing and Transports Lag.
"Never short a dull market" is an old Wall Street saying. Even though we cannot build a strategy on...
READ MORE
MEMBERS ONLY
Traders Turn Defensive As Key Fibonacci Retracement Level Reached - Bearish
by Tom Bowley,
Chief Market Strategist, EarningsBeats.com
Market Recap for Friday, February 16, 2018
On the surface, Friday's action didn't seem all that bad. While there was bifurcated action, three of our four major indices did finish in positive territory. The aggressive small cap Russell 2000 ($RUT) led the advance. Only the NASDAQ...
READ MORE
MEMBERS ONLY

The Law of Cause and Effect in Action
by Bruce Fraser,
Industry-leading "Wyckoffian"
The Law of Cause and Effect is a cornerstone principle of the Wyckoff Method. Cause building on the chart precedes the Effect of a Markup or a Markdown. Wyckoffians meticulously study trading ranges on the charts for Accumulation or Distribution characteristics. Analysis of Phases (Phases A thru E) track the...
READ MORE
MEMBERS ONLY
Building a Rules-Based Trend Following Model - 5
by Greg Morris,
Veteran Technical Analyst, Investor, and Author
The significant components of my Weight of the Evidence are Price Measures and Breadth Measures. All of my Price Measures use the Nasdaq Composite Index which I have written about many times. If using the same price, then the difference between most price indicators is to offer varying time periods;...
READ MORE
MEMBERS ONLY
Some Equity Markets Showing Signs Of Long-term Vulnerability
by Martin Pring,
President, Pring Research
* Pinocchio argues for a test of the lows
* European equities are facing a big challenge
* Shanghai starting to look sick
Pinocchio argues for a test of the lows
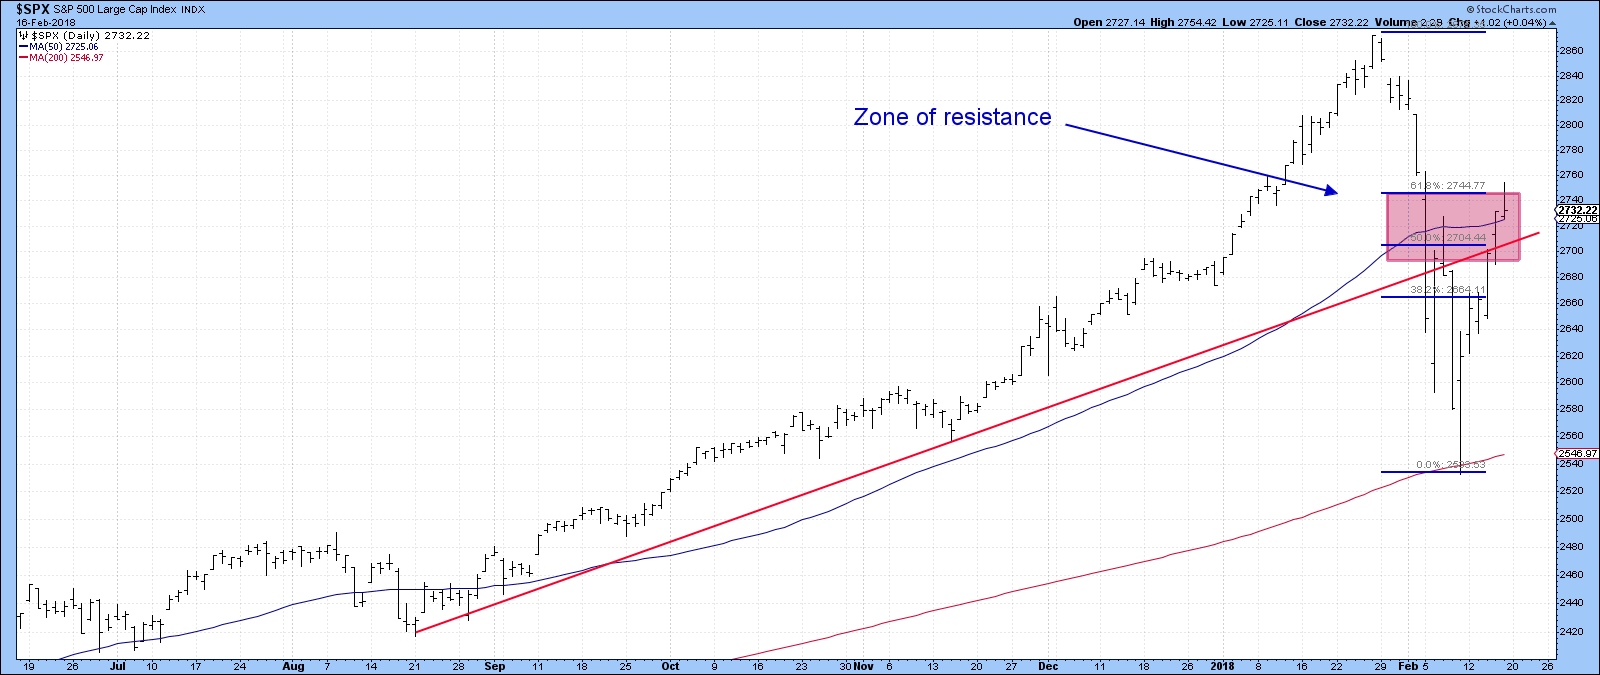
Last week I suggested that the S&P had reached a resistance zone following its bounce from the early February panic...
READ MORE
MEMBERS ONLY
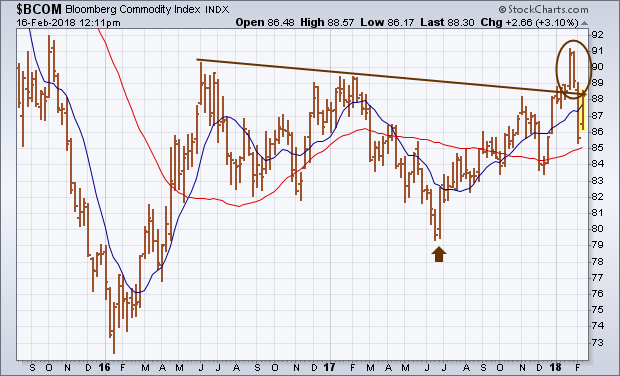
Recent Pullback in Commodities Is Likely Tied to Stock Correction
by John Murphy,
Chief Technical Analyst, StockCharts.com
My January 27 message wrote about a bullish breakout in commodity prices to the highest level in two years. I took that as another sign that inflation pressures were starting to build. The weekly bars in Chart 1 show that bullish breakout taking place in the Bloomberg Commodity Index (circled...
READ MORE
MEMBERS ONLY
Big Scores Made Possible through Extreme Patience

by John Hopkins,
President and Co-founder, EarningsBeats.com
I'm sure most traders get tired of being told to be patient when the market or a specific stock is climbing day after day. Missing out on nice rallies can be extremely frustrating. But if there ever was a time when patience paid off big time it was...
READ MORE
MEMBERS ONLY
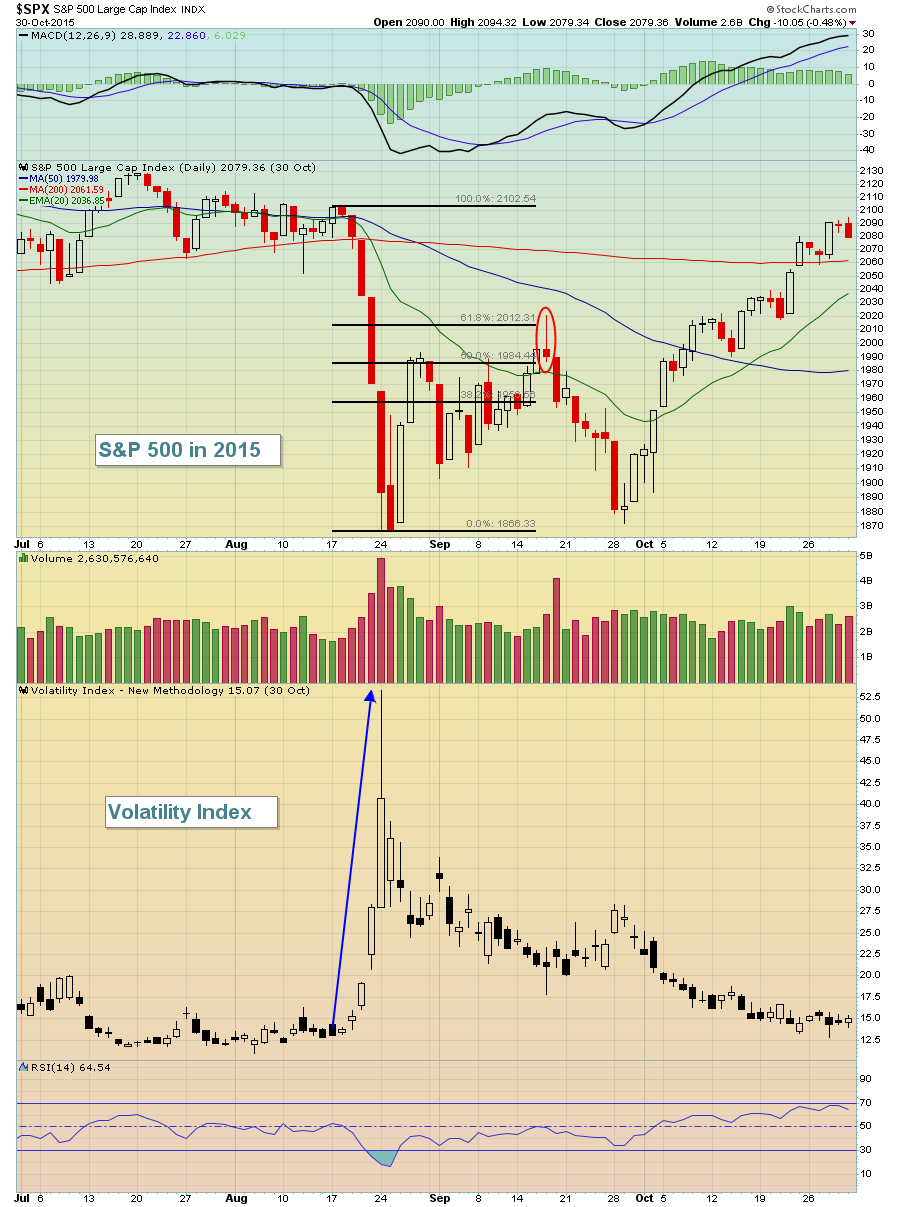
History And Fibonacci Say We Topped On Friday
by Tom Bowley,
Chief Market Strategist, EarningsBeats.com
Fear ramped up with the early February selling and a capitulatory bottom (at least short-term) printed. The Volatility Index ($VIX) doesn't hit the 40-50 zone often and, when it does, it typically coincides with a panicked selloff and bottom. The last time we saw panicked selling (before the...
READ MORE
MEMBERS ONLY
Where Did All Those New Lows Come From?
by Arthur Hill,
Chief Technical Strategist, TrendInvestorPro.com
Stocks rebounded this week as the S&P 500 Equal-Weight Index ($SPXEW) recovered most of the losses from the previous week. On a closing basis, the index fell around 10% in nine days and then recovered around half of this loss with a 5.4% gain the last six...
READ MORE
MEMBERS ONLY
DP Weekly Wrap: Bear Market Rally Over?
by Carl Swenlin,
President and Founder, DecisionPoint.com
Last Friday the market executed a bullish intraday reversal, and this week it rallied five days straight; however, there were some problems. S&P 500 volume contracted into the rally, and Friday's candlestick was a bearish shooting star. I don't really use candlesticks much, but...
READ MORE
MEMBERS ONLY
Bull or Bear Market Rules?
by Erin Swenlin,
Vice President, DecisionPoint.com
Today on MarketWatchers LIVE, I did a workshop on bull and bear market rules. You'll hear many technicians discuss "bull market rules apply" or vice versa. The question is pertinent and timely right now. The jury is still out on whether we are about to enter...
READ MORE