MEMBERS ONLY
Transports Fail Again At Resistance, Watch Them Closely

by Tom Bowley,
Chief Market Strategist, EarningsBeats.com
Market Recap for Monday, May 14, 2018
It was a day of bifurcated action, although the Dow Jones did manage to close higher for the 8th consecutive trading session, the longest such streak in 2018. One look at sector performance, however, illustrates the mixed action. Four sectors finished higher while...
READ MORE
MEMBERS ONLY
DP Bulletin #1: SPX Generates a New Intermediate-Term Trend Model BUY Signal

by Erin Swenlin,
Vice President, DecisionPoint.com
The SPX is the 2nd of the four DP Scoreboard indexes to trigger a new IT Trend Model BUY signal. This signal replaces a late March Neutral signal.
I've added the OEX and Dow charts below the SPX so you can see how close they are to triggering...
READ MORE
MEMBERS ONLY

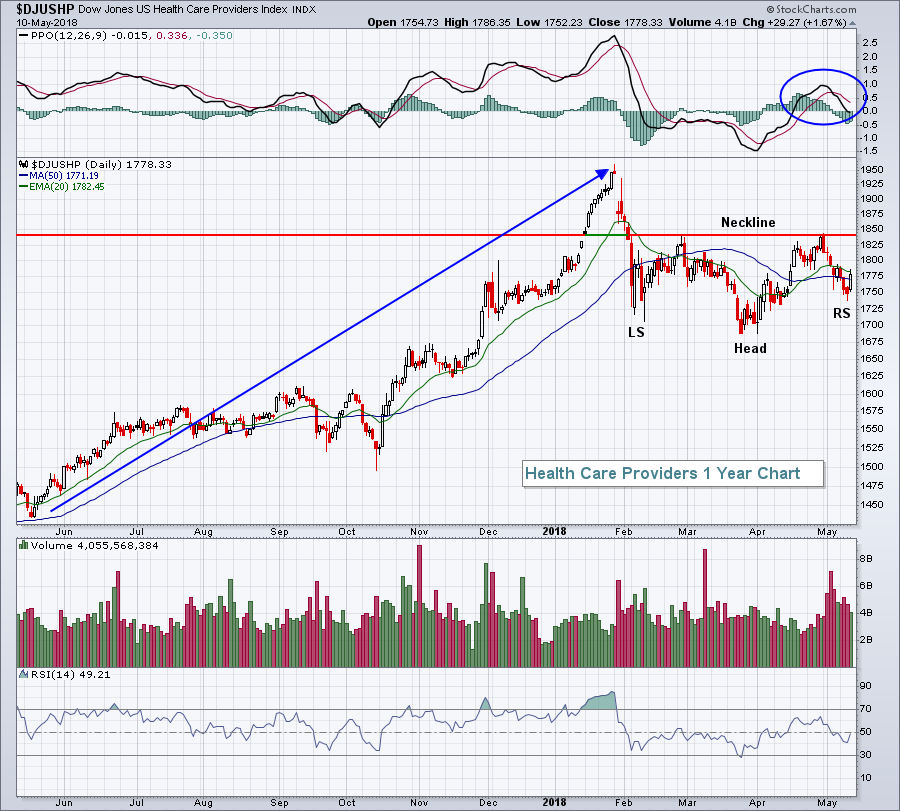
Pfizer Surges within Consolidation

by Arthur Hill,
Chief Technical Strategist, TrendInvestorPro.com
The healthcare sector is coming alive on Monday and leading the broader market. As with the S&P 500, this sector struggled in 2018 and the Health Care SPDR (XLV) is up around 1.5% year-to-date. SPY, for reference, is up almost 3% this year.
The chart below shows...
READ MORE
MEMBERS ONLY

New pre-populated universes for Relative Rotation Graphs

by Julius de Kempenaer,
Senior Technical Analyst, StockCharts.com
If you have ever watched one of the webinars or Market Watchers Live shows that I have done here at Stockcharts.com, you may have seen me use Relative Rotation Graphs holding individual stocks and compare them to their sector benchmark.
After each appearance, I always got a few questions...
READ MORE
MEMBERS ONLY

Smaller Biotechs are Outperforming Larger Biotechs (IBB, XBI and XLV)
by Arthur Hill,
Chief Technical Strategist, TrendInvestorPro.com
* Biotechs Perk Up.
* Average-Cap XBI versus Large-cap IBB.
* IBB Surges off Support.
* XBI Holds Above Support.
* Health Care SPDR Bounces off Retracement Zone.
Biotechs showed some upside leadership with a big surge last week, most of which occurred on Friday. This group has been lagging the market in 2018, but...
READ MORE
MEMBERS ONLY
Biotechs Break To Six Week High As Healthcare Advances; Biotechs Poised To Lead Again
by Tom Bowley,
Chief Market Strategist, EarningsBeats.com
Market Recap for Friday, May 11, 2018
Considering the gains that the bulls enjoyed earlier in the week, Friday's end-of-day numbers weren't too shabby. Only the NASDAQ (-2.09 points) lost ground. Over the six prior sessions, the NASDAQ moved from its intraday low on May...
READ MORE
MEMBERS ONLY

CHARTS SUGGEST THAT STOCKS HAVE TAKEN A TURN FOR THE BETTER -- VANGUARD TOTAL STOCK MARKET ETF BREAKS THROUGH RESISTANCE BARRIERS -- FOREIGN STOCK ETFS ARE ALSO BOUNCING -- HONG KONG LEADS EMERGING MARKET REBOUND -- DON'T GET COMPLACENT ON INFLATION

by John Murphy,
Chief Technical Analyst, StockCharts.com
STOCKS APPEAR TO HAVE TURNED THE CORNER ... Stocks had a very good week. Major U.S. stock indexes had their best week in two months, with all of them gaining more than 2%. Small caps and the Nasdaq led the market higher. The S&P 600 Small Cap Index...
READ MORE
MEMBERS ONLY

Richard W. Arms Jr., Wyckoffian

by Bruce Fraser,
Industry-leading "Wyckoffian"
Richard (Dick) Arms was a very creative market technician. He tackled one of the most elusive concepts in technical analysis: Volume. He became famous for creating the ‘ARMS Index’ (previously known as the TRIN Index). Dick created the ARMS Index in 1967 and published it in Barron’s Magazine. It...
READ MORE
MEMBERS ONLY
This Rally Looks Like It Has Legs

by Martin Pring,
President, Pring Research
* When a top is not a top
* The rally is broadly based
* Is the US about to out-perform the world again?
When a top is not a top
Last week I pointed out that several indicators were positioned for a nice rally. However, one of the lingering questions related to...
READ MORE
MEMBERS ONLY
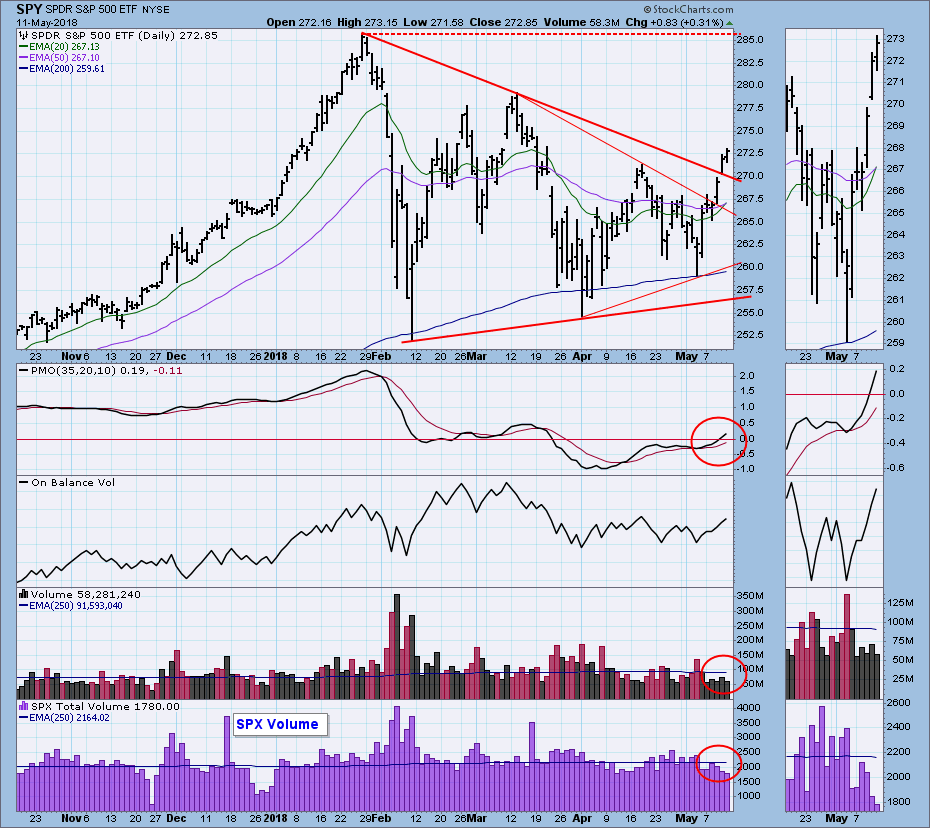
DP Weekly Wrap: SPY New BUY Signal

by Carl Swenlin,
President and Founder, DecisionPoint.com
On Friday the SPY 20EMA crossed up through the 50EMA, generating an Intermediate-Term Trend Model (ITTM) BUY signal for the broad market (SPY). Does this mean that I will have to reconsider my assumption that we are in a bear market? Well, I can hardly avoid it, but I still...
READ MORE
MEMBERS ONLY

DOW INDUSTRIALS NEAR UPSIDE BREAKOUT -- TRANSPORTS ARE ALSO NEARING APRIL HIGH -- BANKS AND FINANCIALS SHOW MARKET LEADERSHIP -- % OF NYSE STOCKS ABOVE 200-DAY MOVING AVERAGE TURNS UP -- COMMON STOCK ONLY AD LINE HITS NEW RECORD
by John Murphy,
Chief Technical Analyst, StockCharts.com
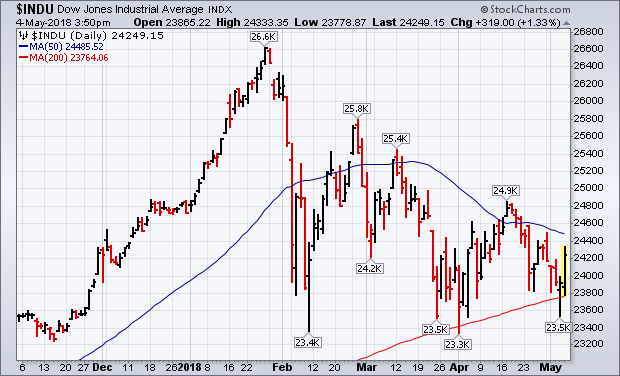
LOOKING FOR A DOW THEORY BUY SIGNAL ... It's always a good sign to see the Dow Industrials and Transports rising together, as they're doing today. The price bars in the upper chart show the Dow Industrials testing their mid-April peak at 24,900. An upside breakout...
READ MORE
MEMBERS ONLY
Treasury Yields, Dollar Take Breather; Utilities Rise
by Tom Bowley,
Chief Market Strategist, EarningsBeats.com
Market Recap for Thursday, May 10, 2018
It was a very bullish day on Wall Street. I suppose you could nit pick and point to utilities (XLU, +1.41%) outperforming on an up day, but it's difficult to ignore the solid participation during yesterday's rise. All...
READ MORE
MEMBERS ONLY

Weekly Market Review & Outlook (with Video) - Semis, Finance and Industrials Rebound
by Arthur Hill,
Chief Technical Strategist, TrendInvestorPro.com
* Weighing the Evidence.
* S&P 500 Breaks April High and Reverses Downswing.
* Small-caps Lead with New High.
* Small-caps are Really Really Small.
* Nasdaq 100 Leads New High List.
* Small-cap Sectors Lead.
* Tech, Finance and Industrials Dominate.
* Small-cap Industrials Sector Leads.
* Finance Sector Recovers.
* Notes from the Art's...
READ MORE
MEMBERS ONLY

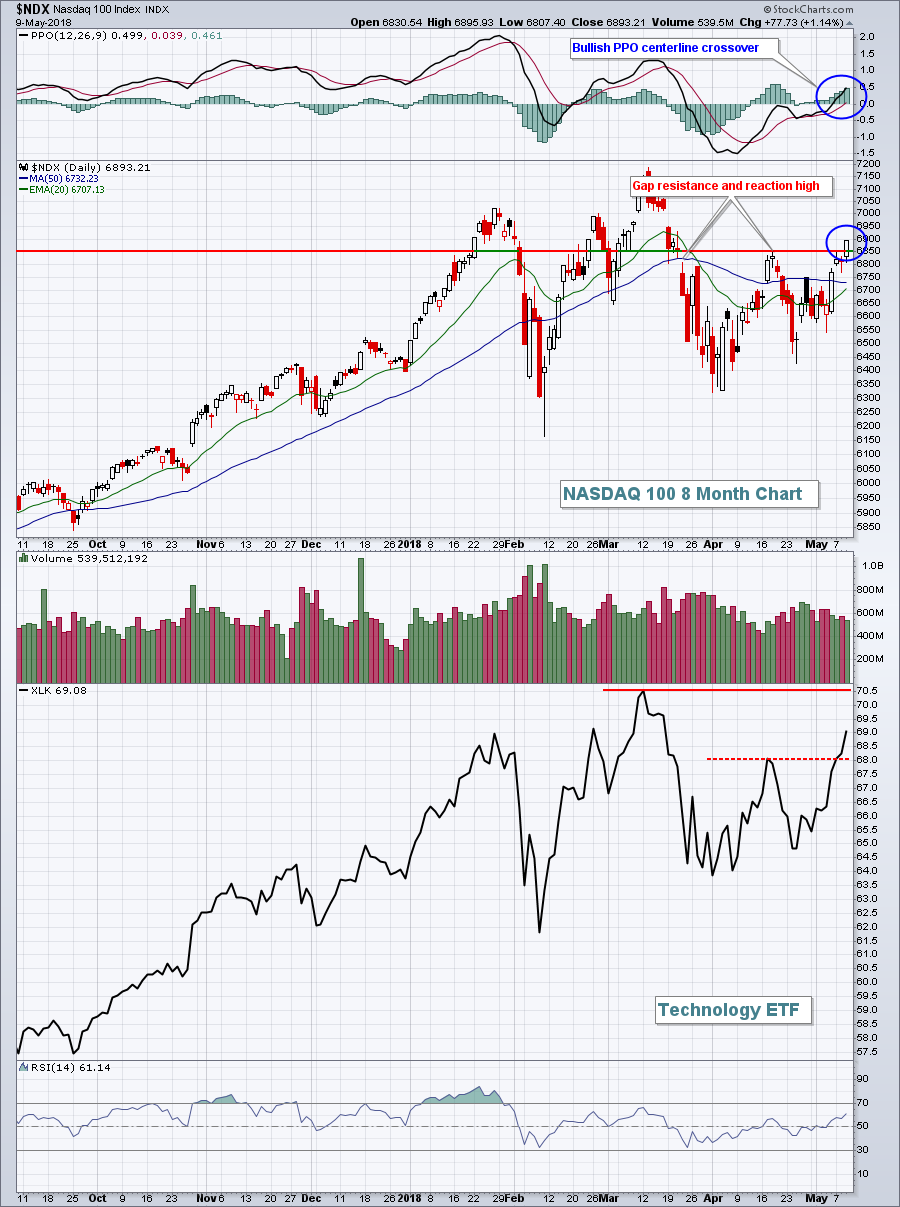
THE NASDAQ 100 IS LEADING THE MARKET HIGHER -- SO IS THE TECHNOLOGY SECTOR -- THE S&P 600 SMALL CAP INDEX IS BREAKING OUT TO A NEW RECORD -- THE RUSSELL 2000 ISN'T FAR BEHIND -- THAT'S PULLING LARGE CAPS HIGHER
by John Murphy,
Chief Technical Analyst, StockCharts.com
NASDAQ 100 AND TECHNOLOGY SECTOR ACHIEVE BULLISH BREAKOUTS ... The technical picture for the stock market continues to improve on a lot of fronts. One of them is this week's upside breakout in Nasdaq market. Chart 1 shows the PowerShares Nasdaq 100 (QQQ) climbing above its mid-April high to...
READ MORE
MEMBERS ONLY
Building a Rules-Based Trend Following Model - 9

by Greg Morris,
Veteran Technical Analyst, Investor, and Author
One of my trend following indicators was created because I felt that there were some issues with market breadth that needed attention. For example, the Friday after Thanksgiving. The market is only open a few hours and trading volume is very light. There are price changes but nothing exceptional. However,...
READ MORE
MEMBERS ONLY
S&P Small Caps Close At All-Time High; Falling VIX Says NO To Bear Market
by Tom Bowley,
Chief Market Strategist, EarningsBeats.com
Market Recap for Wednesday, May 9, 2018
Was Wednesday the day that marked the resumption of the 9 year bull market? Some might argue it began with the bottom last week, while others might argue it hasn't begun because the Dow Jones and S&P 500 are...
READ MORE
MEMBERS ONLY

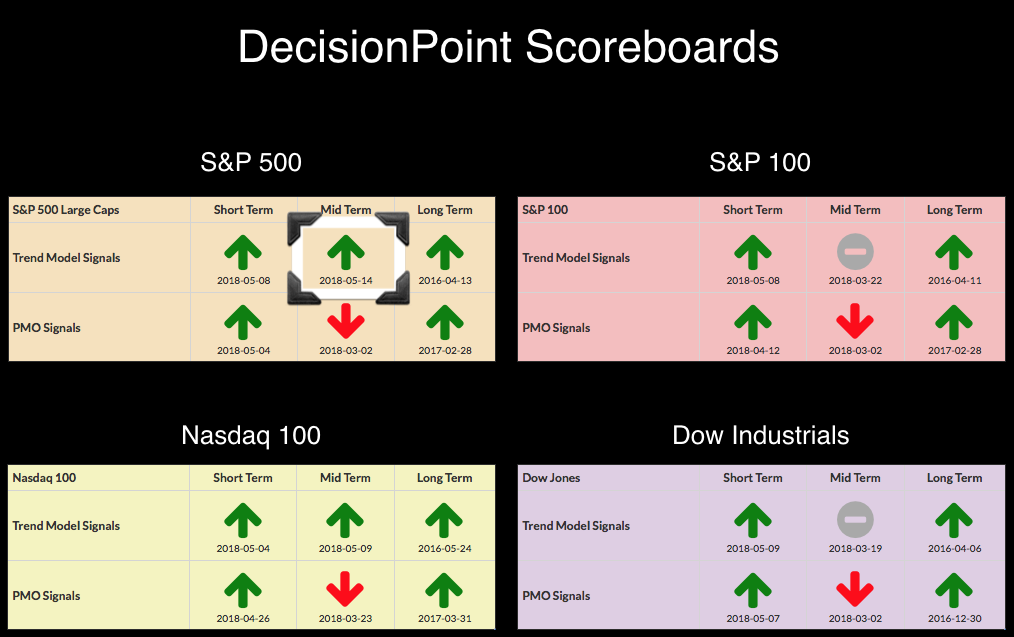
DP Alert: NDX First to Get IT BUY Signal - Bullish Indicators - Dow ST BUY Signal
by Erin Swenlin,
Vice President, DecisionPoint.com
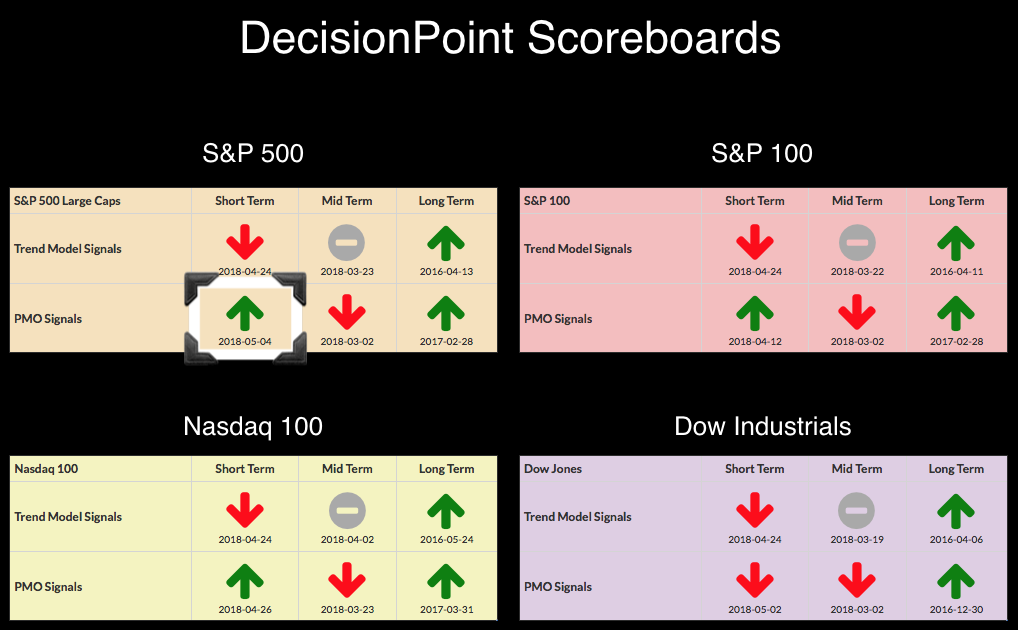
It's going to be one of those weeks apparently when we watch the DecisionPoint Scoreboards flip out. We have had seven signal changes starting May 4th. The reversals in the short-term trend is typical during volatile periods. What I'm most interested in right now are the...
READ MORE
MEMBERS ONLY

THREE-YEAR HIGH IN OIL MAKES ENERGY MARKET LEADERS -- S&P OIL & GAS EXPLORATION & PRODUCTION SPDR BREAKS OUT -- OCCIDENTAL AND EOG ARE XOP LEADERS -- RISING OIL AND BOND YIELDS EXPLAIN WHY ENERGY SHARES ARE DOING BETTER THAN UTILITIES
by John Murphy,
Chief Technical Analyst, StockCharts.com
ENERGY SHARES HAVE BECOME MARKET LEADERS... This shouldn't come as news to readers of this website. Articles written by myself and my colleagues at Stockcharts.com have been bullish on crude oil and energy stocks since the first quarter. So this is just an update of an ongoing...
READ MORE
MEMBERS ONLY
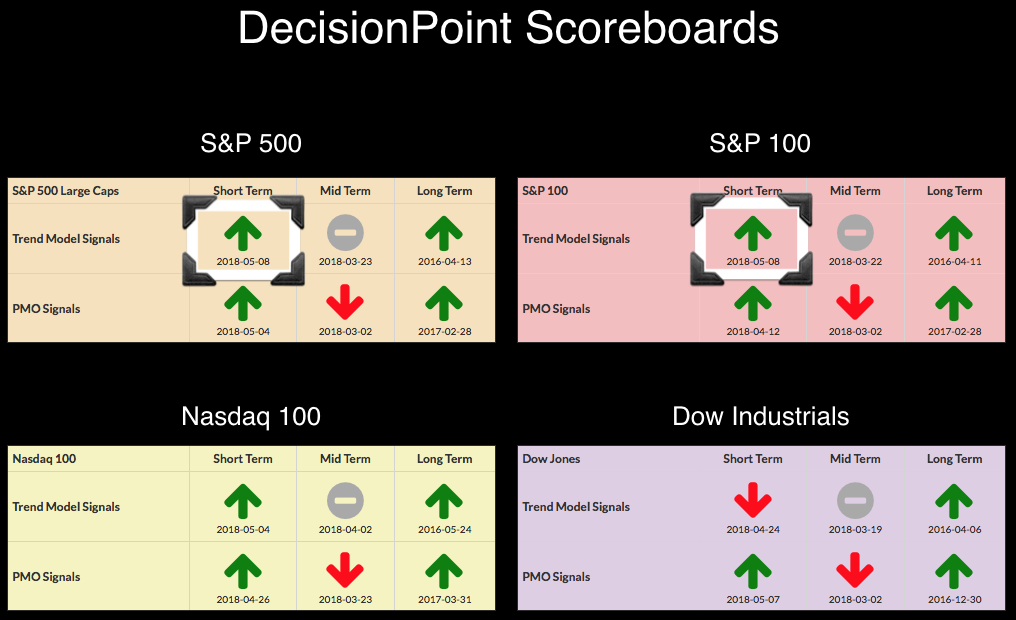
Bullish Rotation Continues On Tuesday Despite Flat Market
by Tom Bowley,
Chief Market Strategist, EarningsBeats.com
Market Recap for Tuesday, May 8, 2018
There are days when the stock market seems to go nowhere and are relatively meaningless. Tuesday wasn't one of those days. While the Dow Jones and NASDAQ gained a measly 2.89 and 1.69 points, respectively, and the S&...
READ MORE
MEMBERS ONLY

Ringing the Bell for Hilton
by Arthur Hill,
Chief Technical Strategist, TrendInvestorPro.com
Hilton (HLT) led the market in the second half of 2017 and then took a breather in 2018. This is looking like the pause that refreshes as the stock challenges resistance.
First and foremost - you know the drill - the long-term trend is up and this means I am...
READ MORE
MEMBERS ONLY

Banks Lead on Multiple Timeframes - Plus JPM, MS, Energy-ETFs, Bonds and Utes
by Arthur Hill,
Chief Technical Strategist, TrendInvestorPro.com
* Banks Lead on Multiple Timeframes.
* Regional Bank SPDR Extends Upturn.
* Big Banks are Mixed.
* Wedge Corrections for JPM and MS.
* Small-caps Get Dollar Tailwind.
* Energy ETFs Break Out of Consolidations.
* Bond Market Breakdown Holds.
* Utilities Look Poised to Continue Downtrend.
Banks Lead on Multiple Timeframes...
The PerfChart below shows the...
READ MORE
MEMBERS ONLY
DP Bulletin #2: SPX and OEX Garner New Short-Term Trend Model BUY Signals
by Erin Swenlin,
Vice President, DecisionPoint.com
The SPX and OEX both triggered new ST Trend Model BUY signals as the 5-EMAs crossed above the 20-EMAs. However, the charts are less than impressive.
We are seeing new strength on the DecisionPoint Scoreboards with four new PMO BUY signals and now 3 out of 4 indexes carrying ST...
READ MORE
MEMBERS ONLY
Gains Moderate, But Relative Strength Felt In Key Areas
by Tom Bowley,
Chief Market Strategist, EarningsBeats.com
Market Recap for Monday, May 7, 2018
There was plenty of green on Monday, adding to the gains we saw late last week. The only areas of the market that struggled were the defensive consumer staples (XLP, -0.62%) and utilities (XLU, -0.52%). On the flip side, money rotated...
READ MORE
MEMBERS ONLY
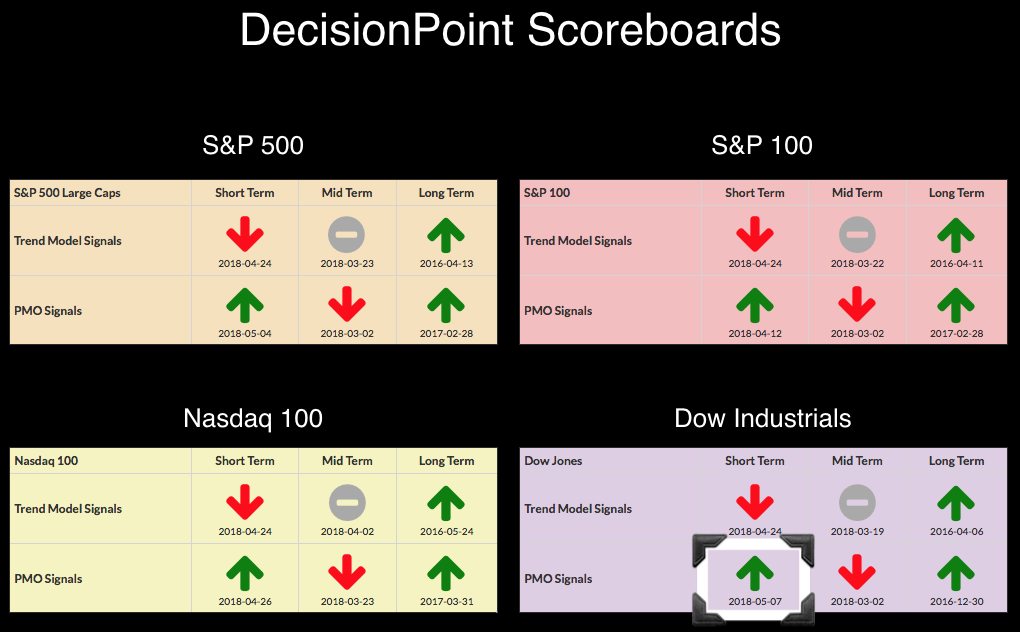
DP Bulletin #1: Short-Term PMO BUY Signal Logged on Dow Industrials
by Erin Swenlin,
Vice President, DecisionPoint.com
All four Scoreboard indexes have PMO BUY signals as of today. The Dow was the laggard, but between Friday's and today's rallies, momentum has shifted enough to push the PMO over its signal line.
While we do have a PMO BUY signal, I'm not...
READ MORE
MEMBERS ONLY

Buy In May And Say Hooray?
by Martin Pring,
President, Pring Research
* Sell in May does not have a great track record
* Technology continues to outpace staples, and that’s bullish
* Technology, consumer cyclicals and REITS are well positioned for a rally
Sell in May does not have a great track record
If there is a seasonal saying that seems ubiquitous at...
READ MORE
MEMBERS ONLY

Discount Brokers Lead the Market
by Arthur Hill,
Chief Technical Strategist, TrendInvestorPro.com
The discount brokers are showing strength in the broader market with E-Trade Financial (ETFC) and Interactive Brokers (IBKR) hitting new highs in May. Schwab (SCHW) is breaking out of a small triangle, while TD Ameritrade is bouncing within a bigger triangle. A picture is worth a thousand words and the...
READ MORE
MEMBERS ONLY

Breadth Thrust Shows Expanding Participation - SOXX Surges off Support - A Bunch of Stock Setups
by Arthur Hill,
Chief Technical Strategist, TrendInvestorPro.com
* One-Day Breadth Thrust.
* SOXX Surges off Support.
* Four Semiconductor Stocks to Watch.
* A Bollinger Band Squeeze for Akamai.
* Five Stocks to Watch: ABT, ACN, ANTM, HCA, SLB.
One-Day Breadth Thrust...
As noted last Thursday, I was not impressed with the breadth indicators because they showed narrow upside participation. This changed...
READ MORE
MEMBERS ONLY
Jobs Come Up Short, But Technology And Consumer Stocks Surge
by Tom Bowley,
Chief Market Strategist, EarningsBeats.com
Market Recap for Friday, May 4, 2018
For many weeks, we've seen the stock market seemingly ignore great earnings news and retreat. Highly visible companies like Boeing (BA), Caterpillar (CAT), Intel (INTC) and Microsoft (MSFT) gained initially after blowout earnings, then stumbled after traders attempted to figure out...
READ MORE
MEMBERS ONLY

MESSAGE FROM FEBRUARY PUT CURRENT TRIANGULAR FORMATION IN ELLIOTT WAVE CONTEXT -- TRIANGLES NORMALLY HAVE FIVE WAVES WITH THREE PULLBACKS -- THIS PAST WEEK'S PULLBACK WAS THE THIRD ONE
by John Murphy,
Chief Technical Analyst, StockCharts.com
FEBRUARY MESSAGE SUGGESTED THAT TRIANGULAR FORMATION WAS LIKELY... Everyone is talking about the triangular formation that the stock market has been forming over the last three months. It's important that the situation leading up to that formation be understood, as well as its meaning. My February 21 Market...
READ MORE
MEMBERS ONLY
Rising Dollar Should Change Your Investment Strategy
by Tom Bowley,
Chief Market Strategist, EarningsBeats.com
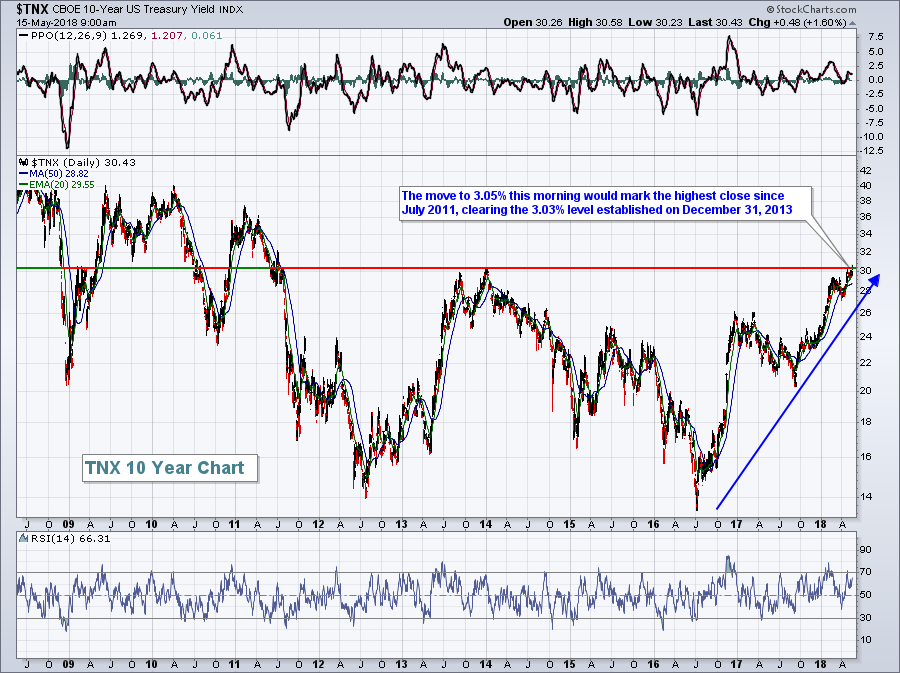
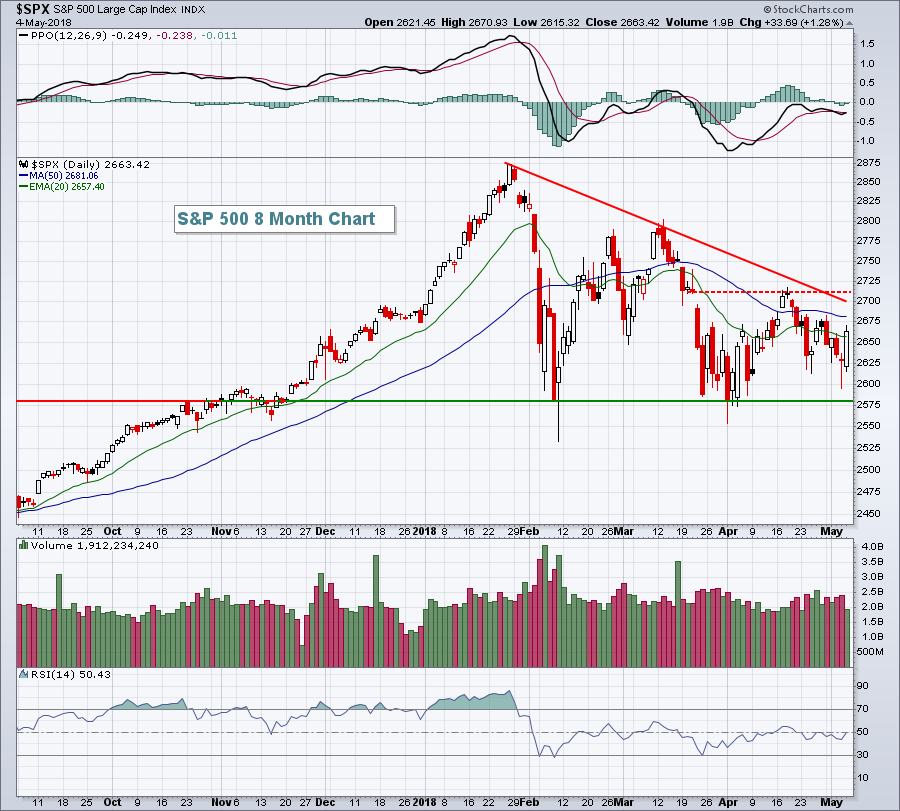
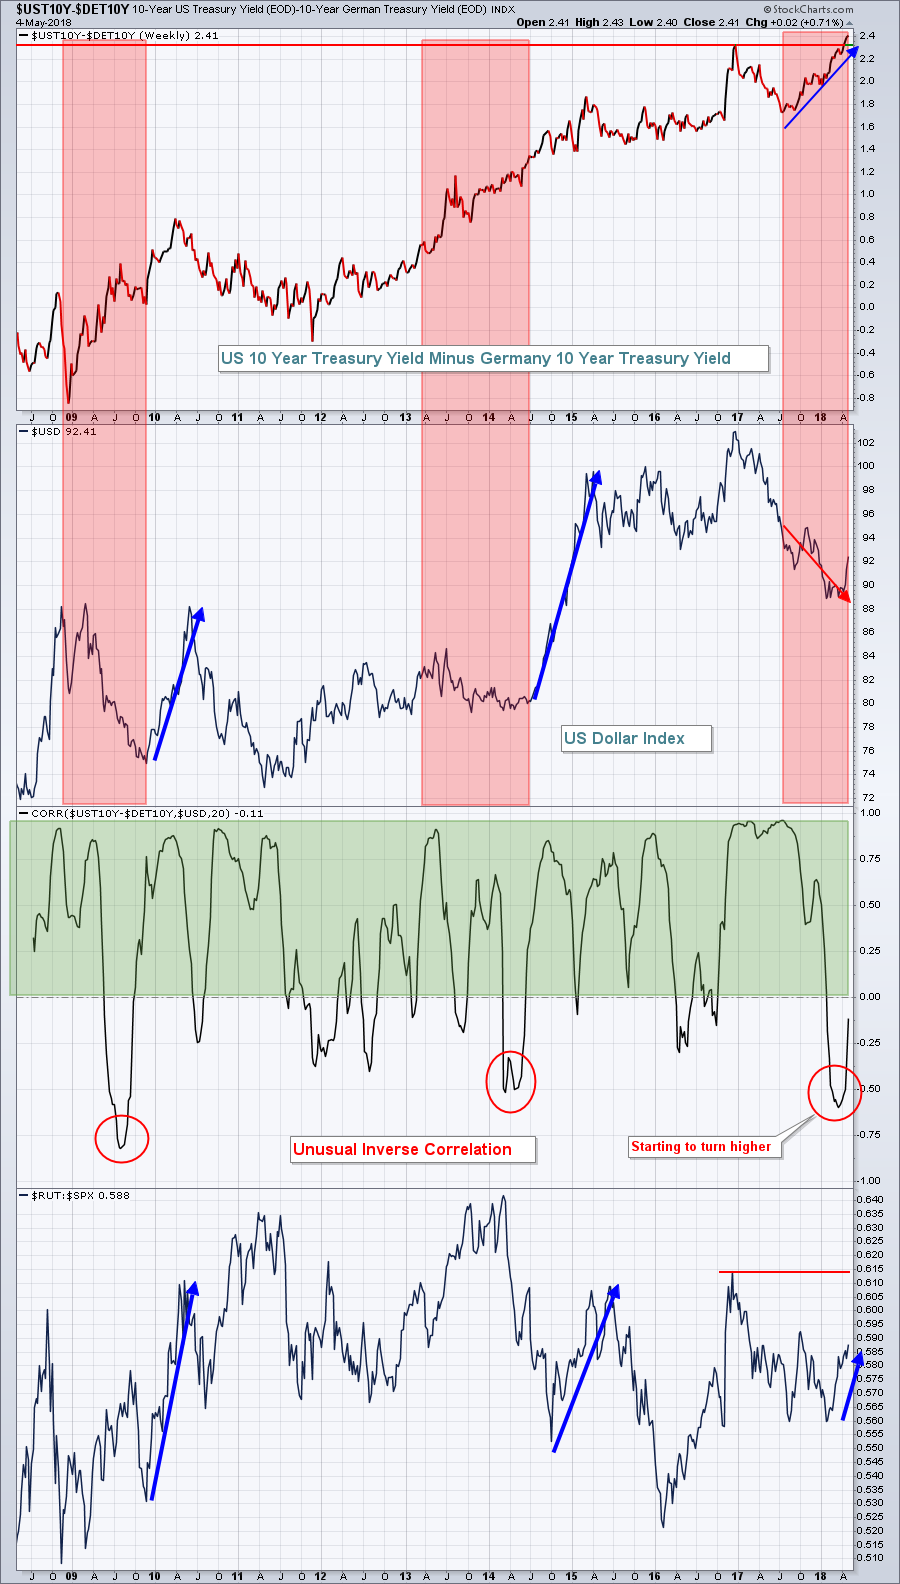
Throughout 2017 the U.S. Dollar Index ($USD) was falling and aiding profits on multinational companies found on the S&P 500. But it was time for the dollar to rise, as evidenced by a surging U.S. 10 year treasury yield ($UST10Y) vs. Germany's 10 year...
READ MORE
MEMBERS ONLY
Climactic Breadth Readings: Buying Exhaustion or Initiation? - Whipsaw BUY Signal for SPX
by Erin Swenlin,
Vice President, DecisionPoint.com
The SPX whipsawed into a Price Momentum Oscillator (PMO) BUY signal, suggesting a short-term rally is up next. Climactic breadth indicators popped on Friday and the VIX penetrated the upper Bollinger Band. When I see these types of readings, I classify them as a buying exhaustion or buying initiation.
Below...
READ MORE
MEMBERS ONLY

The Bird's Eye View: Big Advances Deserve Big Corrections
by Arthur Hill,
Chief Technical Strategist, TrendInvestorPro.com
2018 has been a tough year for stocks with the S&P 500 SPDR (SPY) basically unchanged (+.08%) for the year. During this journey to unchanged, SPY was up around 7% at its late January high and down around 5% at its February low. The index has since gyrated...
READ MORE
MEMBERS ONLY
Stocks Are Ending The Week On a Strong Note
by John Murphy,
Chief Technical Analyst, StockCharts.com
Editor's Note: This article was originally published in John Murphy's Market Message on Friday, May 4th at 3:50pm EST
STOCKS REBOUND OFF 200-DAY LINES... Chart 1 shows the Dow surging more than 300 points after surviving another test of its 200-day average yesterday. Chart 2...
READ MORE
MEMBERS ONLY
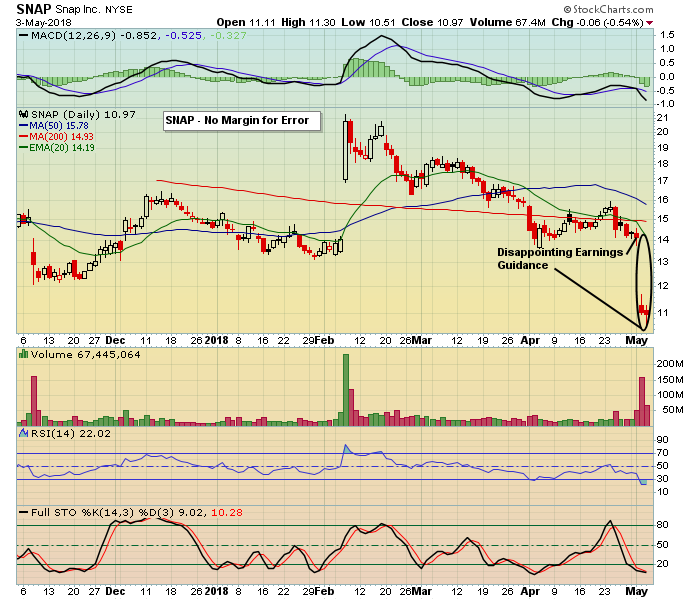
Profiting from Weak Earnings

by John Hopkins,
President and Co-founder, EarningsBeats.com
Analysts will tell you that this earnings season has been a great success. In fact, many companies exceeded earnings expectations and were handsomely rewarded by the market. However, there were also plenty of companies that missed earnings expectations and/or provided worse than expected guidance, taking those stocks lower, and...
READ MORE
MEMBERS ONLY

Does This Market Have Bad Breadth?
by Bruce Fraser,
Industry-leading "Wyckoffian"
The percentage of stocks above their 200 day moving average (200dma) is a breadth indicator that I have depended on for many years. It theoretically oscillates from zero to 100 percent. During bull markets this oscillator spends most of its time between 40% and 85%. During bear markets between 60%...
READ MORE
MEMBERS ONLY
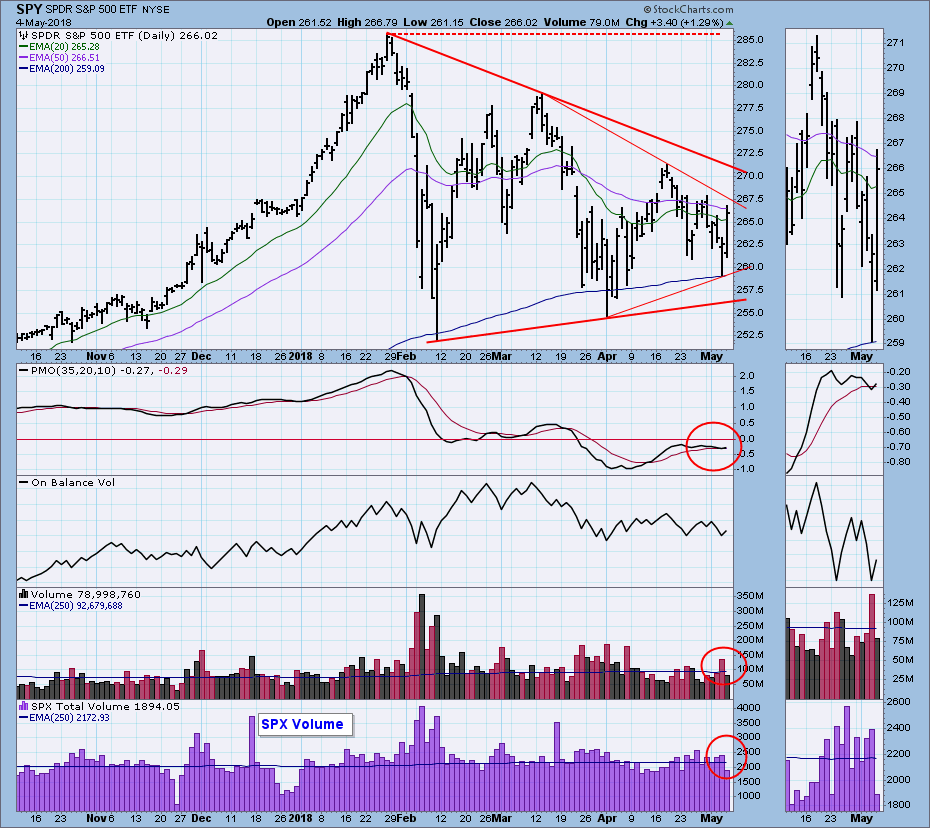
DP Weekly Wrap: Strong Finish, but Where's the Love?
by Carl Swenlin,
President and Founder, DecisionPoint.com
On Thursday the market recovered nicely from an early selloff, and today it had a strong finish. But in the market, volume equals love, and the short volume on Friday was barely a peck on the cheek. On my SPY chart I like to show, in addition to SPY volume,...
READ MORE
MEMBERS ONLY

STOCKS ARE ENDING THE WEEK ON A STRONG NOTE -- NASDAQ 100 CLEARS 50-DAY AVERAGE -- SO DOES THE RUSSELL 2000 -- THE THIRD SUCCESSFUL TEST OF 200-DAY MOVING AVERAGES IS A GOOD SIGN
by John Murphy,
Chief Technical Analyst, StockCharts.com
STOCKS REBOUND OFF 200-DAY LINES... Stocks are ending the week on a strong note. Chart 1 shows the Dow surging more than 300 points after surviving another test of its 200-day average yesterday. Chart 2 shows the S&P 500 doing just as well. Both indexes still need to...
READ MORE
MEMBERS ONLY

Weekly Market Review & Outlook (with Video) - Slugging without Conviction
by Arthur Hill,
Chief Technical Strategist, TrendInvestorPro.com
* S&P 500 Caught in the Crossfire.
* SPY Reverses Upswing.
* Large-cap Tech Holds up Well.
* A Bull Flag in the S&P SmallCap iShares.
* Finance and Industrials Weigh.
* Healthcare Breakdown Tilts the Balance.
* Mind the Gap in Tech-Related ETFs.
* Oil Forms Bull Flag.
* Gold Forges Lower Low and...
READ MORE
MEMBERS ONLY
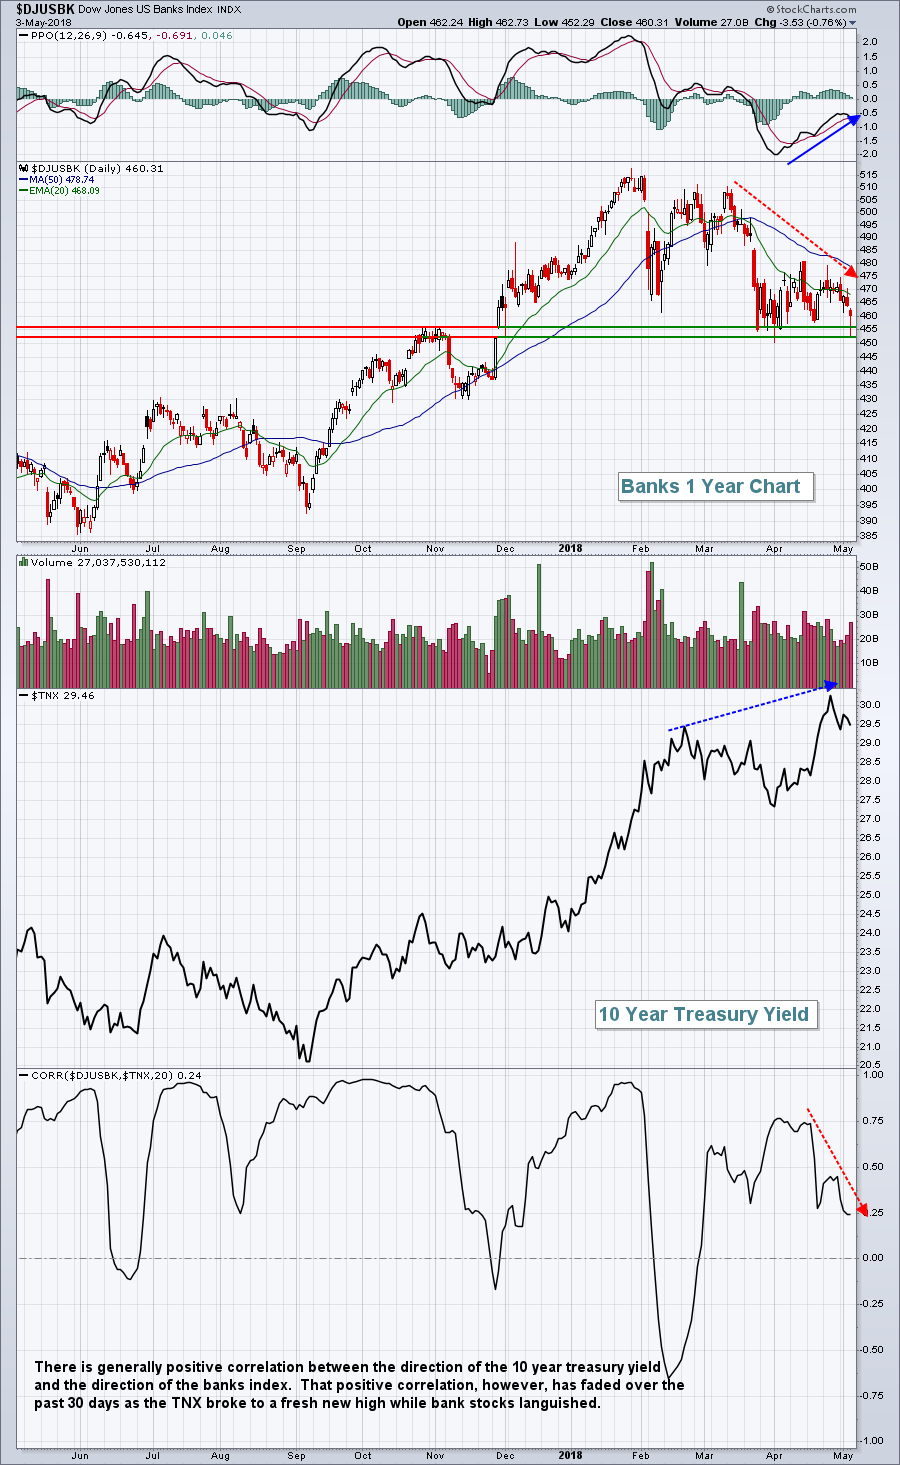
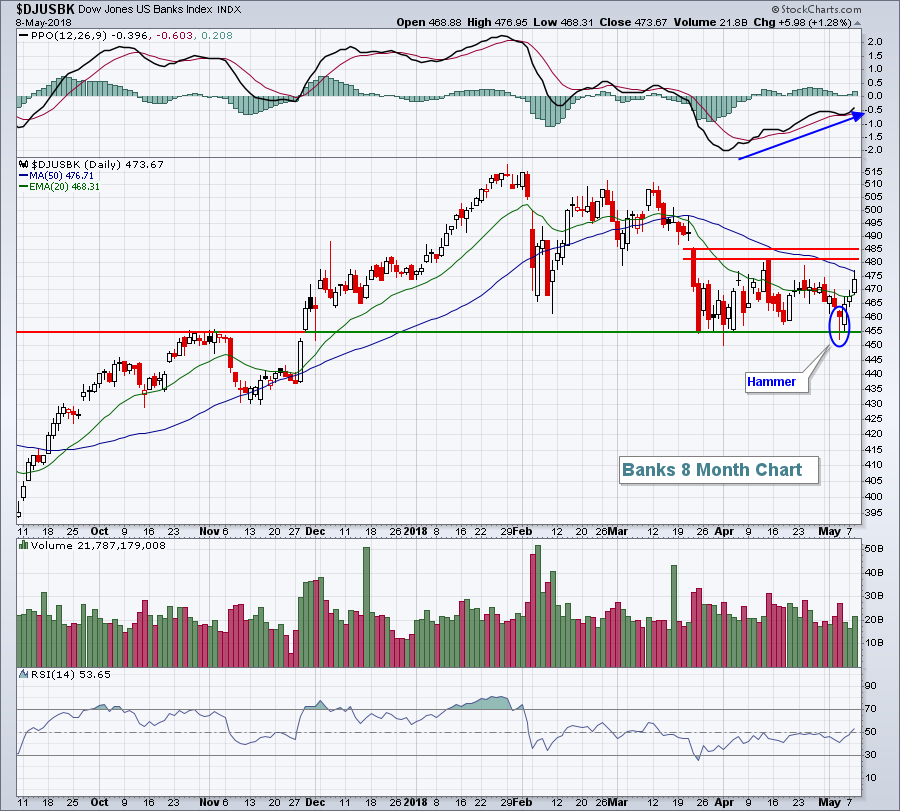
Banks Lead Reversal Off Major Support And UNH Could Be Ripe For A Strong May
by Tom Bowley,
Chief Market Strategist, EarningsBeats.com
Market Recap for Thursday, May 3, 2018
The Dow Jones was the only major index to finish in positive territory on Thursday, but it could have been so much worse. In the first 90 minutes of trading, the S&P 500 found itself back below 2600 and within just...
READ MORE
MEMBERS ONLY
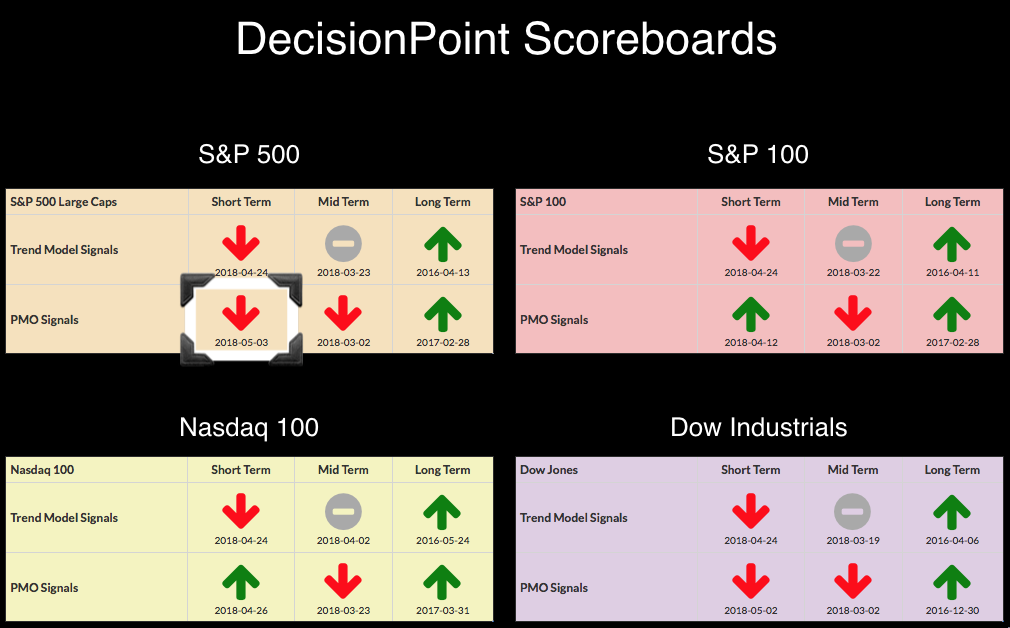
DP Bulletin: SPX Joins Dow with a New ST PMO SELL Signal
by Erin Swenlin,
Vice President, DecisionPoint.com
Today the SPX joined the Dow with a new PMO SELL signal. If the correction continues much longer, the OEX and NDX will follow suit.
Today's action left the SPX with a long tail that tested the purple rising bottoms trendline. This test was successful, but the breakdown...
READ MORE