MEMBERS ONLY
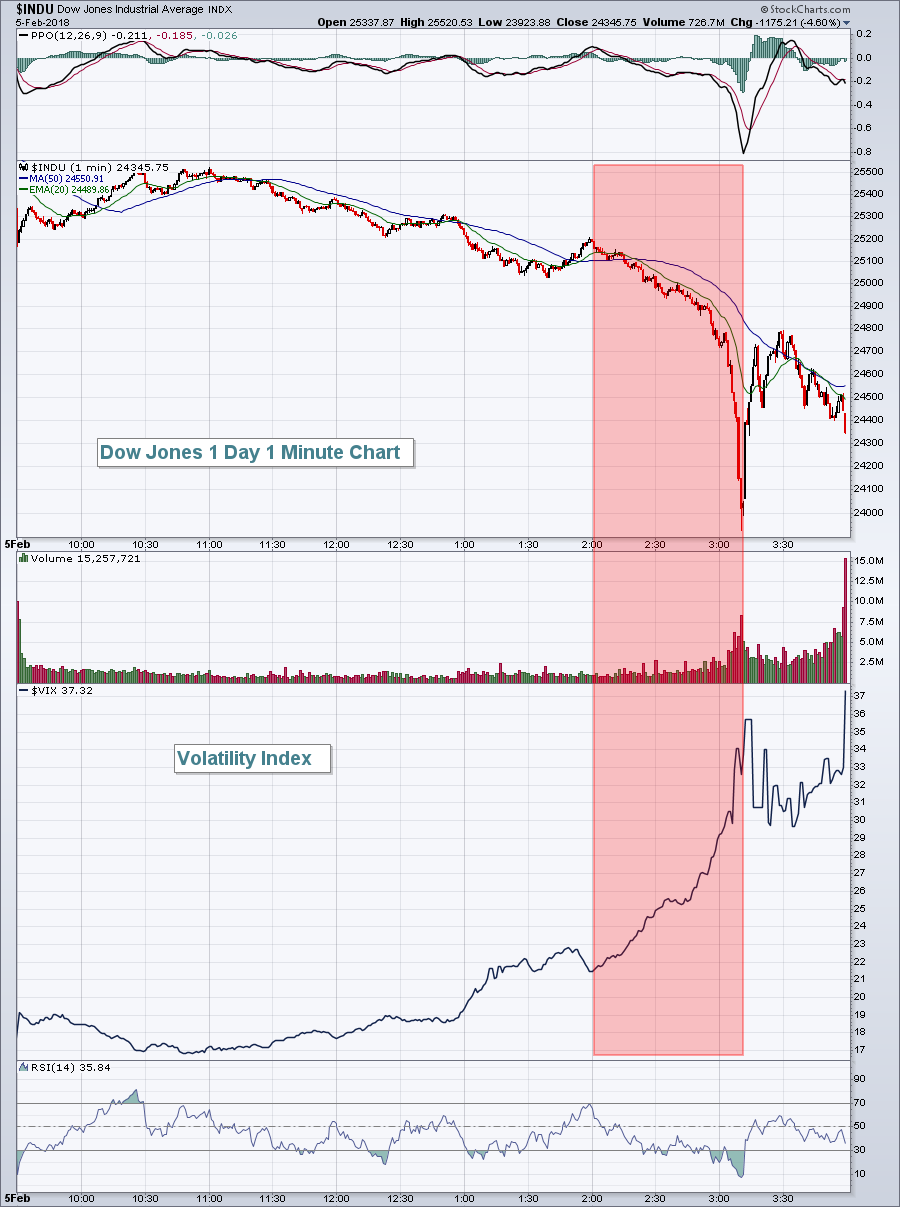
Look To VIX To Call Market Bottom

by Tom Bowley,
Chief Market Strategist, EarningsBeats.com
Market Recap for Monday, February 5, 2018
What a day and especially what a final hour! It was very reminiscent of selling episodes in 2008 where our major indices were losing a percent every few minutes. From a bullish perspective, there's little defense from panicked selling other than...
READ MORE
MEMBERS ONLY

Is this Just a Correction or Something More?

by Arthur Hill,
Chief Technical Strategist, TrendInvestorPro.com
* First Things First (Correction or More?).
* Another Perfect Storm.
* Yield Curve Turns Up.
* Oversold Setup in Breadth Indicators.
* A Bullish Setup for VIX.
* Playing the Guessing Game.
* Past Corrections Study.
First Things First
It is still a bull market. The 50-day EMA for the S&P 500 remains above...
READ MORE
MEMBERS ONLY
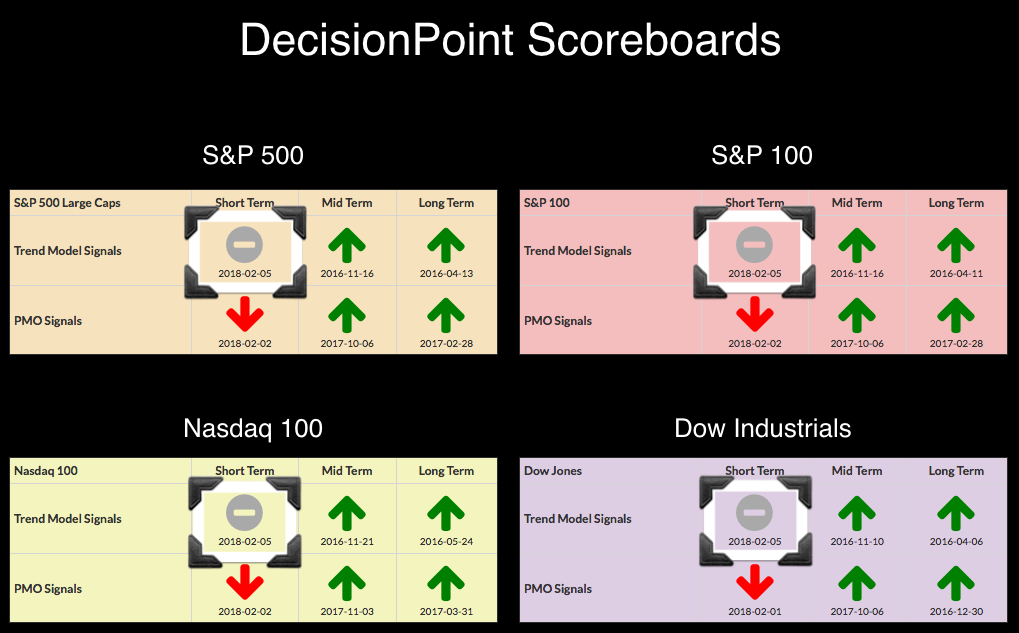
DP Bulletin: ST Trend Model Neutrals on Scoreboard Indexes - PMO SELL for Gold

by Erin Swenlin,
Vice President, DecisionPoint.com
Today all four Scoreboard indexes (NDX, INDU, SPX & OEX) logged new Short-Term Trend Model Neutral signals. These signals arrived when the 5-EMA crossed below the 20-EMA while the 20-EMA was above the 50-EMA. In addition, we saw a new PMO SELL signal on Gold. I've included the...
READ MORE
MEMBERS ONLY

STOCKS HAVE WORST DAY IN YEARS -- 50-DAY AVERAGES HAVE BEEN BROKEN -- S&P 500 APPEARS HEADED FOR RETEST OF RISING TRENDLINE EXTENDING BACK TO 2016 -- VIX DOUBLES TO HIGHEST LEVEL IN MORE THAN TWO YEARS -- LATE RALLY IN MAJOR STOCK INDEXES FADES

by John Murphy,
Chief Technical Analyst, StockCharts.com
S&P 500 FALLS BELOW 50-DAY AVERAGE... Stocks had a terrible day today. Major stock indexes in the U.S. lost about 4% in one day. And some chart damage was done. The daily bars in Chart 1 show the S&P 500 falling well below its 50-day...
READ MORE
MEMBERS ONLY

Palo Alto Holds above Breakout Zone
by Arthur Hill,
Chief Technical Strategist, TrendInvestorPro.com
The stock market was hit with hard selling pressure last week, but Palo Alto Networks (PANW) held up rather well and move below its breakout zone. Stocks that hold up best during a broad market correction are often the ones that lead on the rebound.
The chart shows PANW in...
READ MORE
MEMBERS ONLY

A few hundred points in the S&P 500.... Who cares?

by Julius de Kempenaer,
Senior Technical Analyst, StockCharts.com
The rough ride down in the markets last Friday was something that was probably expected by many but still came as a surprise. I am not a big fan of “calling tops”, or troughs for that matter. Mainly because many of these “predictions” have had many failed attempts to “call...
READ MORE
MEMBERS ONLY
Stocks Slammed, Futures Lower; Here's A Possible Support Level
by Tom Bowley,
Chief Market Strategist, EarningsBeats.com
Market Recap for Friday, February 2, 2018
It was an ugly day on Wall Street. In fact, it was the ugliest day on Wall Street since June 24, 2016, when the Dow Jones last fell more than 600 points. Friday's drop was 665 points and the technical damage...
READ MORE
MEMBERS ONLY

AAPL Pie

by Bruce Fraser,
Industry-leading "Wyckoffian"
Apple, Inc. has been an endlessly illuminating Wyckoff Method case study during this bull market advance. The ascension of AAPL demonstrates the power of large institutional sponsorship. The top echelon of this sponsorship is what Wyckoffians call the ‘Composite Operator’ (C.O.). The footprints of the C.O. can be...
READ MORE
MEMBERS ONLY
Bond Yields Climbing, Gaining on Stocks
by John Murphy,
Chief Technical Analyst, StockCharts.com
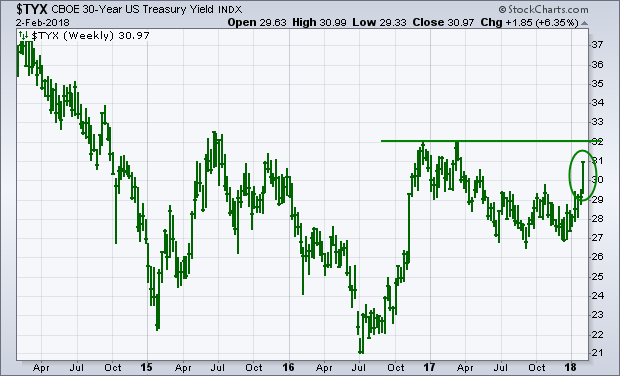
Bond yields are rising a lot faster than a lot of people expected. And that's starting to worry stock holders. The weekly bars in Chart 1 show the 30-Year Treasury Yield rising over 3.00% for the first time since last March and heading up for a challenge...
READ MORE
MEMBERS ONLY
Every Setback Presents Fresh Opportunities

by John Hopkins,
President and Co-founder, EarningsBeats.com
Traders who are "all in" on the long side hate days like this past Friday when the market got slammed big time, with the Dow down 2.6%, the NASDAQ down 2.1% and the S&P down 2%, the worst overall showing in two years. And...
READ MORE
MEMBERS ONLY
The NASDAQ 100 And Its Best Seasonal Candidates In February
by Tom Bowley,
Chief Market Strategist, EarningsBeats.com
Identifying The Candidates
I've included the month-by-month seasonal information for all NASDAQ 100 ($NDX) stocks in an Excel spreadsheet. In an effort to identify the best seasonal stocks on the NDX, I first considered the number of years history for each stock. For instance, I eliminated JD.com...
READ MORE
MEMBERS ONLY
Building a Rules-Based Trend Following Model - 4

by Greg Morris,
Veteran Technical Analyst, Investor, and Author
We have covered most of the preliminary issues such as digital measures and compound measures. This article will discuss the concept of Weight of the Evidence. I have been fond of a weight of the evidence approach for over 30 years. The concept of “weight of the evidence” came from...
READ MORE
MEMBERS ONLY

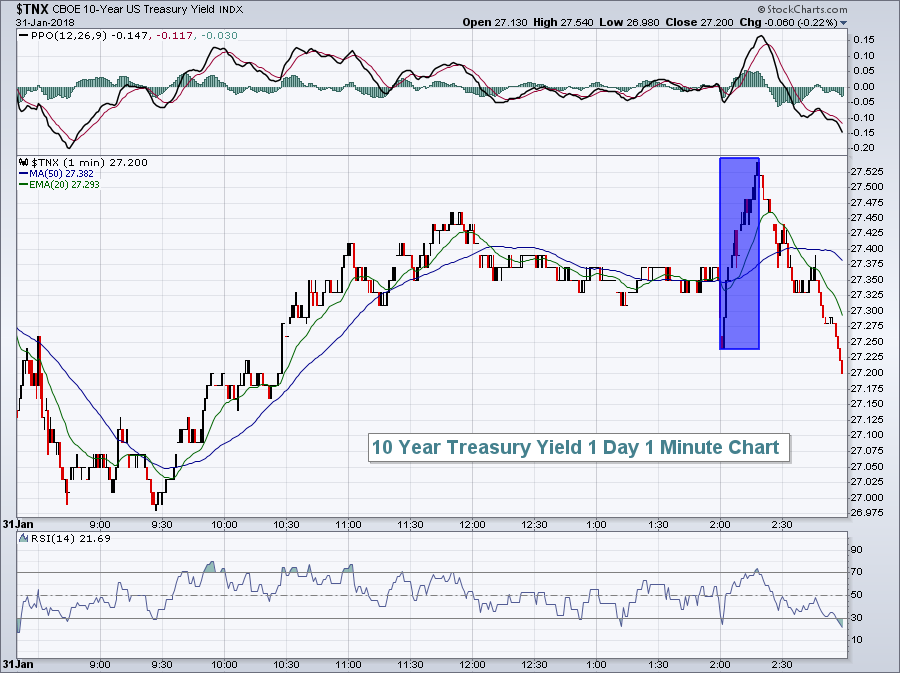
Long-term Treasury Yields Finally Play Catch Up
by Arthur Hill,
Chief Technical Strategist, TrendInvestorPro.com
Short-term Treasury yields have been moving sharply higher since September with the 5-yr and 2-yr yields hitting multi-year highs over the last few months. Yields at the long end of the curve are lagging, but appear to be catching up finally as the 10-yr yield broke out in January and...
READ MORE
MEMBERS ONLY
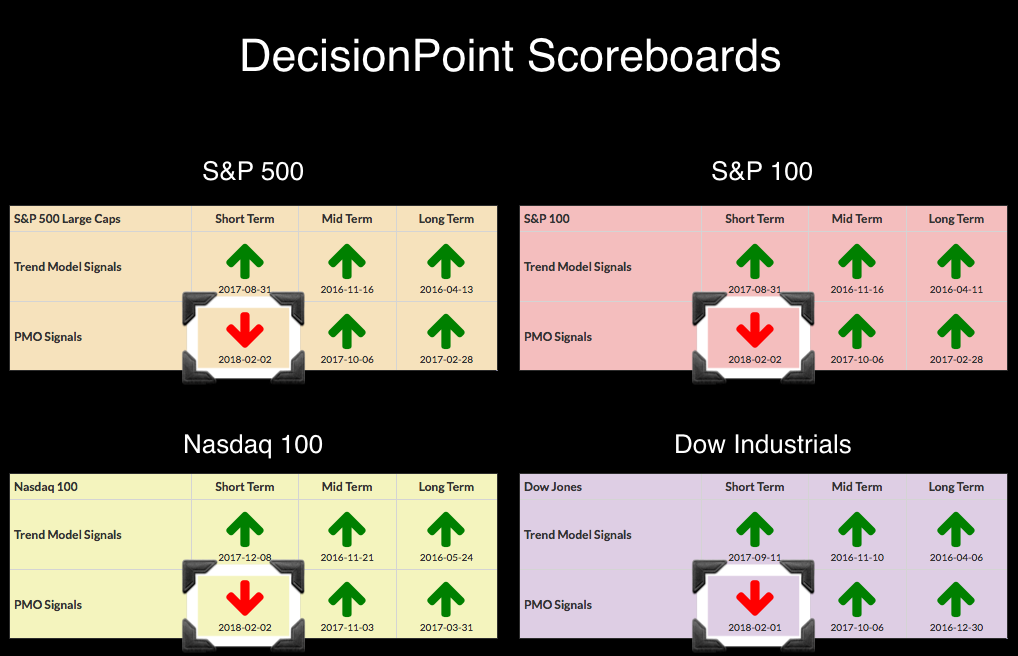
DecisionPoint Scoreboards Seeing Red, But ST Indicators Very Oversold Already
by Erin Swenlin,
Vice President, DecisionPoint.com
It's been nearly a month since we saw our last signal changes to the DecisionPoint Scoreboards, but with the pullback over the past week, momentum turned negative and now we are seeing new Price Momentum Oscillator (PMO) SELL signals on all four!
The Dow actually incurred its PMO...
READ MORE
MEMBERS ONLY
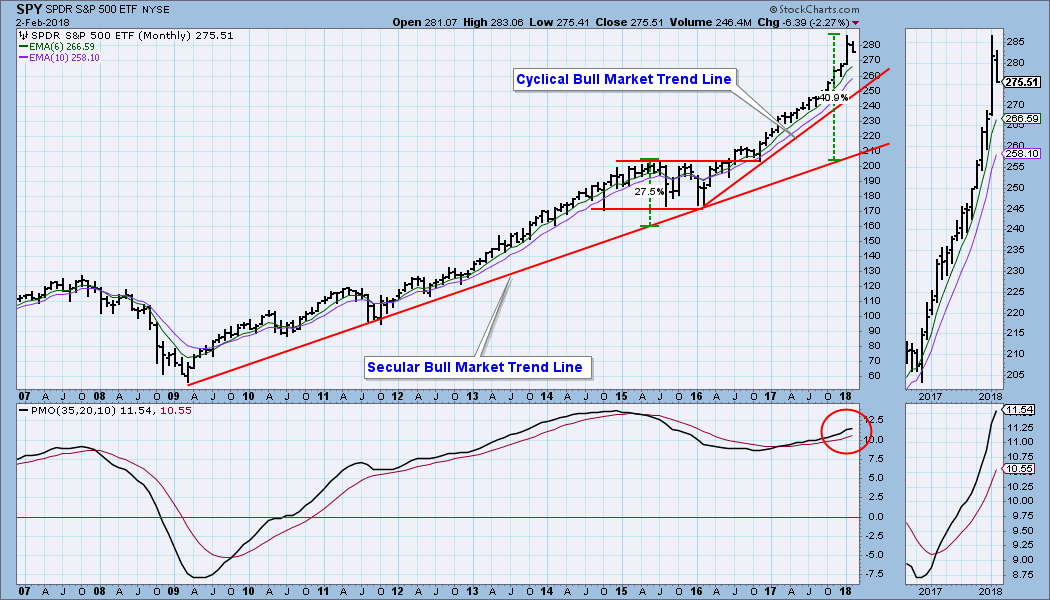
DP Weekly Wrap: Inadequate Correction

by Carl Swenlin,
President and Founder, DecisionPoint.com
Because the DP Weekly Wrap is a recap of the week just ended, I normally lead with a daily chart; however, since there is so much agony being expressed about this week's correction, I am leading with a monthly chart to try to put things in proper perspective....
READ MORE
MEMBERS ONLY

RISING BOND YIELDS ARE RATTLING STOCK HOLDERS -- TEN YEAR YIELD REACHES FOUR-YEAR HIGH -- BOND YIELDS ARE RISING FASTER THAN STOCKS FOR THE FIRST TIME SINCE THE BULL MARKET STARTED -- THE VIX INDEX SURGES TO FIFTEEN-MONTH HIGH
by John Murphy,
Chief Technical Analyst, StockCharts.com
BOND YIELDS ARE CLIMBING ... Bond yields are rising a lot faster than a lot of people expected. And that's starting to worry stock holders. The weekly bars in Chart 1 show the 30-Year Treasury Yield rising over 3.00% for the first time since last March and heading...
READ MORE
MEMBERS ONLY

Weekly Market Review & Outlook (with Video) - Disconnects Could Raise the VIX Range
by Arthur Hill,
Chief Technical Strategist, TrendInvestorPro.com
* Turn of the Month Turns Negative.
* SPY Holds the Gap.
* Is the VIX Returning to Normal?.
* S&P 500 Correction Targets.
* Watching for Oversold Breadth.
* IBB Corrects from New High.
* Gold Maintains Upswing as Dollar Falls.
* Notes from the Art's Charts ChartList.
* Videos with Interesting Takes.
Turn...
READ MORE
MEMBERS ONLY
AAPL, AMZN And GOOGL Report Results; Futures Tumble
by Tom Bowley,
Chief Market Strategist, EarningsBeats.com
Market Recap for Thursday, February 1, 2018
We saw a lot of bifurcation in the market on Thursday. The more aggressive NASDAQ and Russell 2000 rebounded and finished in positive territory, while both the Dow Jones and S&P 500 fell on the session. Four sectors finished higher, while...
READ MORE
MEMBERS ONLY

Market Roundup With Martin Pring 2018-02-01

by Martin Pring,
President, Pring Research
* Big changes in all four areas
* Equities
* Commodities
* Currencies
* Bonds
This months market roundup has a lot of charts that are breaking out on long term relative strength breakouts.
Market Roundup With Martin Pring 2018-02-01 from StockCharts.com on Vimeo.
Chartcon 2018 registration is now open! Registration kicked off today,...
READ MORE
MEMBERS ONLY
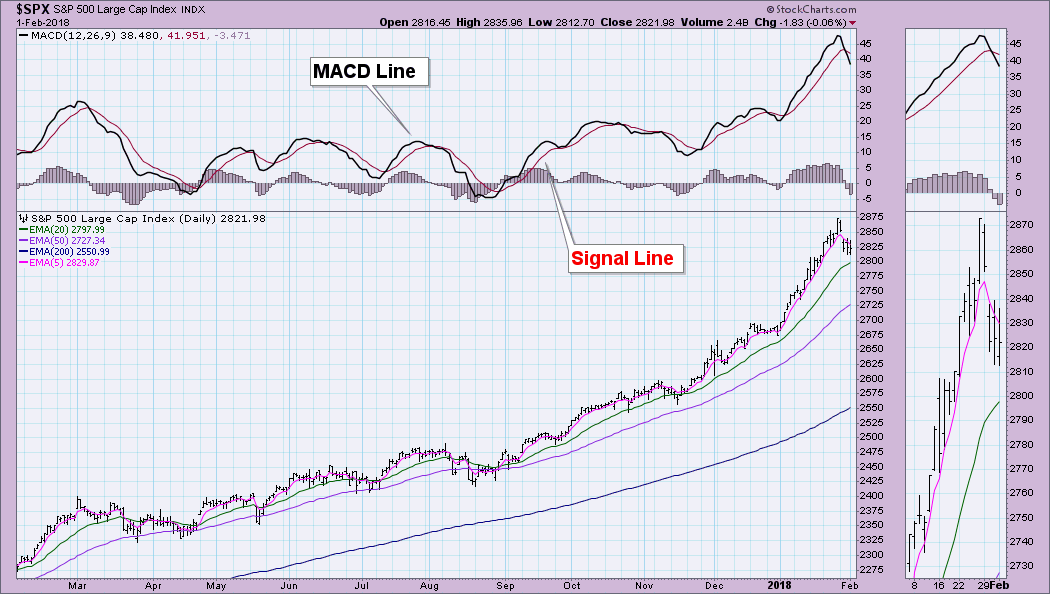
What's the Difference Between the PMO (Price Momentum Oscillator) and MACD/PPO?
by Erin Swenlin,
Vice President, DecisionPoint.com
I am often asked first, "What's the difference between the PMO and the MACD (or PPO)?" which is usually followed by, "Why do you prefer the PMO?". I'll answer the second question right now. As a mother loves her child, so do...
READ MORE
MEMBERS ONLY

Pause In An Ongoing Uptrend?
by Martin Pring,
President, Pring Research
* The underlying trend of improving confidence continues
* Several indicators are pointing to some kind of a correction
* Small caps are lagging
The underlying trend of improving confidence continues
The longer-term indicators monitoring the primary trend of the US stock market continue to point north. So too, do the various confidence...
READ MORE
MEMBERS ONLY
U.S. Equities Bounce; Small Caps Face Stiff Test
by Tom Bowley,
Chief Market Strategist, EarningsBeats.com
Market Recap for Wednesday, January 31, 2018
Following the heavy selling on Tuesday, the bulls were just hoping to stop the bleeding. I'd say they had some success as the Dow Jones, S&P 500 and NASDAQ all finished in positive territory. Overall action was bifurcated, however,...
READ MORE
MEMBERS ONLY

The First Step to Picking Stocks is Not Picking Stocks (with Complete Scan Code and Two Stocks)
by Arthur Hill,
Chief Technical Strategist, TrendInvestorPro.com
* Filter Group 1: General Symbol Conditions.
* Scanning Specific Indexes.
* Filter Group 2: Broad Technical Conditions.
* Cutting to the Chase with Indexes.
* Eliminating a Sector or Industry Group.
* Filter Group 3: Technical Signals.
* Wendy's and Micron Make the Cut.
* Conclusions and Complete Scan Code.
Chartists use scans to narrow...
READ MORE
MEMBERS ONLY

AVERAGE DIRECTIONAL INDEX SHOWS AN OVERBOUGHT MARKET IN NEED OF A BREATHER -- THE LAST 5% PULLBACK IN STOCKS WAS FIFTEEN MONTHS AGO -- CONTRACTING BOLLINGER BANDS ALSO HINT AT SOME WEAKENING IN THE MARKET'S SHORT-TERM UPTREND
by John Murphy,
Chief Technical Analyst, StockCharts.com
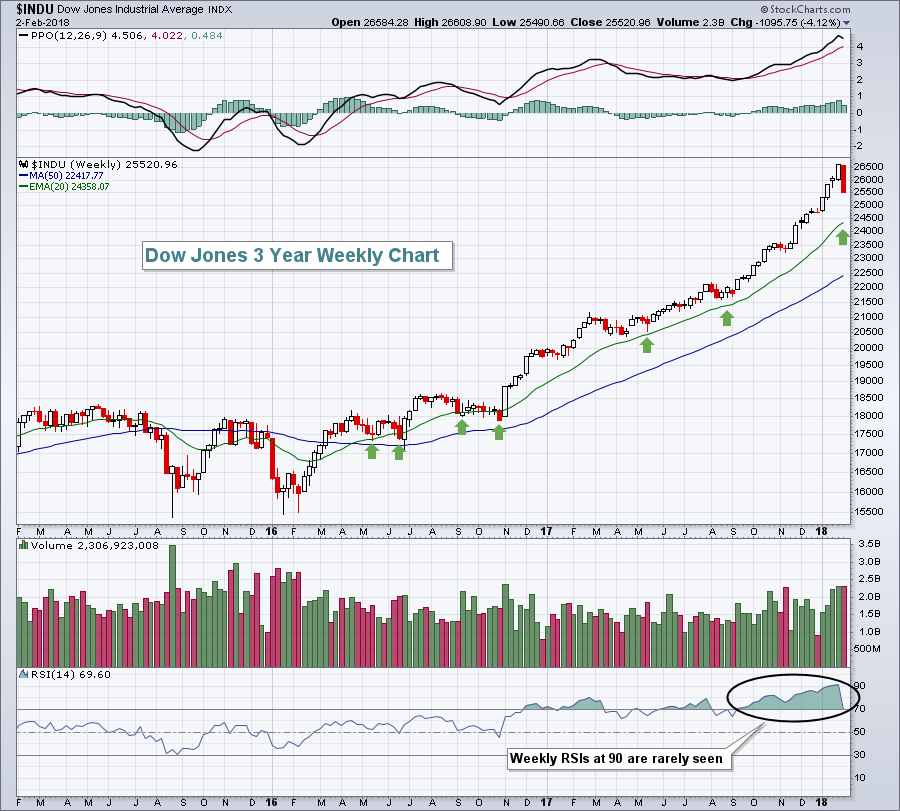
S&P 500 IS DUE FOR A PAUSE ... There are a number of ways to tell when a market is stretched too far. My January 6 message pointed out that the 14-month RSI for the S&P 500 was the most overbought since the late 1990s (twenty years...
READ MORE
MEMBERS ONLY

More Bad News Ahead for CBS?
by Arthur Hill,
Chief Technical Strategist, TrendInvestorPro.com
The chart for CBS Corp (CBS) is already bad news and the news could get even worse.
First and foremost, the long-term trend is clearly down as the stock hit a 52-week low in early November and remains below the falling 200-day SMA. The stock also broke below the May-June...
READ MORE
MEMBERS ONLY
Sellers Stampede Wall Street; Dow Jones Tumbles 362 Points
by Tom Bowley,
Chief Market Strategist, EarningsBeats.com
Market Recap for Tuesday, January 30, 2018
This day was a long time coming. The U.S. stock market's uninterrupted surge to record all-time highs day after day, week after week and month after month needed a break. It needed relief. Yesterday that relief was found....and it...
READ MORE
MEMBERS ONLY
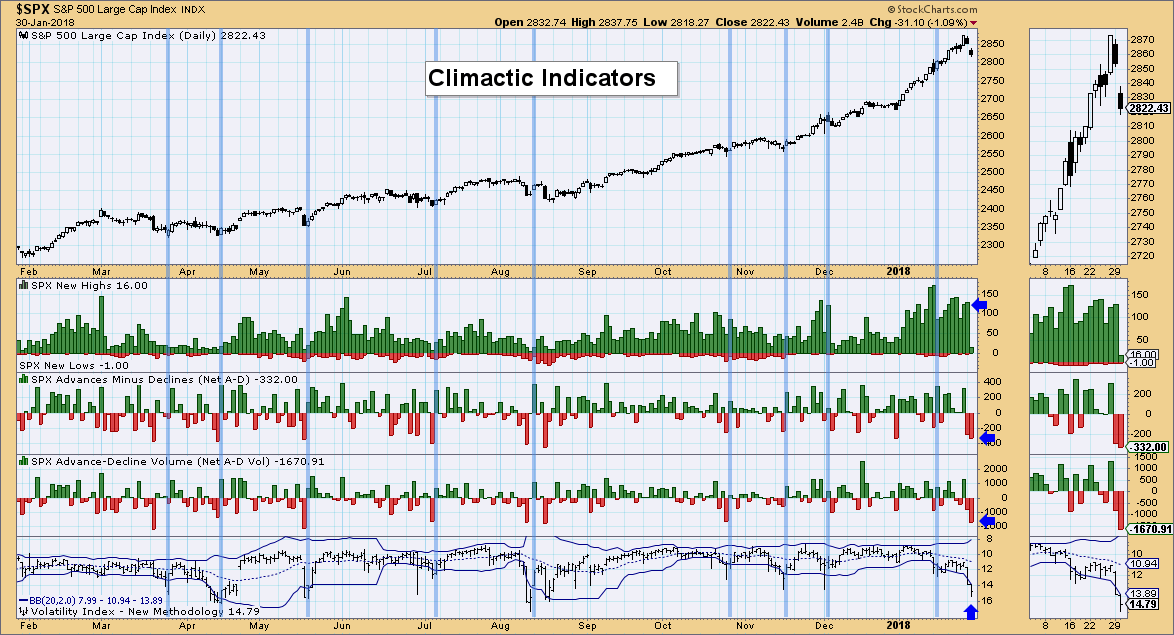
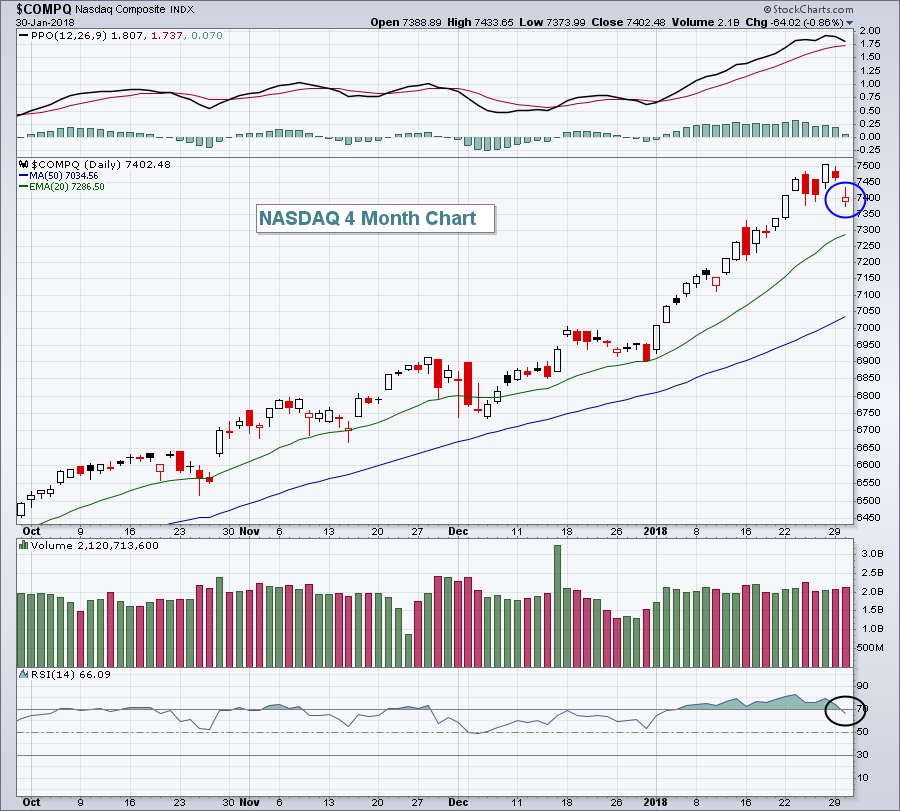
$VIX Flying High, This Has Bullish Implications
by Erin Swenlin,
Vice President, DecisionPoint.com
One chart that I have been watching very closely is the DecisionPoint Climactic Indicator chart. I use this chart to give me an idea of very short-term sentiment and how to use it to determine possible tops and bottoms. Today I'm seeing some extremes that could be telling...
READ MORE
MEMBERS ONLY

This Is Personal: My Very Own ChartList Organization

by Grayson Roze,
Chief Strategist, StockCharts.com
The other morning, I joined Tom Bowley and Erin Swenlin on their daily MarketWatchers LIVE web show. My appearance was part of the weekly "Everything StockCharts" segment, which covers important tips, tricks and other information that all StockCharts users can benefit from.
The show got a little, well....
READ MORE
MEMBERS ONLY
Apple Tests Major Support As Its Earnings Report Nears
by Tom Bowley,
Chief Market Strategist, EarningsBeats.com
Market Recap for Monday, January 29, 2018
We saw something different in the U.S. stock market on Monday. We closed in negative territory on all of our major indices and we closed at or near lows for the day. There was little or no bargain hunting at the end...
READ MORE
MEMBERS ONLY

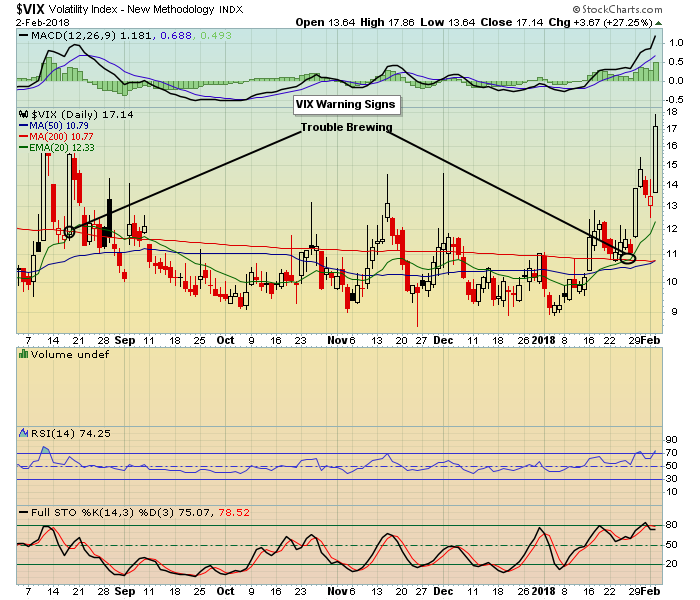
The VIX Flashes a Warning Sign as More Industry Groups Correct
by Arthur Hill,
Chief Technical Strategist, TrendInvestorPro.com
* VIX Disconnnet Signals Caution.
* Charting Past Occurrences.
* Correction Targets for the S&P 500.
* More Industry Groups Join Correction.
* 3 Semiconductor Stocks to Watch.
VIX Disconnet Signals Caution
The S&P 500 Volatility Index ($VIX) usually moves opposite the S&P 500, but this is not the...
READ MORE
MEMBERS ONLY
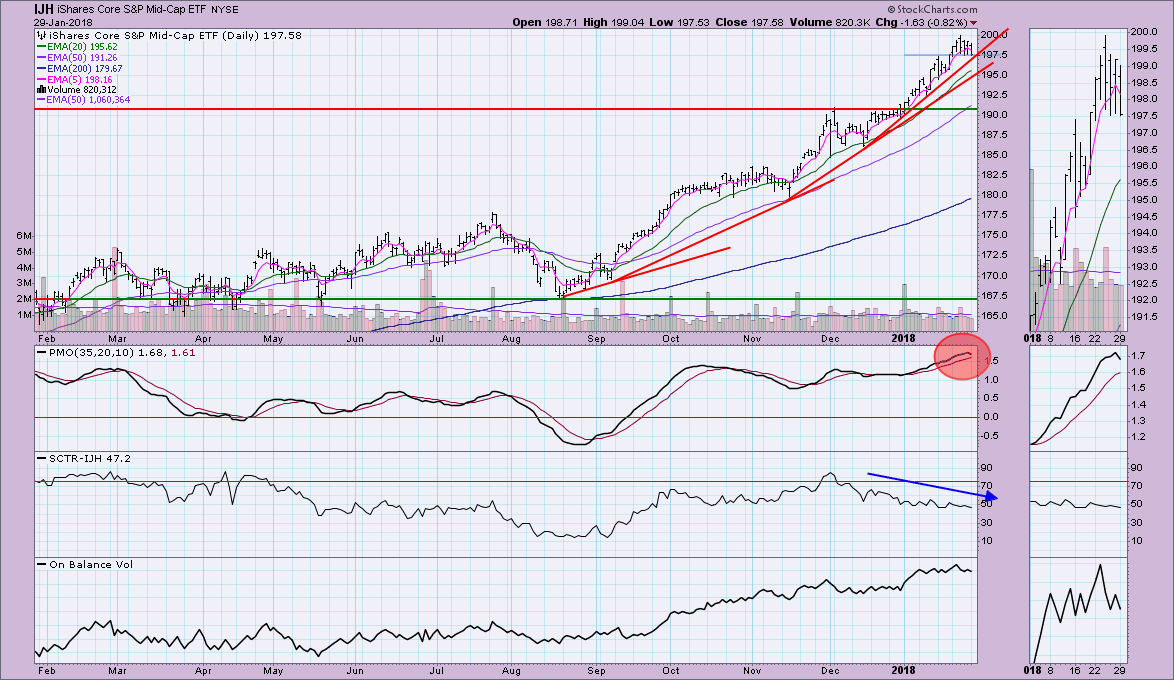
Mid-Cap and Small-Cap ETFs Deteriorating (IJH & IJR)
by Erin Swenlin,
Vice President, DecisionPoint.com
It is very tough to find weakness in the major indexes as they continue to fly higher. However, I was reviewing my DecisionPoint LIVE ChartList and noted that we are seeing a few warning signs on the small and mid-cap ETFs, IJR and IJH.
Currently, both IJH and IJR have...
READ MORE
MEMBERS ONLY

NCLH Cruises towards New Highs
by Arthur Hill,
Chief Technical Strategist, TrendInvestorPro.com
Norwegian Cruise Line (NCLH) broke out of a long consolidation and looks poised to hit new highs soon. The long-term trend is up as the stock surged to new highs with a 50+ percent advance from November 2016 to August 2017. Also note that the PPO(50,200,0) is...
READ MORE
MEMBERS ONLY
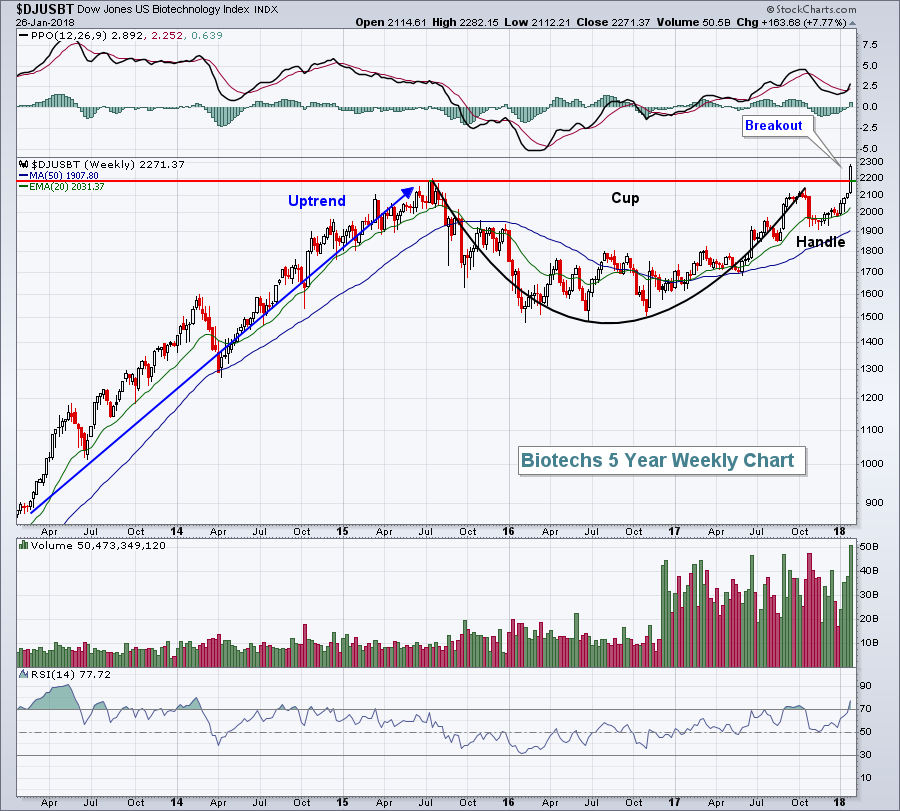
Bulls Stomp On The Gas, Biotechs Explode
by Tom Bowley,
Chief Market Strategist, EarningsBeats.com
Market Recap for Friday, January 26, 2018
The bears were absolutely stymied on Friday as the major indices surged to unprecedented levels. Despite the very overbought conditions that have persisted on many indices for four months now, bulls dominated the action and show no signs of letting up. When you...
READ MORE
MEMBERS ONLY

Building a Rules-Based Trend Following Model - 3
by Greg Morris,
Veteran Technical Analyst, Investor, and Author
We are still in the preliminary stages of defining tools that will be used in the rules-based trend following model. Here I want to explain a unique concept I call Compound Digital Measures. They are an advanced form of the Digital Measures discussed in the BaR-BTFM – 2 (Building a Rules-Based...
READ MORE
MEMBERS ONLY
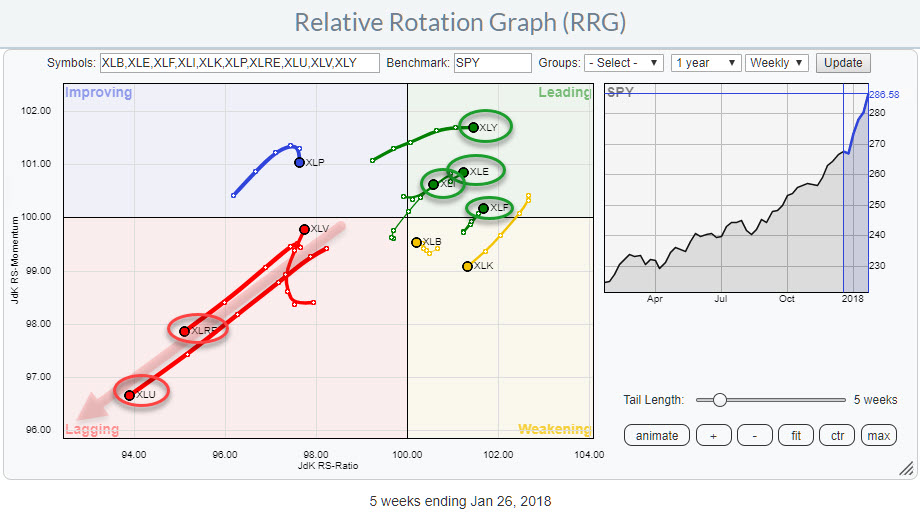
Relative Rotation Graphs are sending a clear message for Real-Estate (XLRE) and Utilities (XLU)
by Julius de Kempenaer,
Senior Technical Analyst, StockCharts.com
The Relative Rotation Graph shows the positions of US sectors against SPY as of 26 Jan. Sometimes the rotational patterns are not so clear but in this example, there is one observation sending a screaming message:
Avoid Real-Estate and Utilities.
At the other end of the spectrum inside the leading...
READ MORE
MEMBERS ONLY

CRB COMMODITY INDEX ACHIEVES A BULLISH BREAKOUT BY REACHING A TWO-YEAR HIGH -- THAT HELPED PUSH THE TEN-YEAR TREASURY YIELD TO THE HIGHEST LEVEL IN THREE YEARS -- SO DID THE FACT THAT GERMAN AND AND BRITISH YIELDS TURNED UP THIS WEEK
by John Murphy,
Chief Technical Analyst, StockCharts.com
CRB INDEX ACHIEVES BULLISH BREAKOUT ... A couple of messages during the week showed the Bloomberg Commodity Index nearing a two-year high. It broke through those highs during the week. Today's message shows the more widely-followed Reuters/Jefferies CRB Index accomplishing a bullish breakout of its own by rising...
READ MORE
MEMBERS ONLY
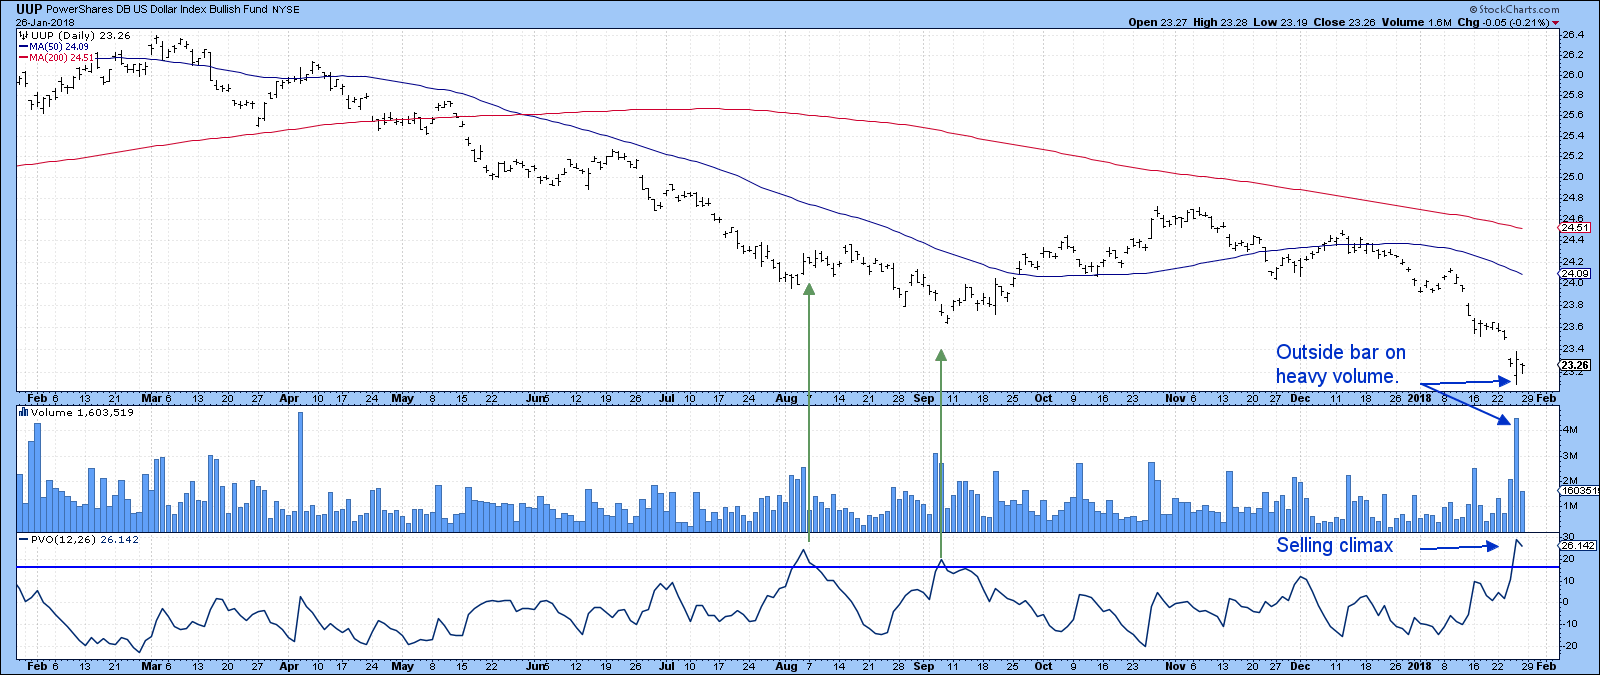
Dollar Bear Market Is Not A One Way Street
by Martin Pring,
President, Pring Research
* Dollar experiences a short-term reversal
* Commodities are in a bull market but adversely affected near-term
* Gold showing signs of tiredness but still within a base building process
Dollar experiences a short-term reversal
It’s a funny thing in markets, when you have just grown comfortable with a move, it sometimes...
READ MORE
MEMBERS ONLY

Inflation Incubation
by Bruce Fraser,
Industry-leading "Wyckoffian"
Our resident Intermarket and Business Cycle experts, John Murphy and Martin Pring, have done a masterful job of evaluating the recent emergence of commodity prices. One proxy for commodity prices, the Commodity Research Bureau Index ($CRB), has come to life after a decade long downtrend. Is this evidence of an...
READ MORE
MEMBERS ONLY
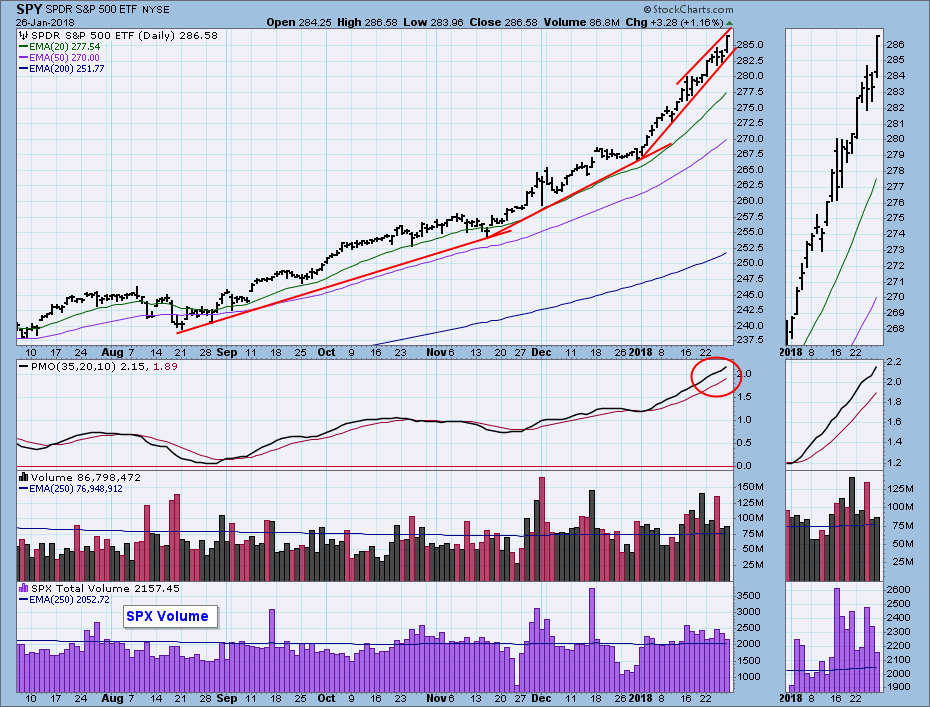
DP Weekly Wrap: Market Pumps; Dollar Dumps
by Carl Swenlin,
President and Founder, DecisionPoint.com
This week the market underwent a horrifying intraday reversal. Just kidding. There was a surprising reversal on Wednesday, but by the close SPY was virtually unchanged. We can see on the chart that at the intraday low the steep January rising trend line was barely tested. And in the context...
READ MORE
MEMBERS ONLY

HEALTHCARE SPDR HITS NEW RECORD AND IS PLAYING CATCH-UP TO THE REST OF THE MARKET -- AMGEN AND BIOGEN LEAD BIOTECH ISHARES HIGHER -- ABBVIE EXPLODES TO NEW RECORD AND HELPS BOOST PHARMACEUTICAL ETF TO HIGHEST LEVEL IN TWO YEARS
by John Murphy,
Chief Technical Analyst, StockCharts.com
HEALTHCARE SECTOR IS PLAYING CATCH-UP ... Healthcare stocks are off to a good start for the new year, and are one of the market's strongest sectors. That's a big change from the past three years when healthcare was one of the markets weakest laggards. That's...
READ MORE