MEMBERS ONLY

Weekly Market Review & Outlook - As Boring as Boring Gets

by Arthur Hill,
Chief Technical Strategist, TrendInvestorPro.com
* New Highs in Major index ETFs (again).
* SPY: As Boring as Boring Gets.
* Materials SPDR Breaks Out of Bullish Pennant.
* REIT SPDR Springs a Bear Trap.
* XLI Forms Bullish Pennant.
* Some Groups are Already Correcting.
* ITB, IYT and SOXX Move into Corrective Mode.
* TLT Holds Neckline Support (for now).
* Oil...
READ MORE
MEMBERS ONLY
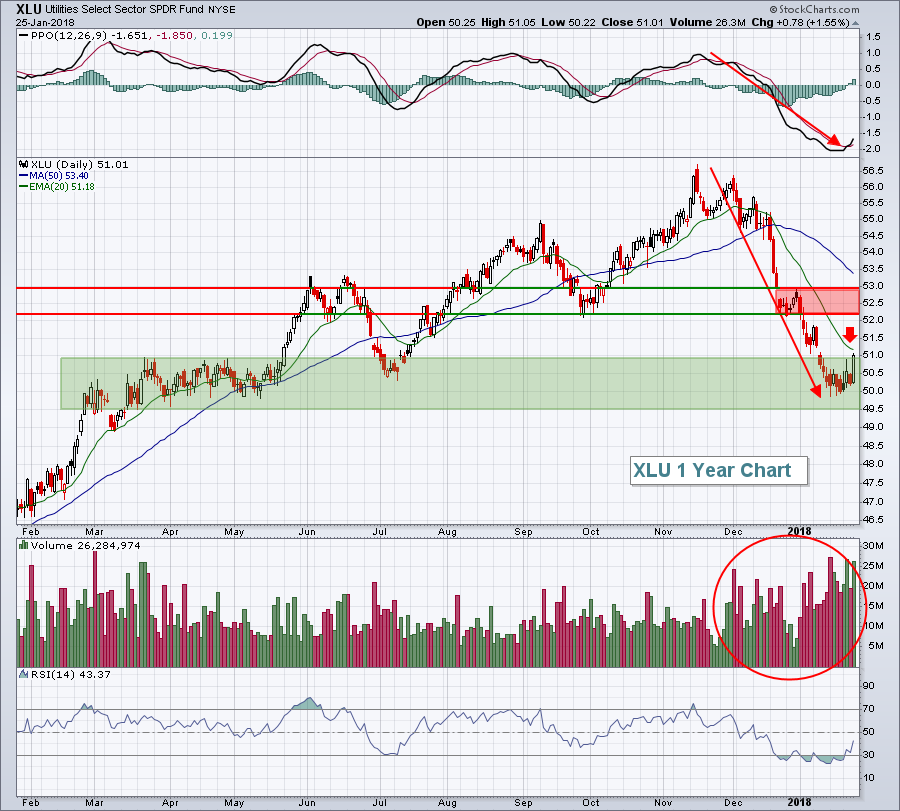
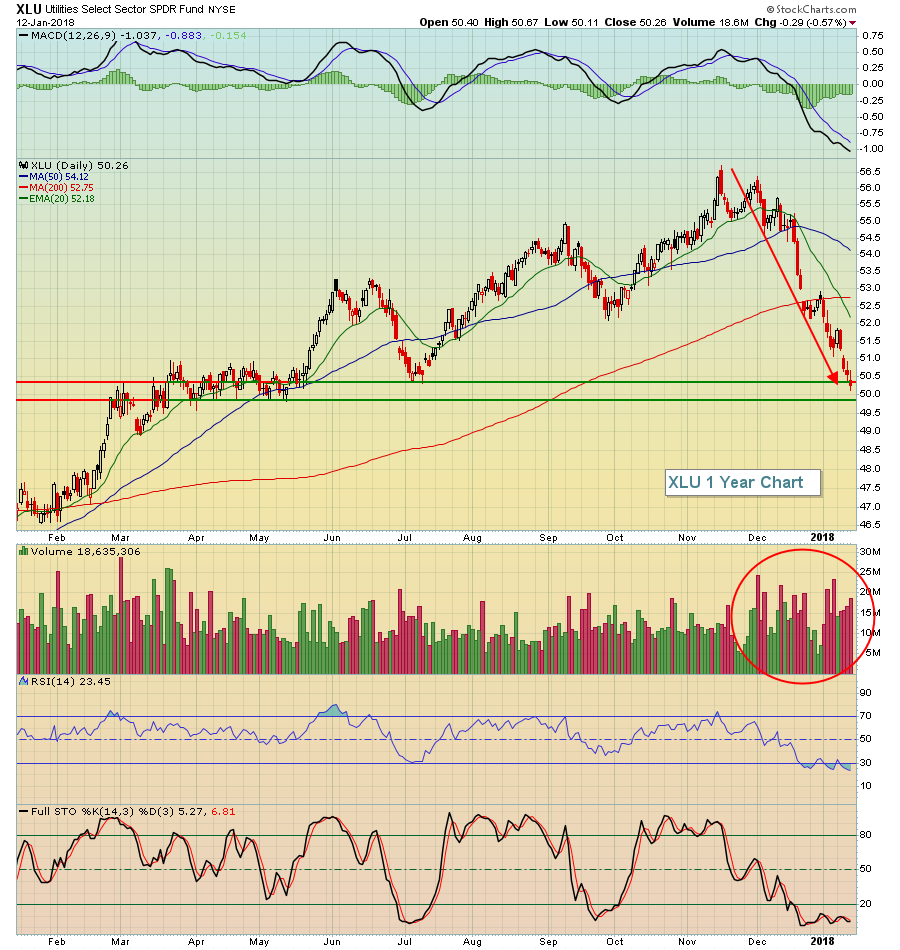
Utilities Rebound; Dow Jones Sets Fresh Record

by Tom Bowley,
Chief Market Strategist, EarningsBeats.com
Market Recap for Thursday, January 25, 2018
Utilities (XLU, +1.55%) easily enjoyed its best day of 2018 on Thursday as significant price support, combined with falling treasury yields, triggered an explosive move higher as buyers could not get enough of the beaten-down sector. Here's the chart:
The...
READ MORE
MEMBERS ONLY
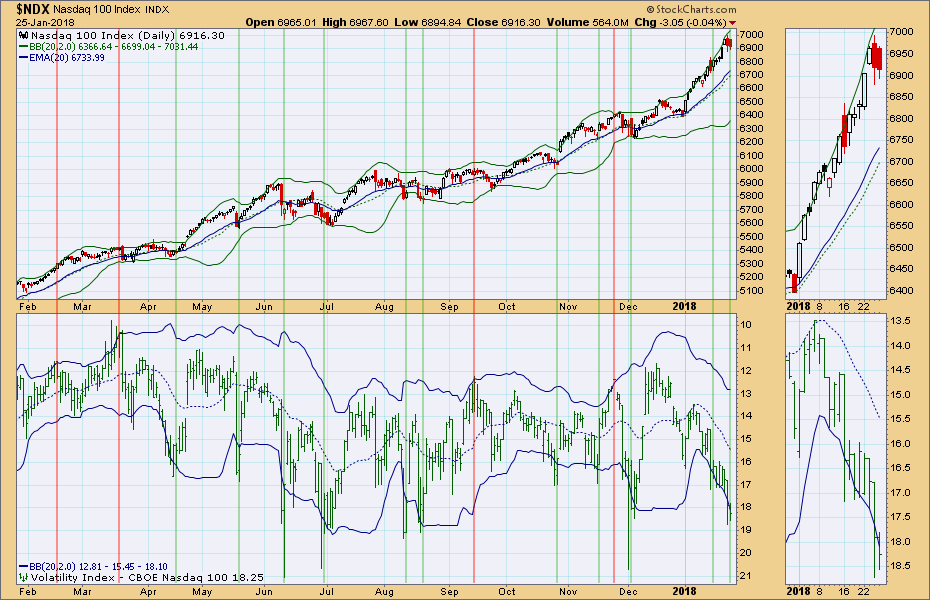
Volatility Indexes for NDX ($VXN) and Gold ($GVZ) Suggest Rally Pop Ahead

by Erin Swenlin,
Vice President, DecisionPoint.com
Many of you may not be aware, but DecisionPoint has charts for most of the volatility indexes in the DecisionPoint Market Indicator ChartPack. We're in the process of updating the ChartPack, but there's no reason you can't download it now and enjoy the plethora...
READ MORE
MEMBERS ONLY

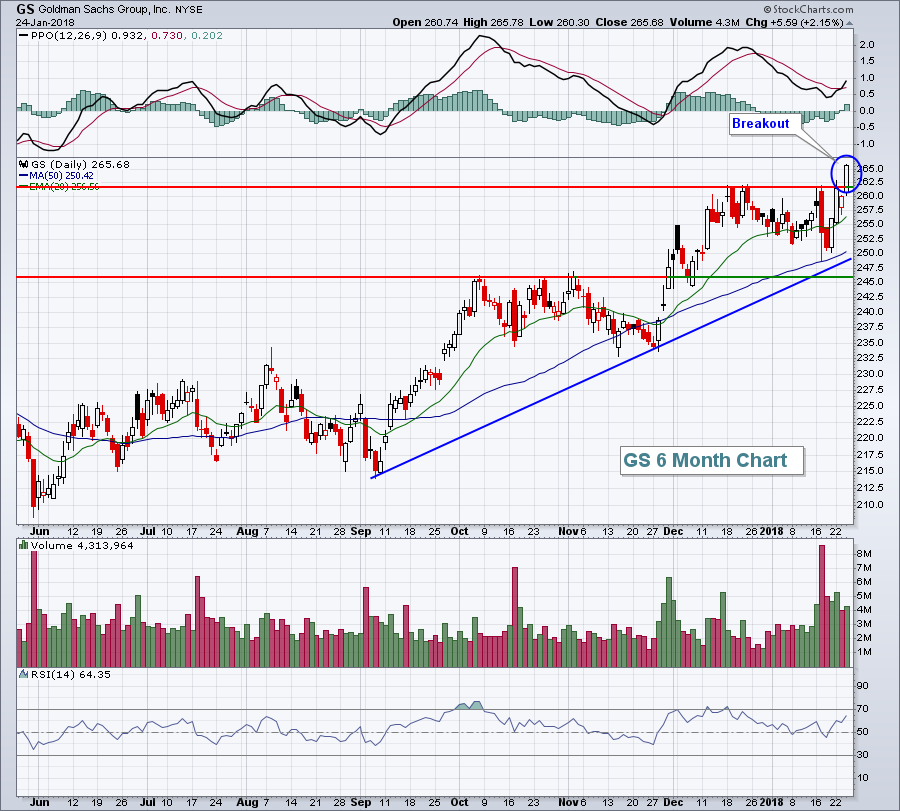
Finding Stocks with Good Chances of Hitting New Highs
by Arthur Hill,
Chief Technical Strategist, TrendInvestorPro.com
* Looking for Future 52-week Highs.
* 3 Stocks with Corrections after 52-week Highs.
* Goldman Sachs Surges to a New High.
* Two Materials Stocks with Recent Upturns.
Looking for Future 52-week Highs
Stocks in long-term uptrends are more likely to hit 52-week highs than stocks in downtrends. Furthermore, stocks that hit 52-week...
READ MORE
MEMBERS ONLY
Strength In Banks And Insurance Lead Bifurcated Market
by Tom Bowley,
Chief Market Strategist, EarningsBeats.com
Market Recap for Wednesday, January 24, 2018
Only the Dow Jones was able to end Wednesday's session in positive territory, but all of our major indices remain very strong with accelerating bullish price momentum. Sectors and industries have taken their turns leading U.S. stocks higher and yesterday...
READ MORE
MEMBERS ONLY

DP Alert: Bull Flag Executes on USO! New Upside Target
by Erin Swenlin,
Vice President, DecisionPoint.com
The DecisionPoint Scoreboards remain green as momentum is positive and price trends continue higher in this seemingly unending bull market rally. I'm seeing a few cracks in the pavement right now in the short-term indicators with a negative divergence between breadth and volume. USO began executing a bull...
READ MORE
MEMBERS ONLY

TREASURY SECRETARY TALKS DOWN THE DOLLAR WHICH DROPS SHARPLY -- BRITISH POUND SURGES AGAINST THE DOLLAR -- WHILE BRITISH BOND YIELD RISES TO HIGHEST LEVEL IN A YEAR -- BIG DROP IN DOLLAR PUSHES BLOOMBERG COMMODITY INDEX NEAR A TWO-YEAR HIGH

by John Murphy,
Chief Technical Analyst, StockCharts.com
BRITISH POUND RISES WITH UK BOND YIELDS ... It's now official that the U.S. government wants a weaker dollar. Speaking in Switzerland, Treasury Secretary Mnuchin stated that a weak dollar is good for the U.S. economy, and would help reduce the U.S. trade deficit. That'...
READ MORE
MEMBERS ONLY
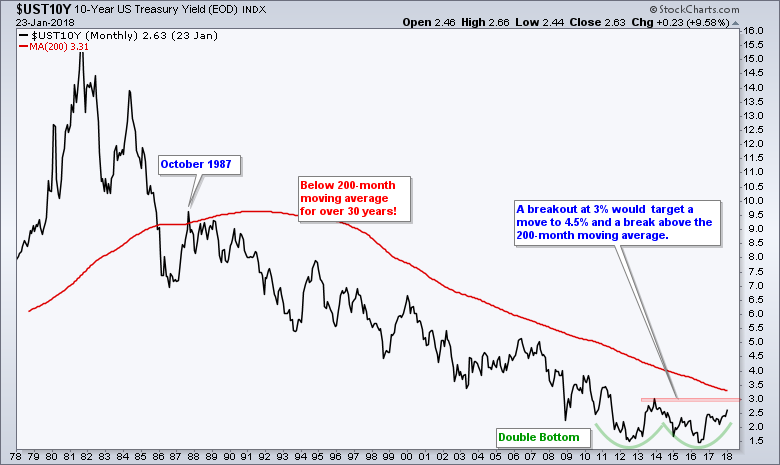
The Mother of All Reversals is Building in the Bond Market
by Arthur Hill,
Chief Technical Strategist, TrendInvestorPro.com
The 10-year Treasury Yield peaked near 16% in 1982 and fell as a secular bear market took hold for over 30 years. After stabilizing the last few years, the 10-year Yield traced out a large bullish reversal pattern and confirmation would end the secular bear market.
Note that the 10-yr...
READ MORE
MEMBERS ONLY
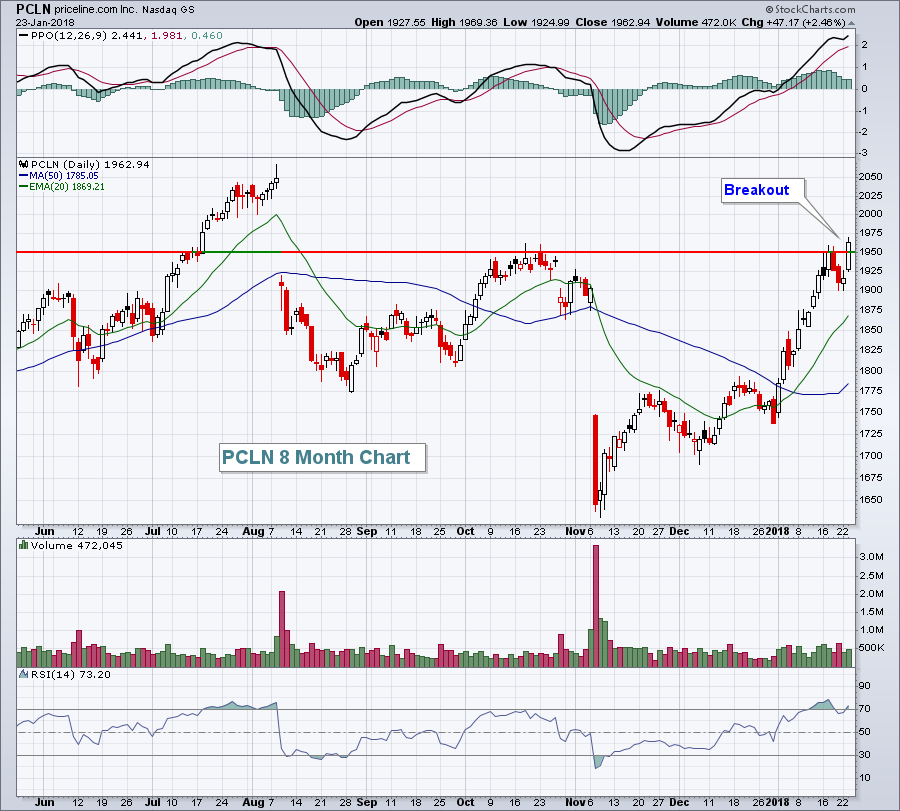
Utilities Lead As Market Rally Pauses; PCLN breaks out
by Tom Bowley,
Chief Market Strategist, EarningsBeats.com
Market Recap for Tuesday, January 23, 2018
The tech-laden NASDAQ powered forward to new all-time highs on Friday, closing above 7400 for a second consecutive session and now approaching 7500. All of our major indices ended higher, except for the Dow Jones, which saw a last minute bout of selling...
READ MORE
MEMBERS ONLY
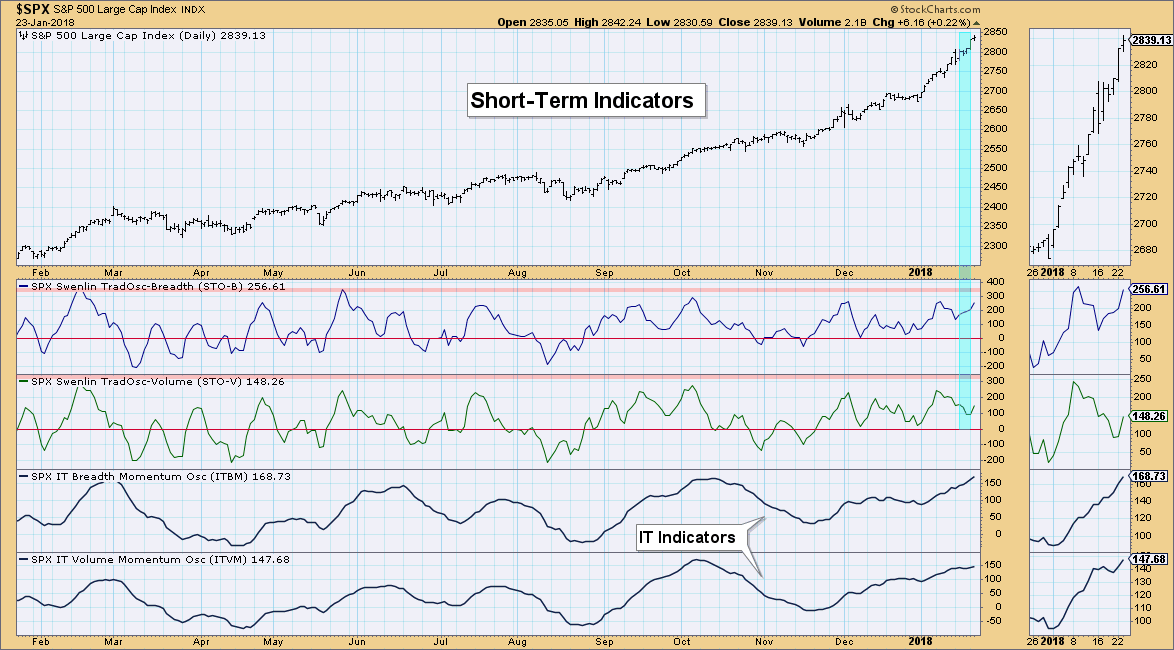
Near-Term Divergence Ends Between Swenlin Trading Oscillators (STOs), Intermediate Term Remains
by Erin Swenlin,
Vice President, DecisionPoint.com
On Monday's MarketWatchers LIVE program during the "DecisionPoint Report", I highlighted a divergence between the Swenlin Trading Oscillators (STOs). I admitted that I hadn't seen a divergence lasting over a day or two. These are short-term indicators that generally travel in concert. The difference...
READ MORE
MEMBERS ONLY

FALLING DOLLAR PUSHES BLOOMBERG COMMODITY INDEX TO ELEVEN MONTH HIGH -- GOLD NEARS ANOTHER FOUR-MONTH HIGH -- A WEAK DOLLAR ALSO FAVORS LARGE CAPS OVER SMALLER STOCKS -- S&P BIOTECH SPDR REACHES NEW RECORD
by John Murphy,
Chief Technical Analyst, StockCharts.com
DOLLAR CONTINUES TO WEAKEN AS FOREIGN CURRENCIES RISE... Chart 1 shows the PowerShares Dollar Index (UUP) falling today to the lowest level in three years. The dollar is losing ground against virtually all major foreign currencies. Most of the upward movement in the UUP is coming from buying of the...
READ MORE
MEMBERS ONLY
Energy Soars But Its Relative Strength Might Surprise You
by Tom Bowley,
Chief Market Strategist, EarningsBeats.com
Market Recap for Monday, January 22, 2018
There was a lot of good things happening on Monday. First of all, one of the worst days historically has been the Monday after options expiration Friday. That historical weakness never materialized yesterday as all of our major indices trended up throughout the...
READ MORE
MEMBERS ONLY
Biotech and Finance-Related ETFs Lead as SPY Extends Extraordinary Run
by Arthur Hill,
Chief Technical Strategist, TrendInvestorPro.com
* SPY Extends Extraordinary Run.
* Biotech ETFs Lead Healthcare Sector.
* Finance-Related ETFs Extend Breakouts.
* Copper ETN Pulls Back within Trend.
* Is Telecom Turning the Corner?
SPY Extends Extraordinary Run
The major index ETFs remain in strong uptrends, both short-term and long-term. The S&P 500 SPDR and Dow SPDR are...
READ MORE
MEMBERS ONLY

Confidence Is Breaking Out All Over

by Martin Pring,
President, Pring Research
* Last week’s bearish dark cloud cover fails
* These confidence ratios are breaking to the upside and that’s bullish for stocks
Last week’s bearish dark cloud cover fails
Last week I pointed out that many of the principal indexes had traced out bearish dark cloud cover candlestick patterns....
READ MORE
MEMBERS ONLY
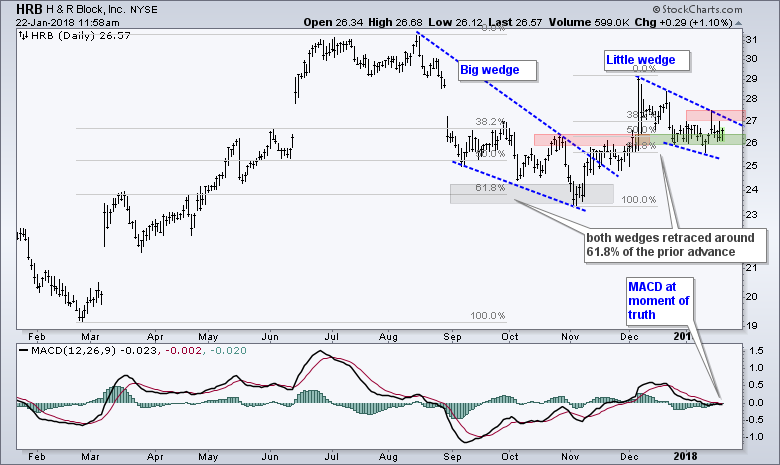
H&R Block Tests its Breakout Zone
by Arthur Hill,
Chief Technical Strategist, TrendInvestorPro.com
The chart for H&R Block (HRB) shows two corrective patterns, one confirmed and one working. First, HRB retraced around 61.8% of the February-August advance and formed A big wedge. The wedge pattern and the retracement amount are typical for corrections after a sharp advance. HRB broke out...
READ MORE
MEMBERS ONLY

Did 2017 Meet Your Expectations?

by Greg Morris,
Veteran Technical Analyst, Investor, and Author
Welcome to 2018! I was born in the 1940s and am delighted to be here. If you were a trend follower with reasonable stop placement, 2017 was a fabulous year. If you were a buy and hold investor in most stocks, then 2017 was a fabulous year. If you were...
READ MORE
MEMBERS ONLY
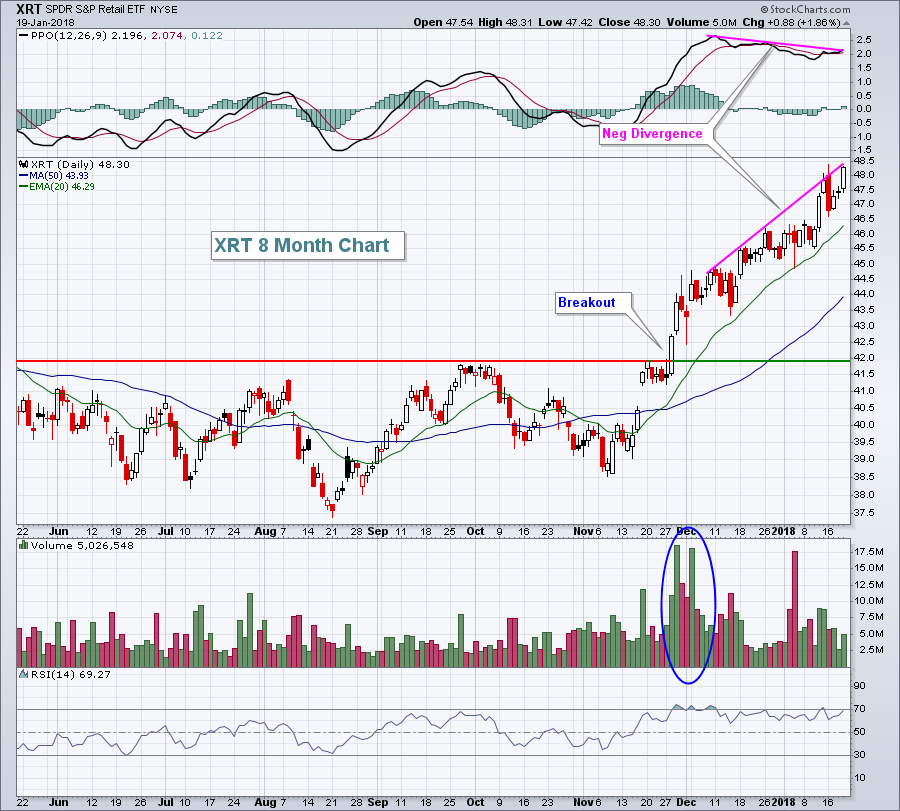
Retail Jumps Again, Leads U.S. Stocks To More Record Highs
by Tom Bowley,
Chief Market Strategist, EarningsBeats.com
Market Recap for Friday, January 19, 2018
Strength resumed on Friday, with three of our four major indices closing at record highs. Only the Dow Jones managed to come up short as losses in Dow components IBM, General Electric (GE) and American Express (AXP) held back the index, although it...
READ MORE
MEMBERS ONLY

Swing Trading Case Study

by Bruce Fraser,
Industry-leading "Wyckoffian"
2017 was the year of the ‘Uni-Market’ where leading stocks, industry groups and indexes marched higher from start to finish. Many important stocks got into a lockstep trend beginning in 2016. Two-Way markets are more common and we should see more of this in 2018. Markets are typically a cacophony...
READ MORE
MEMBERS ONLY
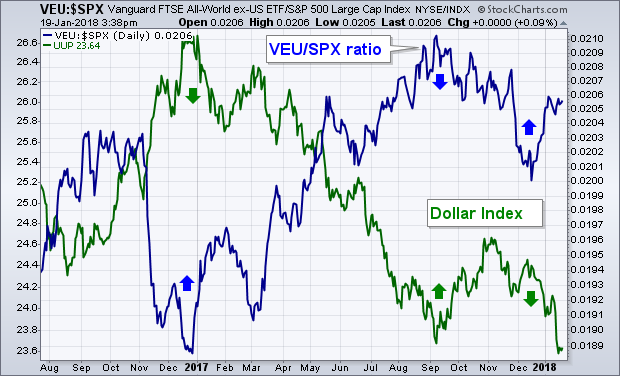
Falling Dollar Favors Foreign Stocks, EU Stock ETFs Benefit From Stronger Currencies
by John Murphy,
Chief Technical Analyst, StockCharts.com
The direction of currency markets tells us a lot about the relative strength (or weakness) of global markets. As a rule, stronger economies have stronger currencies, while weaker economies have weaker currencies. As a result, the direction of the U.S. dollar tells us whether to favor U.S. stocks...
READ MORE
MEMBERS ONLY
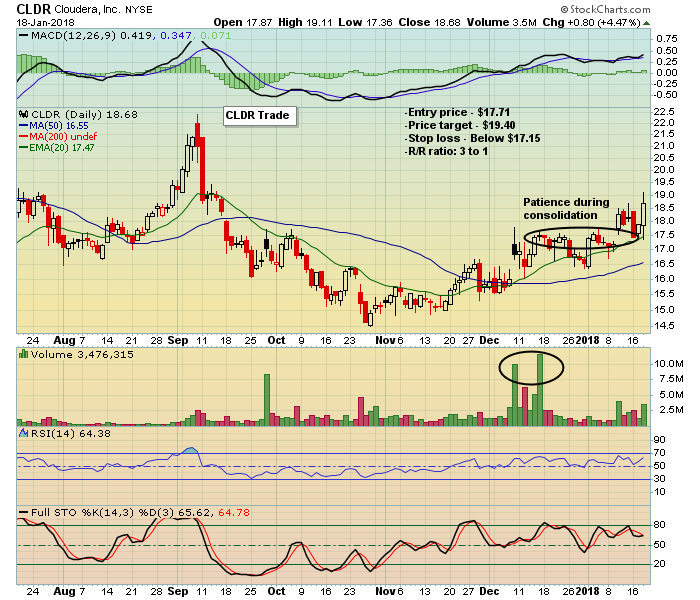
Want to Make Money? Show Great Patience

by John Hopkins,
President and Co-founder, EarningsBeats.com
Earnings season is about to kick into high gear. Over the next few weeks thousands of companies will report their numbers. Some will beat expectations and some will disappoint. And some will present some great opportunities to make nice money, especially for those of you who are patient enough to...
READ MORE
MEMBERS ONLY
What To Buy In An Overbought Market
by Tom Bowley,
Chief Market Strategist, EarningsBeats.com
Bull markets can advance very quickly and can become extremely overbought. It's a challenge psychologically at times to commit new money t0 a stock or ETF, knowing that just days or weeks ago prices were so much cheaper. So what the heck do you do when looking to...
READ MORE
MEMBERS ONLY
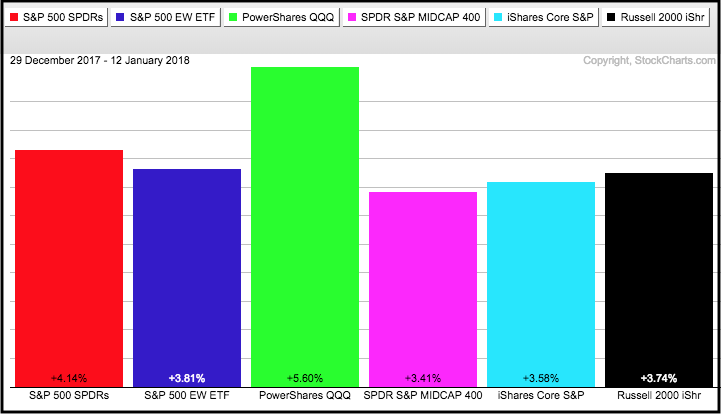
A Surprising Small-cap Sector is Leading in 2018
by Arthur Hill,
Chief Technical Strategist, TrendInvestorPro.com
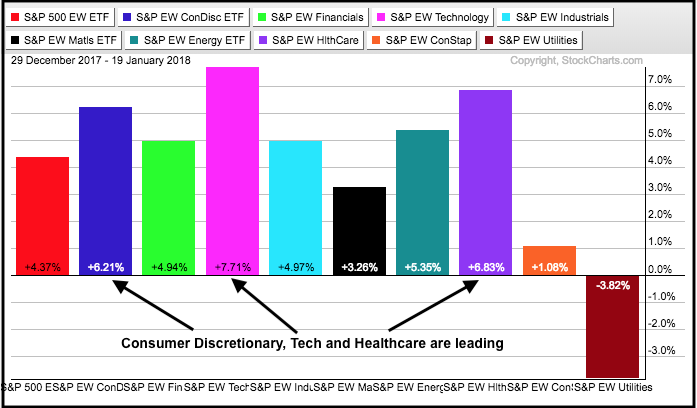
2018 is off to a great start with the S&P 500 SPDR (SPY) up 5% in just 13 trading days. The rally is quite broad with six of the nine equal-weight sectors up 5% or more. I am showing the equal-weight sectors first because they reflect performance for...
READ MORE
MEMBERS ONLY
PMO Analysis Chart - Market Isn't As Overbought As You Think
by Erin Swenlin,
Vice President, DecisionPoint.com
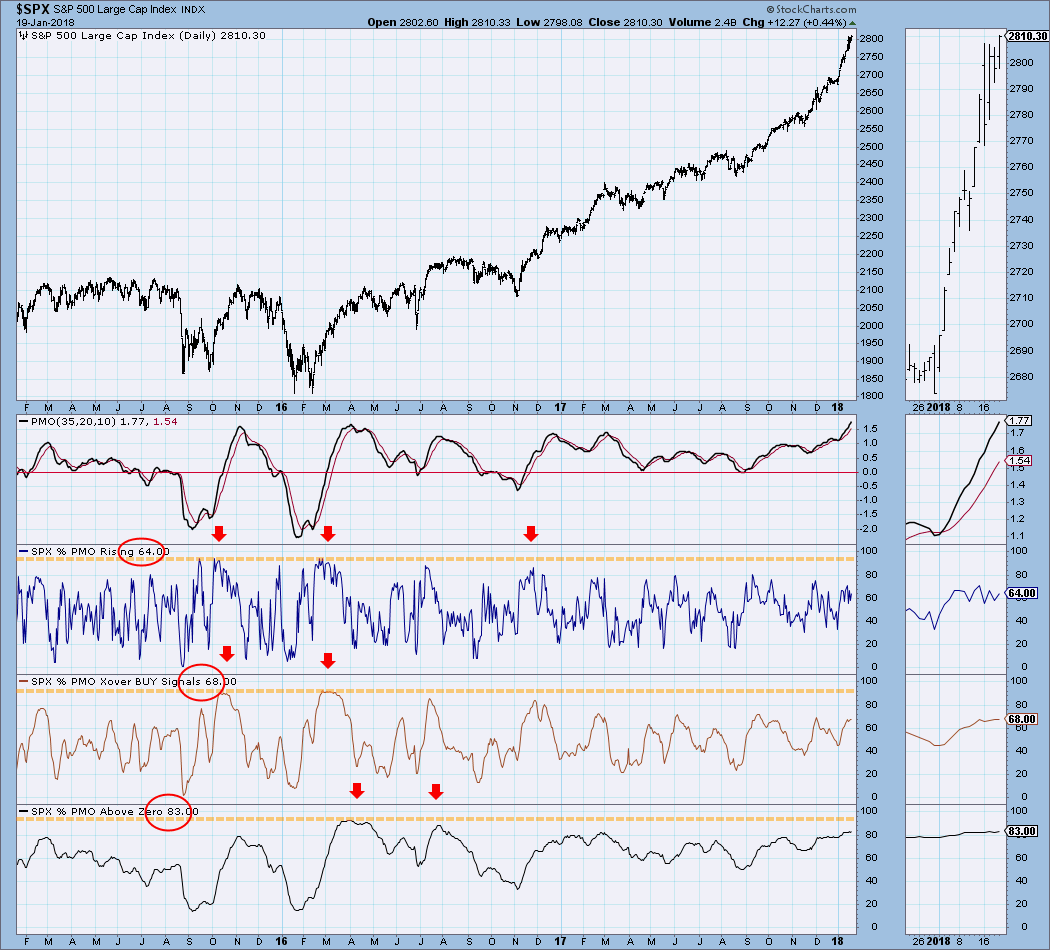
Most of you are familiar with the Price Momentum Oscillator (PMO) and its use on my individual stock, ETF, index charts. However, by analyzing the health of the PMOs within an index, we are able to get a reliable market indicator.
The PMO Analysis charts that are in the DecisionPoint...
READ MORE
MEMBERS ONLY
DP Weekly Wrap: Almost A Top

by Carl Swenlin,
President and Founder, DecisionPoint.com
Friday was the last trading day before options expiration, so higher than normal volume should be attributed to that, not to other interpretations of volume versus price movement. We began the trading week with another breakout to new, all-time highs, but that turned into an intraday reversal. But not to...
READ MORE
MEMBERS ONLY

TEN-YEAR TREASURY YIELD TOUCHES THREE-YEAR HIGH -- STRONG CHINESE ECONOMY PUSHES MAINLAND STOCKS HIGHER -- HONG KONG HITS A NEW RECORD -- A WEAKER DOLLAR FAVORS FOREIGN STOCKS -- FOREIGN STOCK ETFS GET A BOOST FROM RISING LOCAL CURRENCIES
by John Murphy,
Chief Technical Analyst, StockCharts.com
TEN-YEAR BOND YIELD TOUCHES THREE-YEAR HIGH ... The weekly bars in Chart 1 show the 10-Year Treasury Yield touching the highest level in three years today. A decisive close above its late 2016 peak (2.62%) would signal even higher rates. That's a lot better for stocks than it...
READ MORE
MEMBERS ONLY

Maximizing Your Profits Since 2013 - Tensile Trading ChartPack Update #18 (Q4, 2017)

by Gatis Roze,
Author, "Tensile Trading"
Yes, the markets are extended. All prudent investors should be reviewing the Permission-to-Sell Dashboard (ChartList 10.4) every week. We’ve added another useful market timing chart and made all 15 charts more muscular.
The times are a’ changing in the ETF arena as well. Hundreds are closing and new...
READ MORE
MEMBERS ONLY
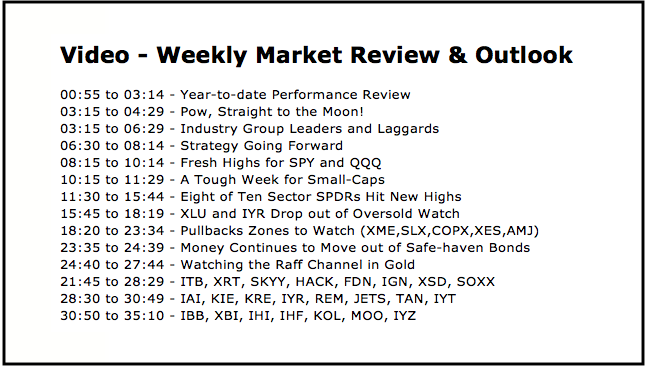
Weekly Market Review & Outlook (with Video) - Pow, Straight to the Moon!
by Arthur Hill,
Chief Technical Strategist, TrendInvestorPro.com
* Pow, Straight to the Moon!
* Group Leaders and Laggards.
* Strategy Going Forward.
* Fresh Highs for SPY and QQQ.
* A Tough Week for Small-Caps.
* Eight of Ten Sector SPDRs Hit New Highs.
* XLU and IYR Drop out of Oversold Watch.
* Pullbacks Zones to Watch (XME,SLX,COPX,XES, AMJ).
* Money Continues...
READ MORE
MEMBERS ONLY
My Trading Strategy In An Overbought Bull Market
by Tom Bowley,
Chief Market Strategist, EarningsBeats.com
Market Recap for Thursday, January 18, 2018
Thursday was not a great day for the bulls. We haven't seen too many times since the August low where all of our major indices finished lower on the session. Yesterday, however, was one of those days. But the action recently...
READ MORE
MEMBERS ONLY
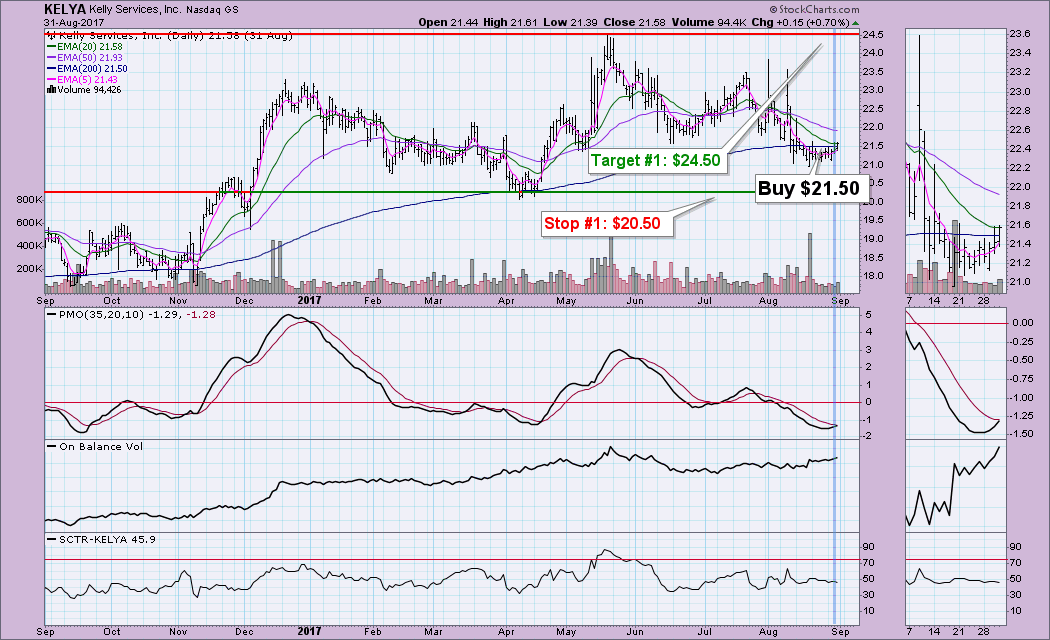
Anatomy of a Trade: Kelly Services (KELYA) - Stops/Targets/Evaluation
by Erin Swenlin,
Vice President, DecisionPoint.com
One of my favorite segments to do and watch on the MarketWatchers LIVE show M-F 12:00p - 1:30p EST is the "Anatomy of a Trade". Tom Bowley, my co-host, is a very short-term trader and generally has a handful of trades to discuss. However, I'...
READ MORE
MEMBERS ONLY

SystemTrader - The Dip is Your Friend
by Arthur Hill,
Chief Technical Strategist, TrendInvestorPro.com
* Setting the Market Regime and Ground Rules.
* Sample Signals for SPY and IJR.
* Backtest Results.
* I Know What You are Thinking.
* Conclusions.
Mean-reversion trading systems are designed to buy the dip during bull markets. The assumption is that the trend is the major force at work and prices will revert...
READ MORE
MEMBERS ONLY
For The S&P 500, Today's Close Is Historically Significant
by Tom Bowley,
Chief Market Strategist, EarningsBeats.com
Market Recap for Wednesday, January 17, 2018
The Dow Jones didn't fail this time. After Tuesday's huge reversal from above the 26,000 level, there were a number of question marks about whether the current rally would continue. The Dow Jones answered those questions rather emphatically...
READ MORE
MEMBERS ONLY
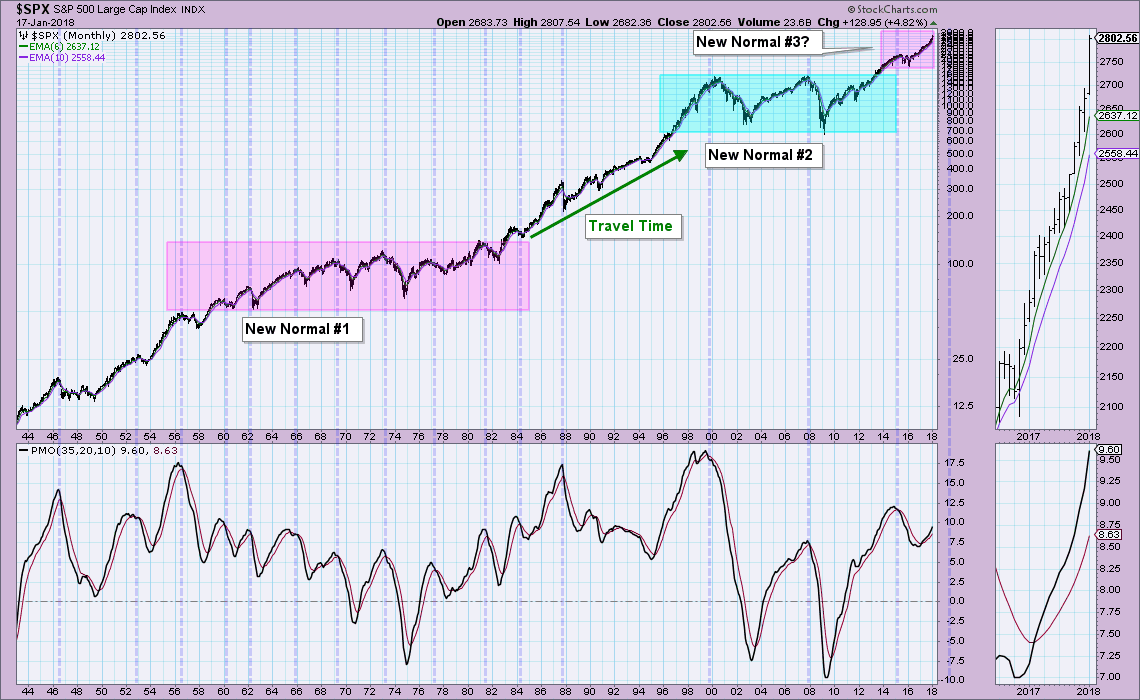
DP Alert: Market Overbought or the "New Normal"? - UUP H&S Executing As Expected
by Erin Swenlin,
Vice President, DecisionPoint.com
As we watch the SPX continue to move higher in parabolic fashion, it's of course natural to begin to worry about a market collapse. During today's MarketWatchers LIVE show, Tom and I went over what we think are good "alerts" to the bear market...
READ MORE
MEMBERS ONLY

STOCK BUYING RESUMES AFTER YESTERDAY'S PULLBACK -- DOW REGAINS 26K -- YESTERDAY'S INTRA-DAY LOW PROVIDES A SHORT-TERM SUPPORT LEVEL -- SEMICONDUCTORS LEAD TECHNOLOGY SECTOR TO NEW HIGH
by John Murphy,
Chief Technical Analyst, StockCharts.com
MARKET INDEXES NEAR YESTERDAY'S INTRA-DAY HIGH ... Stocks are making a strong comeback after yesterday afternoon's pullback. The charts below show 30-minute price bars for the three major stock indexes. All three are approaching the intra-day highs reached yesterday. Chart 1 also shows the Dow Industrials back...
READ MORE
MEMBERS ONLY
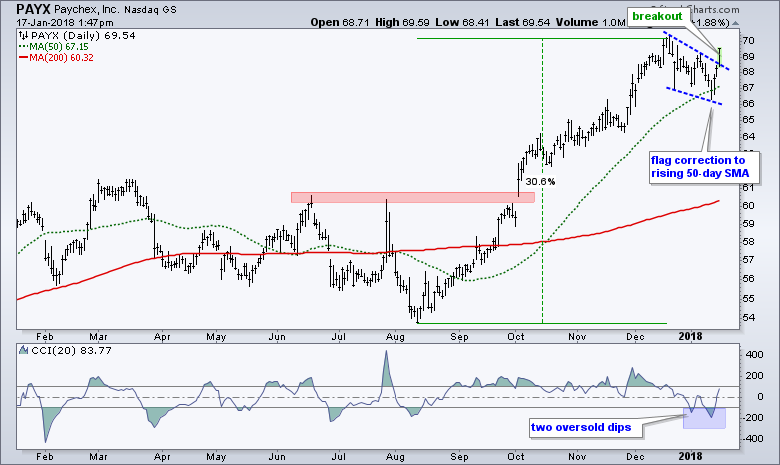
PayChex Looks to Hit Payday with Momentum Breakout
by Arthur Hill,
Chief Technical Strategist, TrendInvestorPro.com
PayChex (PAYX), which has nothing to do with Chex cereal, ended its correction with a three-day surge and wedge breakout. First and foremost, the long-term trend is up as the stock broke out in early October and hit a 52-week high in December. The stock was quite extended after 30%...
READ MORE
MEMBERS ONLY
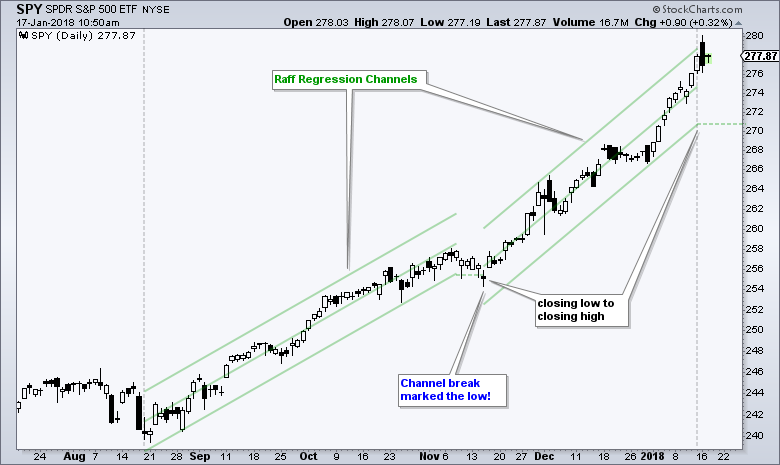
Defining Steep Uptrends, Setting Trailing Stops and Projecting Flag Targets
by Arthur Hill,
Chief Technical Strategist, TrendInvestorPro.com
* Raff Regression Channels and Steep Uptrends.
* Chandelier Exit Holds Entire Uptrend.
* SPY Nears Flag Target.
* Buy the Dip in Bull Markets.
Raff Regression Channels and Steep Uptrends
There is no such thing as the perfect indicator or the perfect settings, but I would like to show a method to quantify...
READ MORE
MEMBERS ONLY
Big Selling Hits Wall Street; Here's What To Watch On Wednesday
by Tom Bowley,
Chief Market Strategist, EarningsBeats.com
Market Recap for Tuesday, January 16, 2018
Tuesday was perhaps the most bearish day we've seen in quite awhile. For starters, volume on our major indices was the heaviest in the past 6-7 weeks, excluding option expiration Friday on December 15th. But the heavy volume, by itself, wasn&...
READ MORE
MEMBERS ONLY

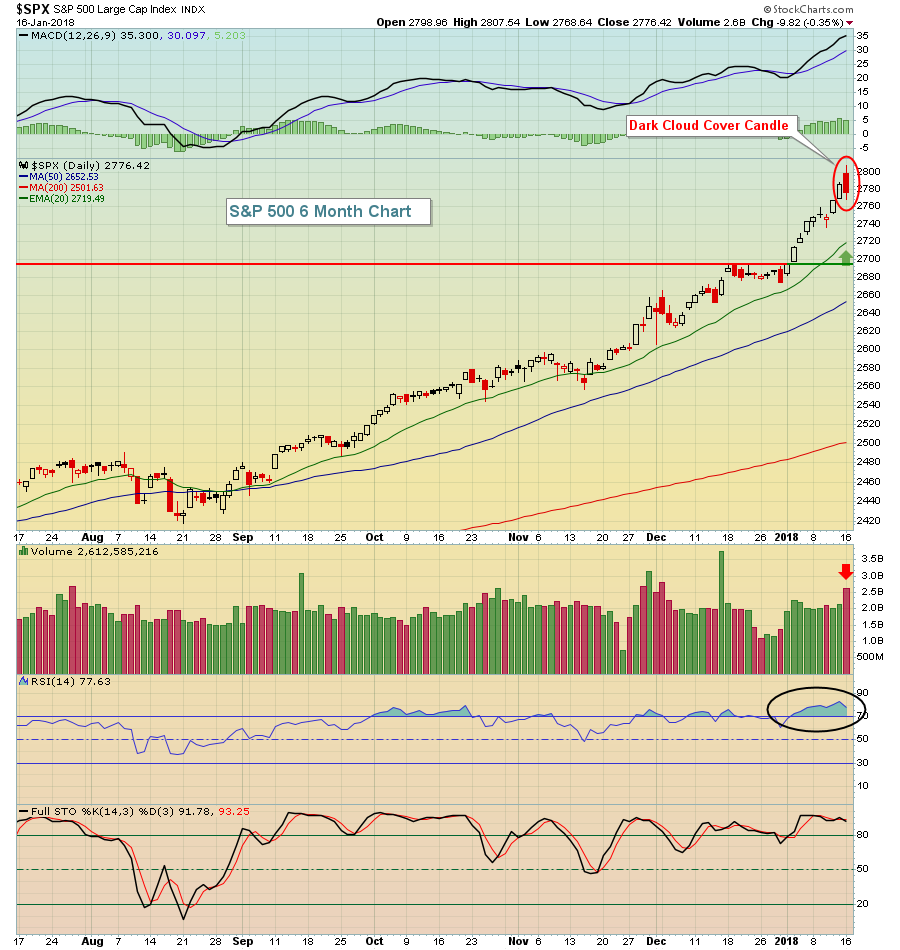
Cold Weather And Dark Cloud Cover Seen Over Wall Street
by Martin Pring,
President, Pring Research
* Dark cloud cover explained
* What enhances a dark cloud signal
* How long is its bearish effect likely to last?
Dark cloud cover explained
The weather forecast this morning was for wintery weather on the East Coast. However, a more sobering non-meteorological message has been given by the stock market. Tuesday’...
READ MORE
MEMBERS ONLY
Trend Mode Versus Corrective Mode - Playing the Pullbacks (8 Stock Setups)
by Arthur Hill,
Chief Technical Strategist, TrendInvestorPro.com
* SPY and QQQ Lead the 2018 Surge.
* Moving from Corrective Mode to Trend Mode.
* Déjà vu for HRB and ACH.
* Playing the Short Correction (NEWM, LYV, YUM).
* AXL Breaks Out of Big Correction.
* LPX Makes Good on Third Bounce.
* AGCO Forms Classic Bullish Continuation Pattern.
SPY and QQQ Lead the...
READ MORE
MEMBERS ONLY
Media Agencies, Consumer Discretionary Lead Latest Advance
by Tom Bowley,
Chief Market Strategist, EarningsBeats.com
Market Recap for Friday, January 12, 2018
U.S. equities had another nice rally on Friday, this time led by a very strong consumer discretionary sector (XLY, +1.29%). Eight of the nine sectors finished higher, with utilities (XLU, -0.57%) the only area failing to participate. The XLU tends...
READ MORE
MEMBERS ONLY
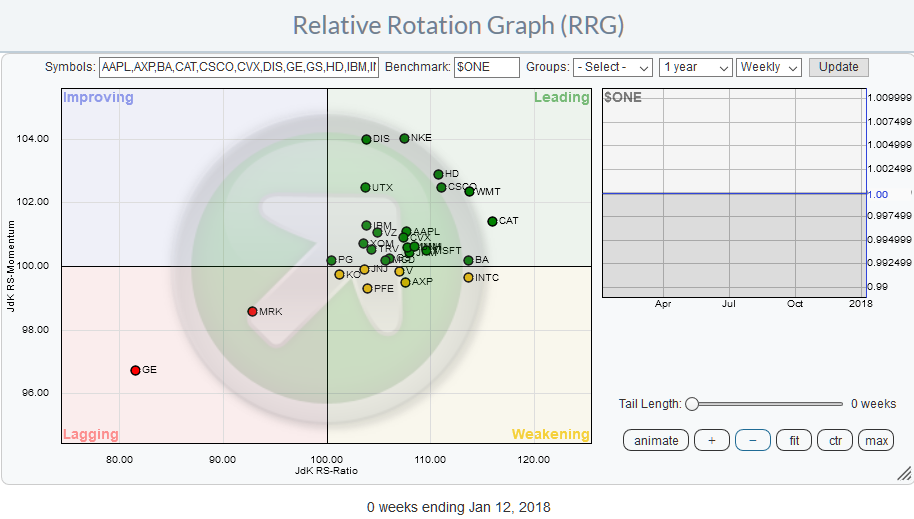
Using Relative Rotation Graphs(R) to get a handle on both price- and relative rotation in ONE picture

by Julius de Kempenaer,
Senior Technical Analyst, StockCharts.com
In my last blog, we looked at the 30 components of the Dow Jones Industrials Index and more specifically at the relative positioning and relative rotation of these 30 stocks around their common denominator the DJ Industrials index ($INDU).
And despite the fact that this is valuable information you may...
READ MORE