MEMBERS ONLY
Finance Sector Springs to Life - Regional Banks Surge - Citigroup, Morgan Stanley and USB Break Out

by Arthur Hill,
Chief Technical Strategist, TrendInvestorPro.com
---- S&P MidCap SPDR Catches a Bid
---- Finance SPDR Springs to Life
---- Citigroup and Morgan Stanley End Pullbacks
---- US Bancorp Leads Regional Bank SPDR
---- Broker-Dealer iShares Breaks Out of Flag ----
S&P MidCap SPDR Catches a Bid ----
Large-caps are leading so...
READ MORE
MEMBERS ONLY
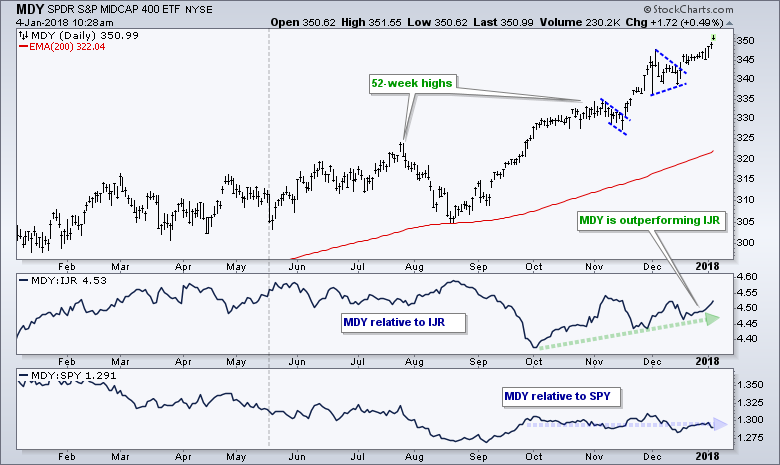
Here's A Must-Own Industry Group For 2018 And A Very Bullish Relative Breakout

by Tom Bowley,
Chief Market Strategist, EarningsBeats.com
Market Recap for Wednesday, January 3, 2018
We're only two trading days into 2018 and already we've seen the S&P 500's first close ever over 2500, the NASDAQ's first close ever above 7000, the Russell 2000's first close...
READ MORE
MEMBERS ONLY

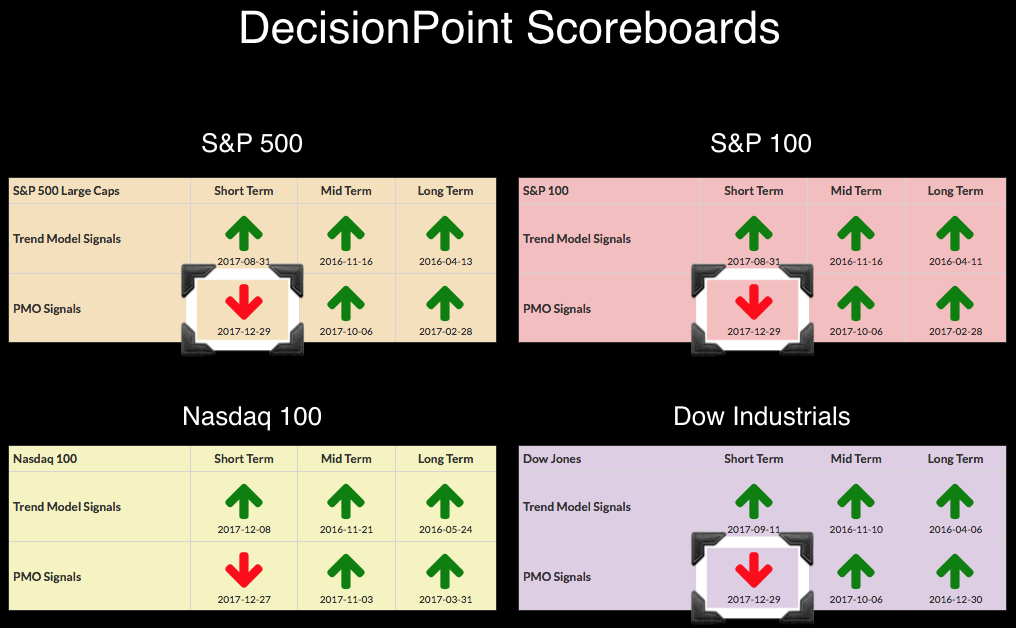
DP Alert: Whipsaw Back to BUY Signals - Dow Left Out

by Erin Swenlin,
Vice President, DecisionPoint.com
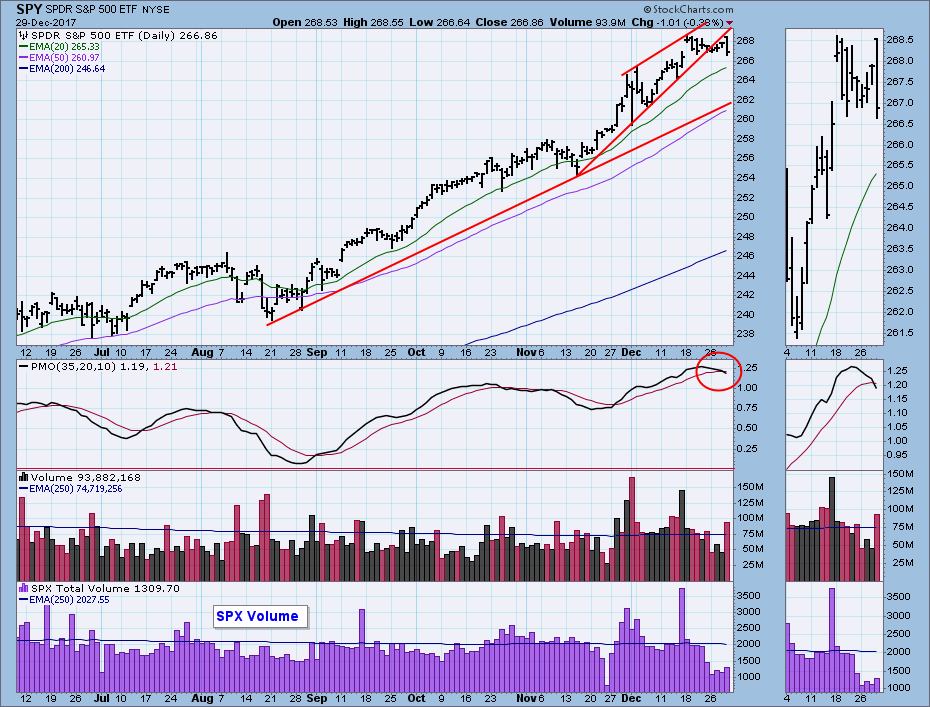
I had a bad feeling about the array of PMO SELL signals that appeared Friday and Tuesday. It wasn't worry about an upcoming decline, more the concern we'd see a whipsaw right back to BUY signals, which we did. Interestingly, the Dow was left out and...
READ MORE
MEMBERS ONLY

CRUDE OIL HITS ANOTHER HIGH AND NEARS TEST OF $62 -- UNITED STATES OIL FUND NEARS TEST OF SPRING 2016 HIGH -- ENERGY SPDR MAY ON THE VERGE OF A BULLISH BREAKOUT -- ENERGY/SPX RELATIVE STRENGTH RATIO REACHES HIGHEST LEVEL IN EIGHT MONTHS

by John Murphy,
Chief Technical Analyst, StockCharts.com
UNITED STATES OIL FUND NEARS UPSIDE BREAKOUT ... Energy prices continue to rise. WTIC Light Crude Oil is trading over $61 today for the first time more than two years and is nearing a test of its spring 2015 high just over $62. Chart 1 shows the United States Oil Fund...
READ MORE
MEMBERS ONLY
Bulls Open 2018 With A Party Like It's 1999
by Tom Bowley,
Chief Market Strategist, EarningsBeats.com
Market Recap for Tuesday, January 2, 2018
The NASDAQ loves January and January loves the NASDAQ. If there's one month where the NASDAQ really shines on a relative basis, it's January (see Historical Tendencies below) and that index opened the new year like it owns January....
READ MORE
MEMBERS ONLY

FAANG Starts the Year with a Baang
by Arthur Hill,
Chief Technical Strategist, TrendInvestorPro.com
The five FAANG stocks, Facebook, Apple, Amazon, Netflix and Google (Alphabet), started the year strong as three moved back above their 50-day SMAs on Tuesday. Alphabet and Amazon were already above their 50-day SMAs so this means all five are back above these key moving averages. The chart below shows...
READ MORE
MEMBERS ONLY
Pausing Market Triggers Whipsaw PMO SELL Signals on DP Scoreboards - New ITTM BUY Signal for Gold
by Erin Swenlin,
Vice President, DecisionPoint.com
On Friday, the SPX, OEX and Dow logged new PMO SELL signals. This was a function of the market consolidating and holiday trading, but it is important to note that these signals are arriving in overbought territory for these PMOs. After today's trading, their PMOs are already decelerating...
READ MORE
MEMBERS ONLY
Building a Rules-Based Trend Following Model

by Greg Morris,
Veteran Technical Analyst, Investor, and Author
I’m going to start a new series of articles on building a rules-based trend following model. For a host of reasons, I cannot provide readers complete details of the trend following model I currently use, but I can simulate most of the concepts in various examples, so you will...
READ MORE
MEMBERS ONLY
Here's One Chart That Screams BUY As We Begin 2018
by Tom Bowley,
Chief Market Strategist, EarningsBeats.com
Special Note
First, I'd like to wish everyone a Happy New Year! Let's make 2018 our best yet! Here are a couple of quick reminders:
(1) If you like my Trading Places blog and you'd like to follow my articles every morning, scroll down...
READ MORE
MEMBERS ONLY
SPY and IJR Stall into Yearend - Energy, Materials and Industrials Finish Strong - 3 Materials Stocks and an Industrial to Watch
by Arthur Hill,
Chief Technical Strategist, TrendInvestorPro.com
---- SPY Ends the Year with a Stall
---- IJR Consolidates into Yearend
---- Energy, Materials and Industrials Finish 2017 Strong
---- Oil Finishes at High of the Year
----Aluminum, Copper and Nickel Finish Strong
---- Three Materials Stocks to Watch (MLM, VMC, NUE)
---- Acuity Bases in Third Quarter...
READ MORE
MEMBERS ONLY
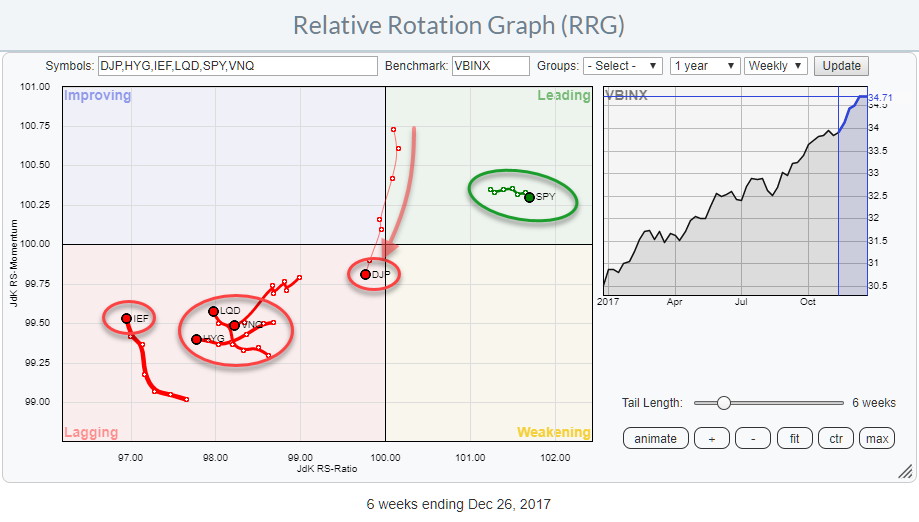
Relative Rotation Graphs suggest to stick with equities (SPY) while keeping an eye on commodities (DJP) going into 2018

by Julius de Kempenaer,
Senior Technical Analyst, StockCharts.com
As 2017 draws to an end, the Relative Rotation Graph for asset classes is sending a very clear message!
Equities are leading the way into 2018!
The RRG above shows some ETFs representing various asset classes and uses VBINX, a balanced index fund, as the benchmark.
With only SPY, representing...
READ MORE
MEMBERS ONLY
DP Yearly Wrap 2017

by Carl Swenlin,
President and Founder, DecisionPoint.com
Last week we were looking at a rising wedge formation, which we said normally resolves downward. This week price moved through the bottom of the wedge sideways, but that doesn't really qualify as a downward resolution, which would necessarily require price to move, well, down. Friday's...
READ MORE
MEMBERS ONLY

The Secret To a Better 2018 Starts Here

by Grayson Roze,
Chief Strategist, StockCharts.com
Alright, I know. It's a little cliche. But hey, not only is it a Friday, it's also the last Friday of the year. And not only is it the last Friday of the year, it's also the final trading day of 2017 (can you...
READ MORE
MEMBERS ONLY
New Years Resolutions For Traders
by Tom Bowley,
Chief Market Strategist, EarningsBeats.com
Special Note
Happy New Year to all and thanks so much for your support of me and StockCharts.com in 2017 (and please subscribe at the bottom of my article - it's FREE!). If you're not a member, your first resolution should be to become one....
READ MORE
MEMBERS ONLY

COMMODITIES ARE AT LOWEST LEVEL RELATIVE TO STOCKS IN HISTORY -- COMMODITIES HAVE A LOT OF CATCHING UP TO DO -- THAT PROCESS MAY BE BEGINNING -- CRB INDEX MAY BE NEARING UPSIDE BREAKOUT -- GLOBAL METALS AND MINING PRODUCERS ETF REACHES THREE-YEAR HIGH
by John Murphy,
Chief Technical Analyst, StockCharts.com
COMMODITIES ARE HISTORICALLY VERY CHEAP VERSUS STOCKS... I suggested yesterday that commodity prices (and stocks tied to them) usually do better in the later stages of a business cycle as inflation pressures start to build. We may be entering that stage. One of the reasons why investors may be turning...
READ MORE
MEMBERS ONLY
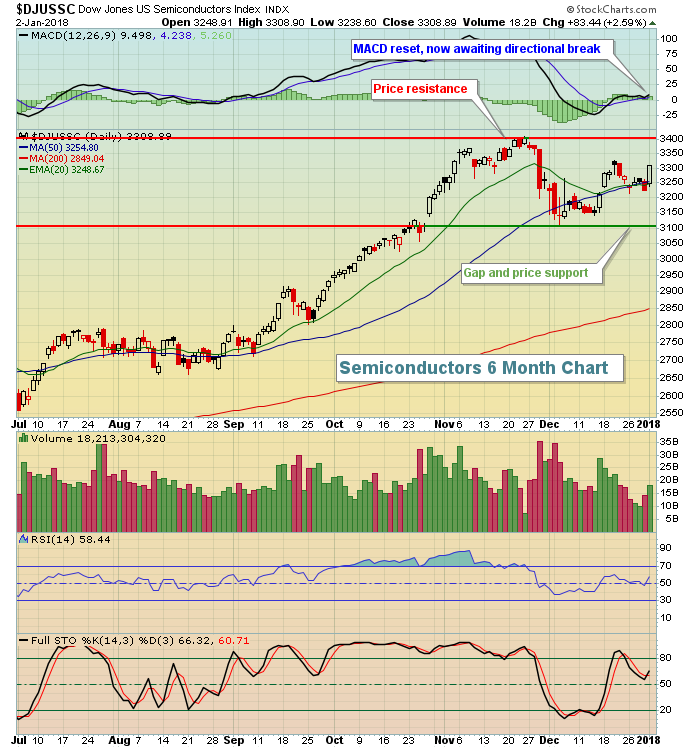
Technology Stocks Set To Lead Year End Rally
by Tom Bowley,
Chief Market Strategist, EarningsBeats.com
Market Recap for Wednesday, December 27, 2017
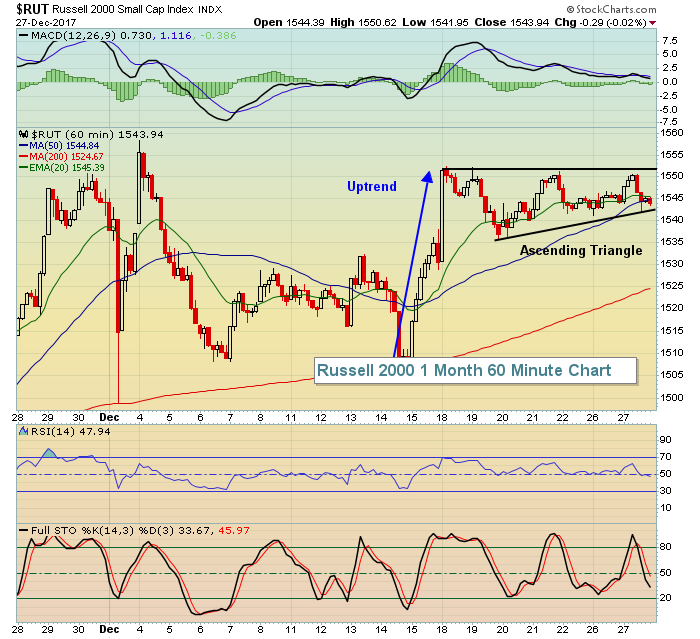
Wednesday's action was characterized by thin volume and low volatility, normal for trading during the holidays. Our major indices moved fractionally higher, with the Russell 2000 ($RUT) being the exception after that index fell during the afternoon session to finish slightly...
READ MORE
MEMBERS ONLY

Four Markets To Watch In 2018 For A Potentially Important Breakout

by Martin Pring,
President, Pring Research
* 10-year bond yields could be in the process of a secular reversal.
* What odds is the S. Korean ETF placing on the breakout of war?
* China has gone uncharacteristically quiet. Is this the quiet before the storm?
* CRB Composite just below mega resistance
As we approach 2018 I thought it...
READ MORE
MEMBERS ONLY
DP Alert: NDX Logs New SELL Signal - Gold Shines - ST Indicators Rising Again
by Erin Swenlin,
Vice President, DecisionPoint.com
I hope you and yours had a fantastic and warm Christmas! As Bob Cratchit so eloquently put it, "I was making rather merry yesterday". The holidays continue as does holiday trading into the new year. We received a new PMO SELL signal on the NDX, so I'...
READ MORE
MEMBERS ONLY

WEAKER DOLLAR PUSHES COMMODITY PRICES HIGHER -- GOLD AND ITS MINERS CLIMB -- RISING ALUMINUM AND COPPER PRICES PUSH THEIR SHARES TO NEW HIGHS -- SOUTHERN COPPER HITS ALL-TIME HIGH -- RISING COMMODITIES MAY GIVE A BOOST TO CANADIAN STOCKS
by John Murphy,
Chief Technical Analyst, StockCharts.com
U.S. DOLLAR INDEX WEAKENS ... The U.S. dollar continues to weaken. Chart 1 shows the PowerShares US Dollar Index (UUP) falling today to the lowest level in a month. The dollar is down against all foreign developed currencies except the yen which is marginally lower. The biggest influence on...
READ MORE
MEMBERS ONLY
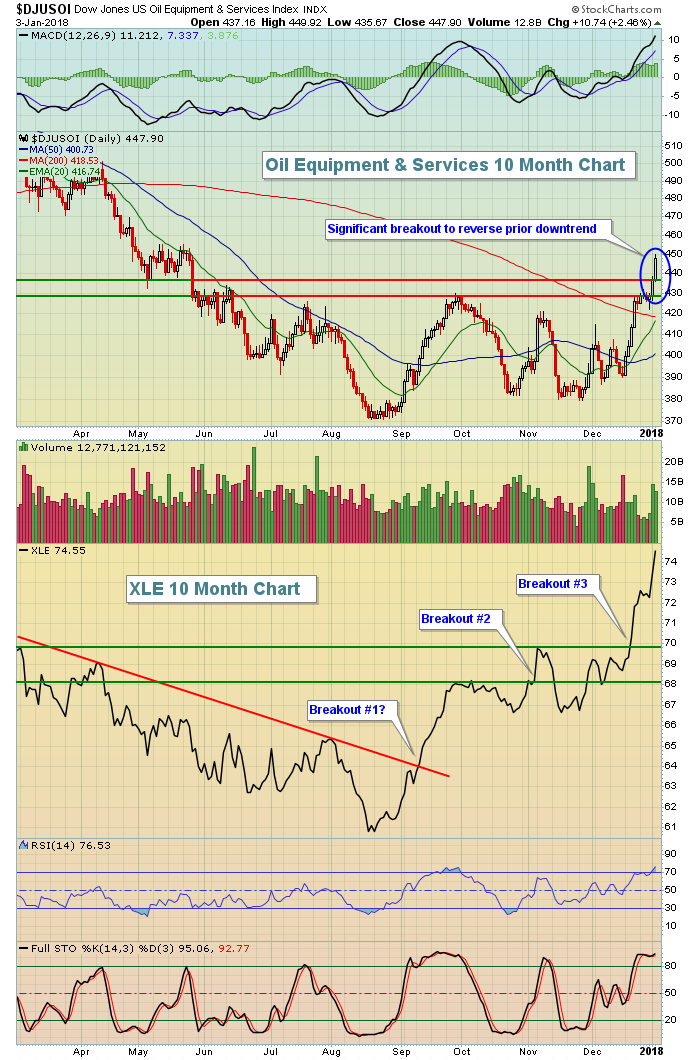
What Industry Will Lead The Stock Market In 2018? You Might Be Surprised....
by Tom Bowley,
Chief Market Strategist, EarningsBeats.com
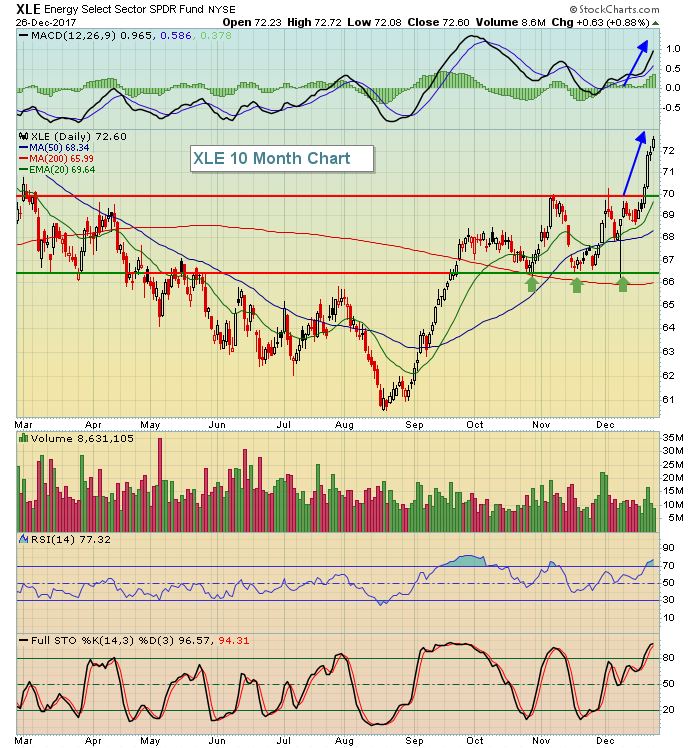
Market Recap for Tuesday, December 26, 2017
Energy stocks (XLE, +0.88%) continued their merry way higher, which really isn't surprising after the sector made a very significant price breakout above the 70 level. With an RSI approaching the 80 level now, however, I wouldn't be...
READ MORE
MEMBERS ONLY
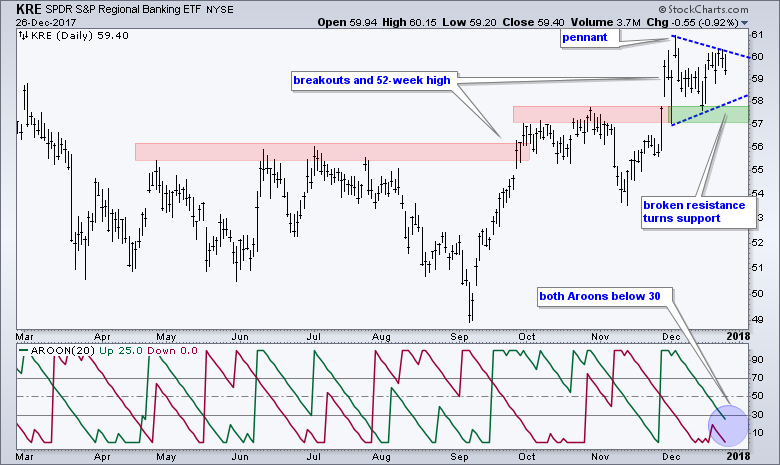
Regional Bank ETF Winds Up before Next Move
by Arthur Hill,
Chief Technical Strategist, TrendInvestorPro.com
The Regional Bank SPDR (KRE) surged to a 52-week high in late November and then formed a bullish continuation pattern as it consolidated the last few weeks. First and foremost, the long-term trend is up for KRE because of the breakouts in September and November, and the 52-week high in...
READ MORE
MEMBERS ONLY
Time For Another Santa Claus Rally?
by Tom Bowley,
Chief Market Strategist, EarningsBeats.com
Market Recap for Friday, December 22, 2017
The major indices all fell back slightly during Friday's pre-Christmas holiday, light volume trading session. Materials (XLB, +0.38%) was the best performing sector, while healthcare (XLV, -0.32% and financials (XLF, -0.28%) lagged.
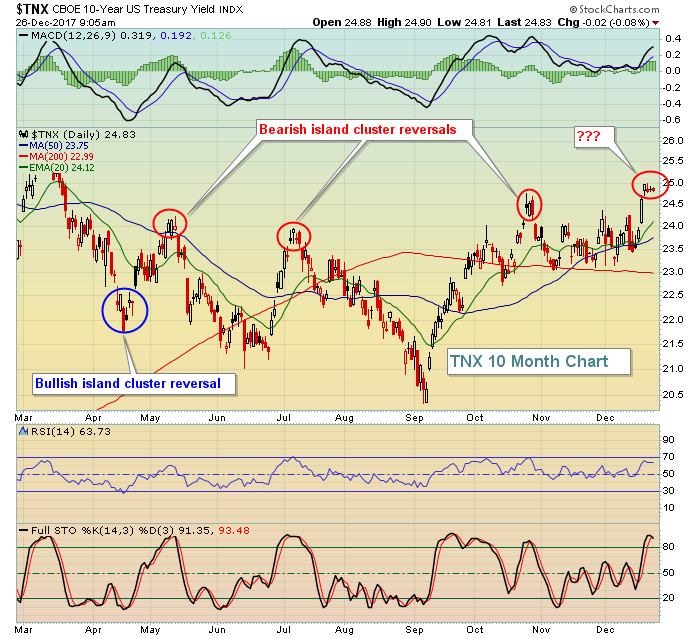
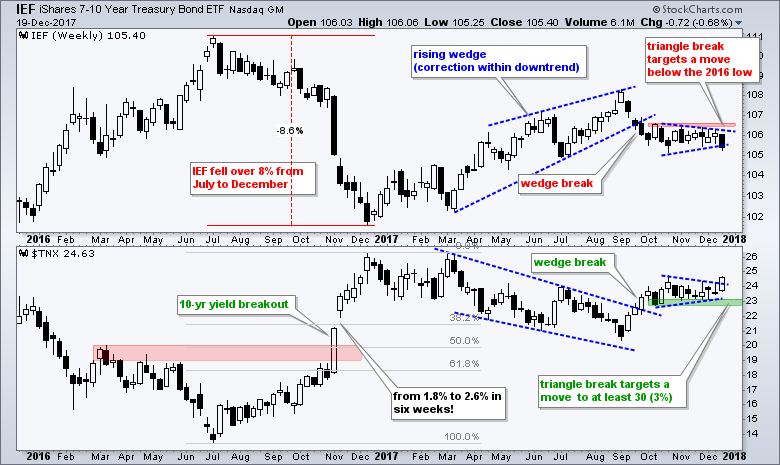
The 10 year treasury yield ($TNX)...
READ MORE
MEMBERS ONLY

STOCKS HAVE ANOTHER UP WEEK BUT END QUIETLY -- - SURGE IN BOND YIELDS WAS WEEK'S BIGGEST STORY -- INFLATION-SENSITIVE STOCKS SURGED WHILE RATE-SENSITIVE STOCKS TUMBLED -- THAT SUGGESTS THERE MAY BE SOME HEDGING AGAINST FUTURE INFLATION GOING ON
by John Murphy,
Chief Technical Analyst, StockCharts.com
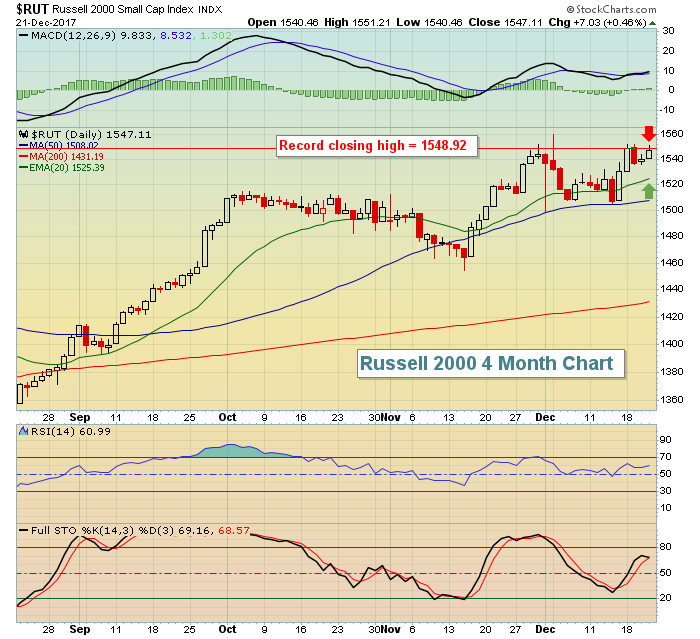
SANTA CLAUS RALLY STILL LIES AHEAD... The stock market experienced the second slowest trading day of the year on Friday as traders headed home for Christmas. All major stock indexes, however, hit new records during the week. The Russell 2000 Small Cap Index had the week's biggest percentage...
READ MORE
MEMBERS ONLY
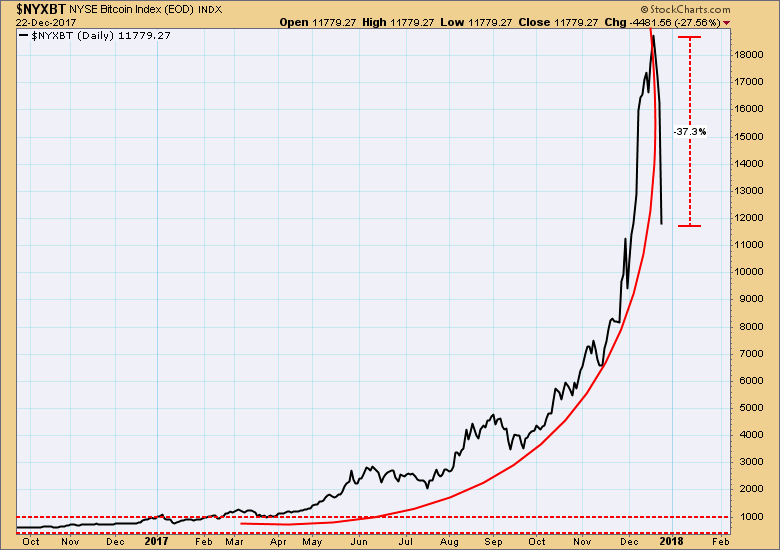
DP Weekly Wrap: Bitcoin Collapse
by Carl Swenlin,
President and Founder, DecisionPoint.com
Two weeks ago I led with a chart of the Bitcoin Index. It was in a dangerous parabolic advance, and I said: "Yes, price could go higher, but it is also at a point where the parabolic could collapse, and the potential downside is back down to the support...
READ MORE
MEMBERS ONLY

Weekly Market Review & Outlook - A Mean-Reversion Strategy for Sectors and Major Index ETFs in 2018
by Arthur Hill,
Chief Technical Strategist, TrendInvestorPro.com
.... SPY Hits Another New High
.... A Mean-Reversion Strategy for 2018
.... Breadth Symbols for Other ETFs
.... Time off for Happy Holidays!!
.... IJR Follows QQQ with Flag Breakout
.... Defensive Sectors Lag as Energy Takes the Lead
.... Oil Goes for a Triangle Breakout
.... Oil & Gas Equip & Services SPDR Pops (plus XOP)...
READ MORE
MEMBERS ONLY
Energy And Banks Dominate The Trading Session; All Major Indices Advance
by Tom Bowley,
Chief Market Strategist, EarningsBeats.com
Market Recap for Thursday, December 21, 2017
In afternoon trading, all of the major indices except the NASDAQ appeared headed for another record all-time high close. But a late afternoon selling bug hit Wall Street and much of those earlier gains disappeared. The small cap Russell 2000 was able to...
READ MORE
MEMBERS ONLY

The Yield Curve Is Not Forecasting A Recession Right Now
by Martin Pring,
President, Pring Research
* What message is the yield curve giving?
* Secular reversal in short-term bond yields is being signalled
* Energy sector breaks to the upside
* Energy strength may breathe life into the CRB Composite
What message is the yield curve giving?
Despite what you may be reading, the yield curve is not forecasting...
READ MORE
MEMBERS ONLY
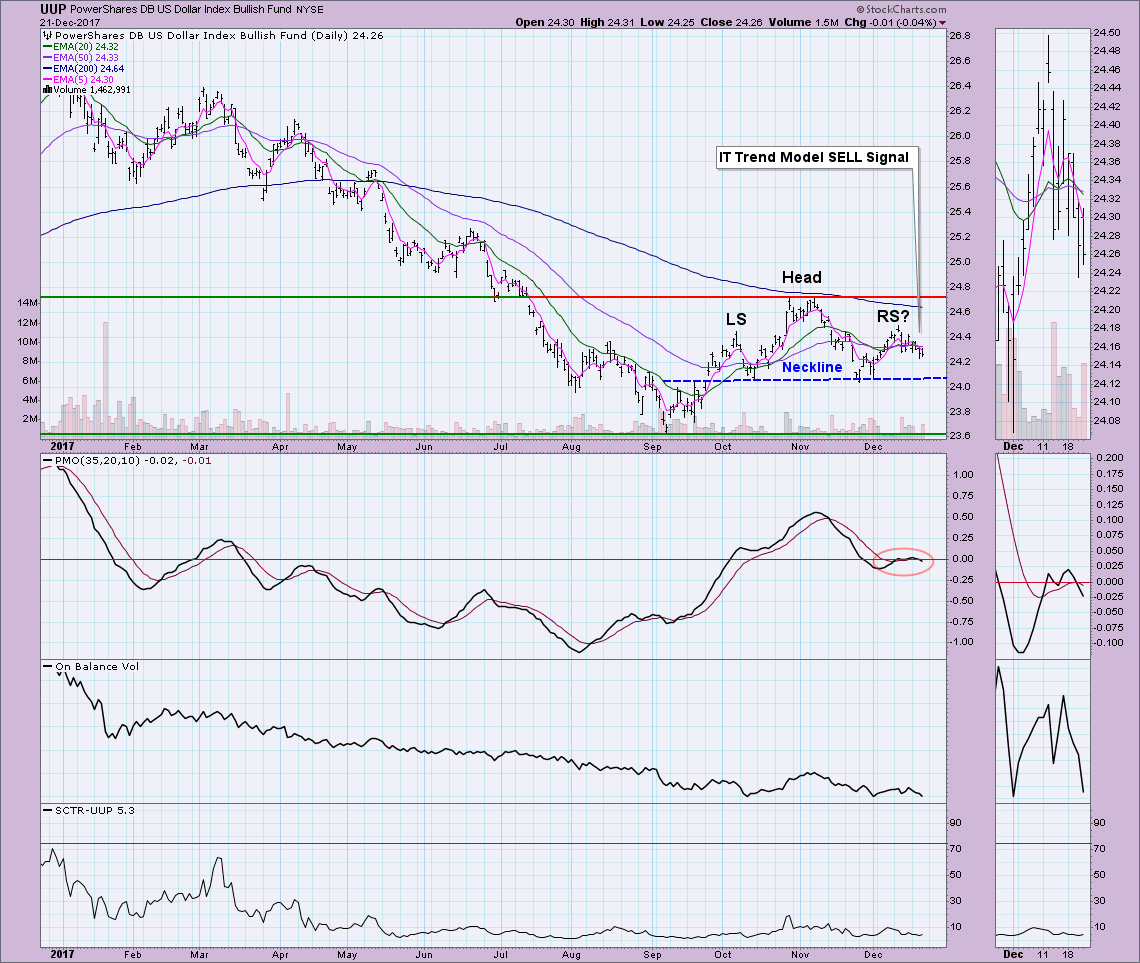
DP Bulletin: Dollar (UUP) ITTM SELL Signal - ITTM Neutral Signals for XLU and RYU
by Erin Swenlin,
Vice President, DecisionPoint.com
The Dollar (UUP) continues to form a bearish head and shoulders pattern in textbook fashion. The decline continues and consequently, there was a negative 20/50-EMA crossover BELOW the 200-EMA which constitutes an Intermediate-Term Trend Model (ITTM) SELL signal. For the Utilities SPDR (XLU) and Utilities Equal-Weight (RYU), new ITTM...
READ MORE
MEMBERS ONLY
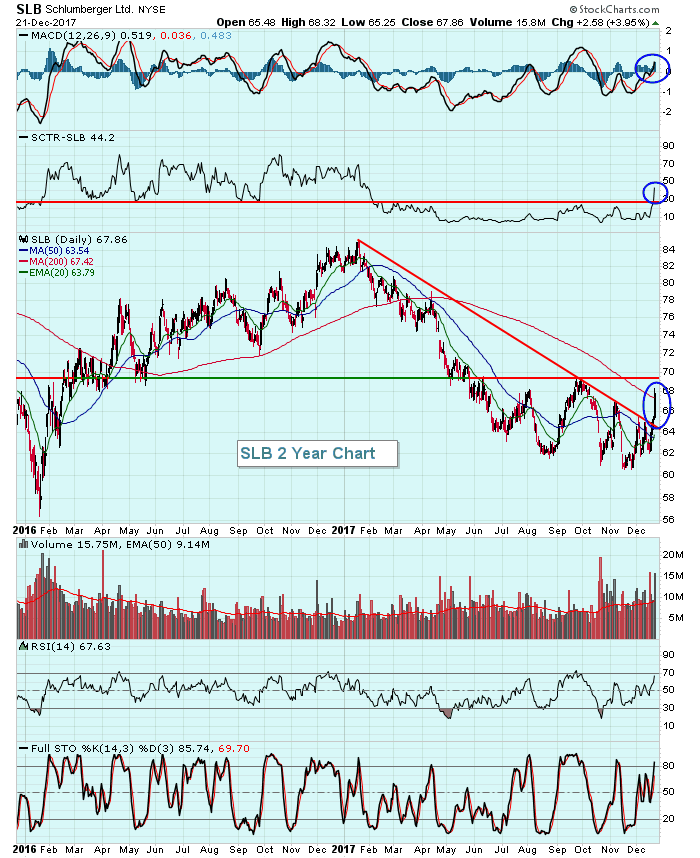
Schlumberger Ends Downtrend, Now Looks To Confirm Price Breakout
by Tom Bowley,
Chief Market Strategist, EarningsBeats.com
The energy ETF (XLE) has been blistering hot this week and today its three largest holdings - Exxon Mobil (XOM at 23%), Chevron Corp (CVX at 17%) and Schlumberger (SLB at 7%) - all had some form of a breakout. XOM surged to its highest close since January. CVX closed...
READ MORE
MEMBERS ONLY

DOW JONES HOME CONSTRUCTION INDEX REACHES ELEVEN YEAR HIGH BUT STILL LOOKS CHEAP ON A RELATIVE STRENGTH BASIS -- US HOME CONSTRUCTION ISHARES ARE HAVING A STRONGER YEAR THAN THE S&P HOMEBUILDER SPDR -- ENERGY SPDR HITS ELEVEN MONTH HIGH
by John Murphy,
Chief Technical Analyst, StockCharts.com
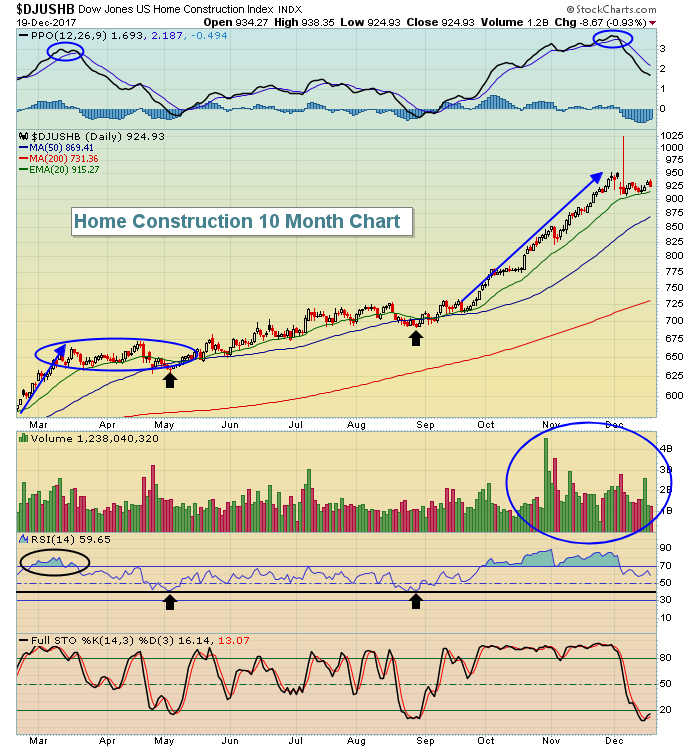
DOW JONES HOME CONSTRUCTION INDEX REACHES ELEVEN-YEAR HIGH... Recent reports of strong home sales and home construction have boosted stocks tied to the housing sector. The low inventory of existing homes available for sale argues for even more homebuilding in the year ahead. All of which bodes well for the...
READ MORE
MEMBERS ONLY
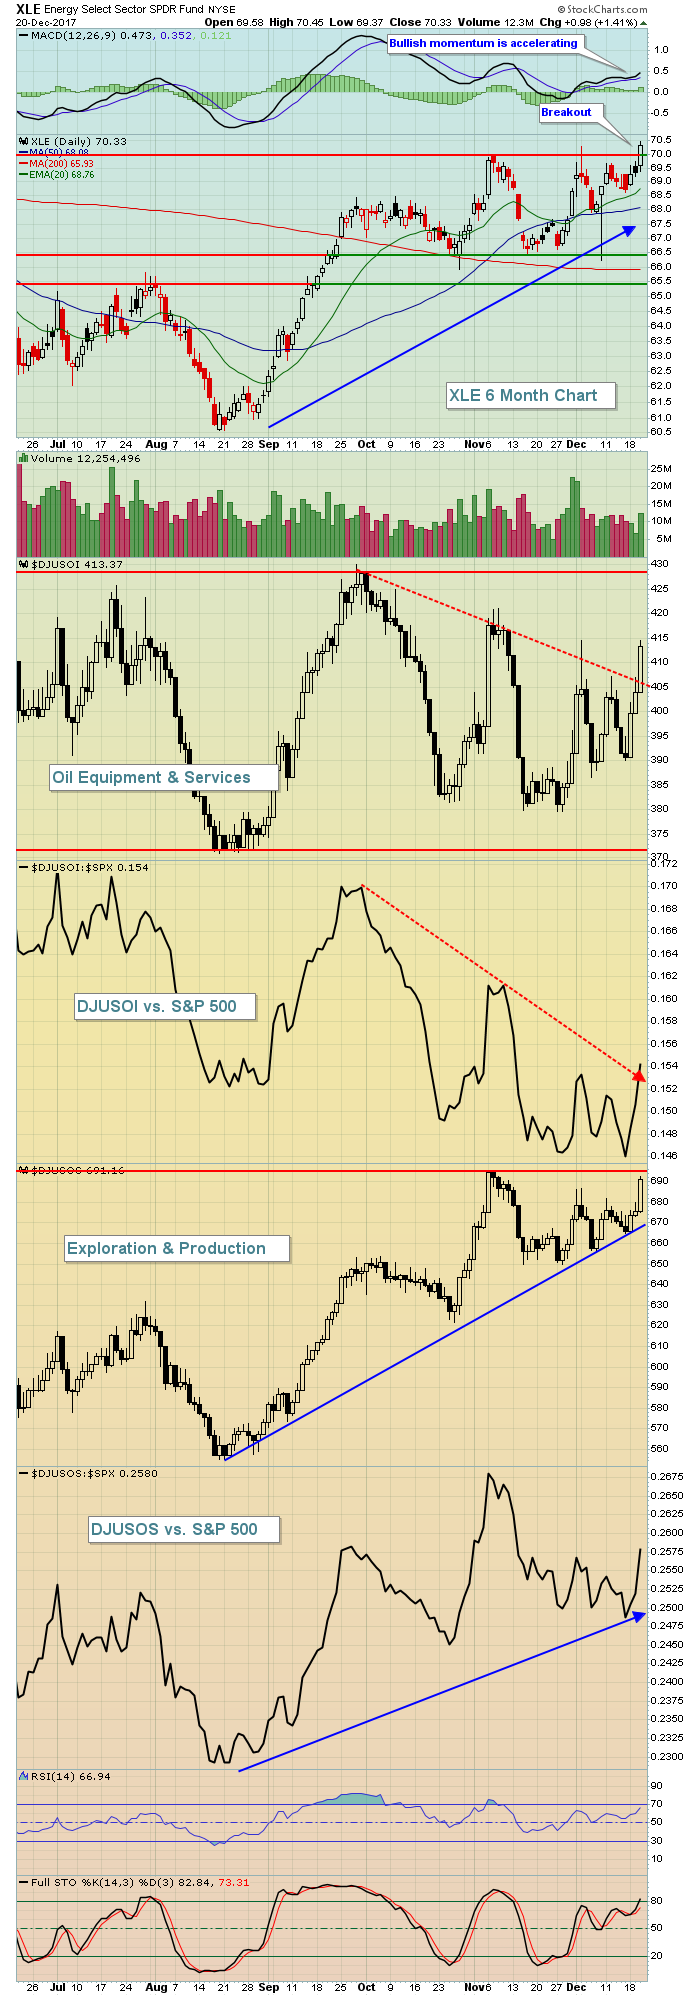
Energy Breaks Out As Oil Equipment & Services Strengthen
by Tom Bowley,
Chief Market Strategist, EarningsBeats.com
Market Recap for Wednesday, December 20, 2017
It's been a rough road for oil equipment & services stocks ($DJUSOI, +2.33%). They haven't broken down below summer lows, but they also haven't kept pace with the energy sector as a whole either. Yesterday'...
READ MORE
MEMBERS ONLY
DP Alert: UUP PMO SELL Signal - IT Indicators Toppy
by Erin Swenlin,
Vice President, DecisionPoint.com
The DecisionPoint Scoreboards remain completely "green". Hard to argue with the strength of this bull market in all three timeframes. However, the intermediate-term indicators are trying to top and have a negative crossover. ST indicators continue to fall. The Dollar looks very weak and it is getting more...
READ MORE
MEMBERS ONLY

TEN-YEAR TREASURY YIELD CLIMBS TO NINE-MONTH HIGH -- LONG-TERM TREASURY BOND CHART LOOKS BEARISH -- RELATIVE STRENGTH ANALYSIS SHOWS RISING RATES HURTING UTILITIES AND REITS -- BUT BOOSTING FINANCIALS
by John Murphy,
Chief Technical Analyst, StockCharts.com
10-YEAR TREASURY YIELD HITS NINE-MONTH HIGH ... Chart 1 shows the 10-Year Treasury yield climbing another 3 basis points today to the highest level since March (2.49%). That's most likely tied to the impending passage of the tax bill before Congress with expectations for faster economic growth and...
READ MORE
MEMBERS ONLY
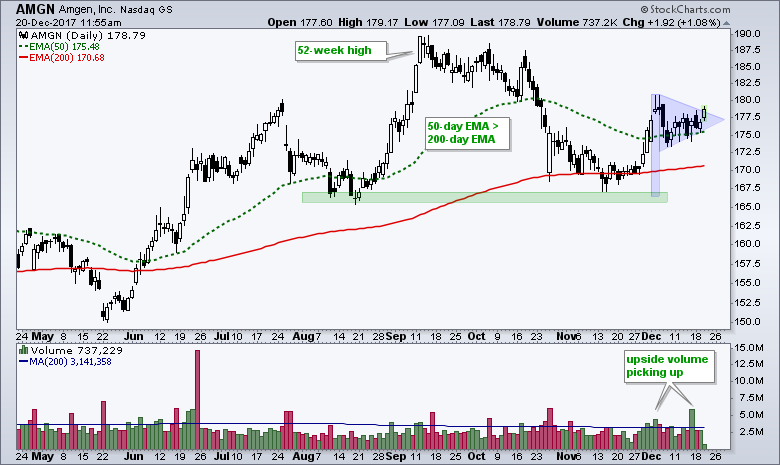
Amgen Goes for a Pennant Break
by Arthur Hill,
Chief Technical Strategist, TrendInvestorPro.com
Amgen (AMGN) is one of these stocks that is leading year-to-date, but lagging over the last three months. Year-to-date, the stock is up around 25% and the S&P 500 SPDR is up around 22%. Over the last three months, the stock is down around 4% and the S&...
READ MORE
MEMBERS ONLY
A Big Theme Emerges for 2018 - Long-term Price Targets (with Salt) for XLF and KRE
by Arthur Hill,
Chief Technical Strategist, TrendInvestorPro.com
* A Big Theme to Consider for 2018
* 10-yr T-Yield Targeted above 3%
* An Outsized Move for the 30-yr Yield
* Rising Rates Negative for Gold, XLU and IYR
* Rising Rates Positive for Finance Sector
* Price Targets for XLF and KRE
A Big Theme to Consider for 2018
The 20+ YR T-Bond...
READ MORE
MEMBERS ONLY
Treasury Yields Soar, On Verge Of Key Breakout
by Tom Bowley,
Chief Market Strategist, EarningsBeats.com
Market Recap for Tuesday, December 19, 2017
Housing data released the past couple days has been extremely hot with the housing price index well above expectations and then yesterday housing starts and building permits both easily surpassing Wall Street consensus estimates. This data has been expected by the stock market...
READ MORE
MEMBERS ONLY

Using Volatility Index Charts to Analyze Short-Term Trading Conditions
by Erin Swenlin,
Vice President, DecisionPoint.com
I am often asked why I use an inverted scale on my Volatility Index charts. The answer is that I find it to be an excellent overbought/oversold indicator in the short term when it's flipped. Typically it is said that if the VIX is low that is...
READ MORE
MEMBERS ONLY

10-YEAR BOND YIELD SURGES TO TWO-MONTH HIGH AND MAY BE ON VERGE OF UPSIDE BREAKOUT -- FOREIGN YIELDS ARE ALSO JUMPING -- THAT'S PUSHING BOND PRICES SHARPLY LOWER -- UTILITIES AND REITS ARE STARTING TO SHOW SERIOUS UNDERPERMANCE
by John Murphy,
Chief Technical Analyst, StockCharts.com
10-YEAR TREASURY YIELD SURGES... The daily bars in Chart 1 show the 10-Year Treasury yield ($TNX) jumping 7 basis points today to the highest level in two months in one of the biggest daily gains this year. That puts the yield within striking distance of its late October intra-day peak...
READ MORE
MEMBERS ONLY
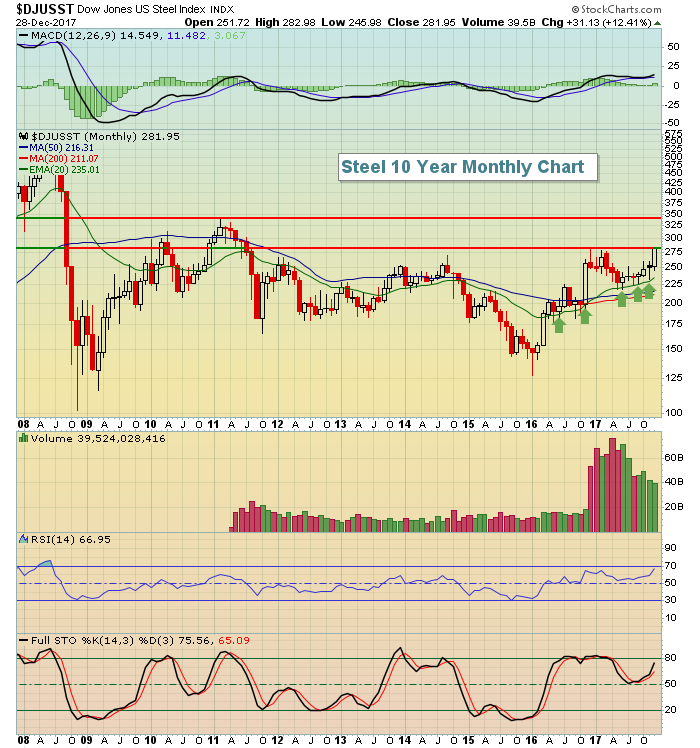
USX, Alcoa Lead Strong Materials Sector; Russell 2000 Breaks Out
by Tom Bowley,
Chief Market Strategist, EarningsBeats.com
Market Recap for Monday, December 18, 2017
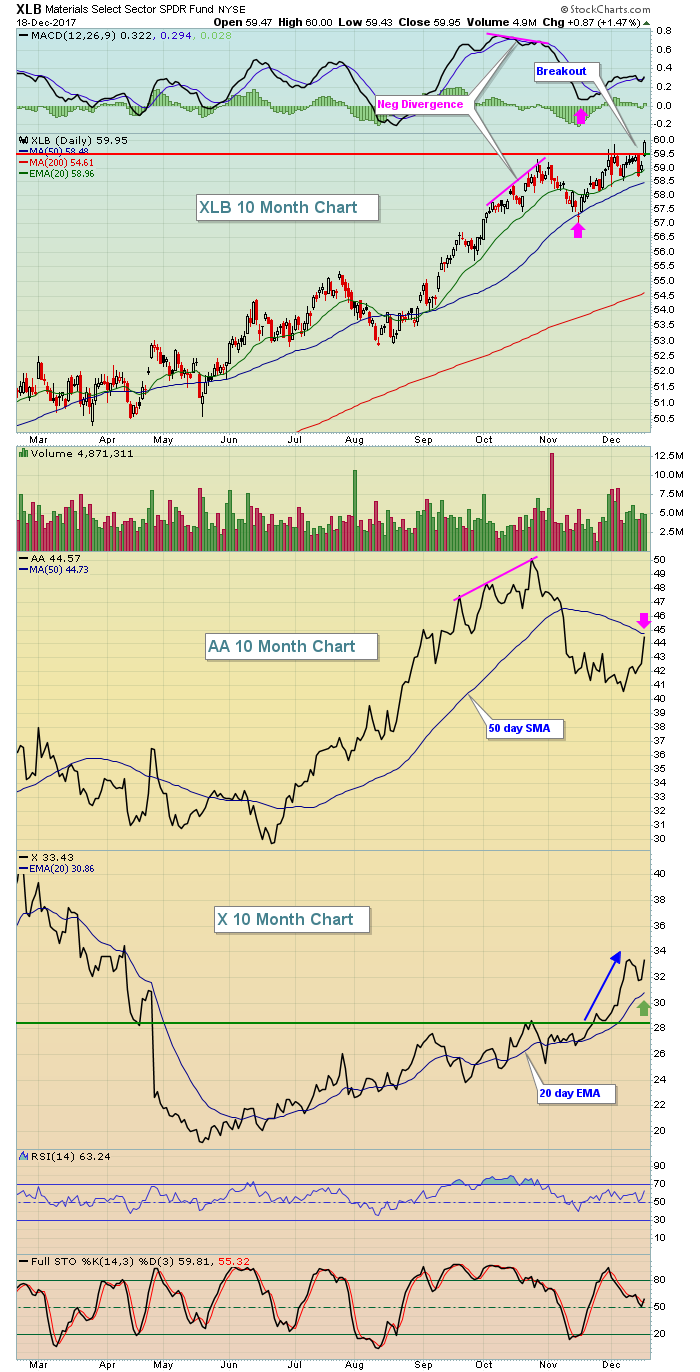
Rotation is powerful during bull markets and Monday's action was a perfect illustration. On November 15th, both the materials sector and small cap stocks were clear market laggards, but over the past 4-5 weeks we've seen both areas gather...
READ MORE
MEMBERS ONLY
Semis Surge - Biotech ETFs Struggle - Oil and XES Stall - H&R Block, Albemarle, Teekay and 4 More
by Arthur Hill,
Chief Technical Strategist, TrendInvestorPro.com
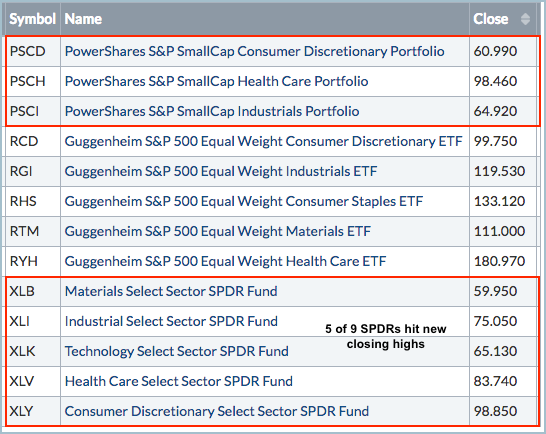
.... Small, Equal-weight and Large-cap Sector Leaders
.... Industry Group ETF Leaders
.... Semis Surge from Oversold Levels
.... Biotech ETFs Struggle, but Remain Bullish
.... Oil Consolidates within Uptrend
.... XES Forms Ascending Triangle
.... H&R Block Holds Breakout Zone
.... Albemarle Takes One Step Back
.... Teekay Bids to End Long Correction
.... Stocks to Watch:...
READ MORE