MEMBERS ONLY

Article Summaries: 7/2017 - 11/2017

by Greg Morris,
Veteran Technical Analyst, Investor, and Author
Periodically I write an article that reviews the past few months of articles. Why on Earth would I do this? Primarily for two reasons. One is that many new readers are involved and often they do not go back and look at the past articles. Two is that my articles...
READ MORE
MEMBERS ONLY

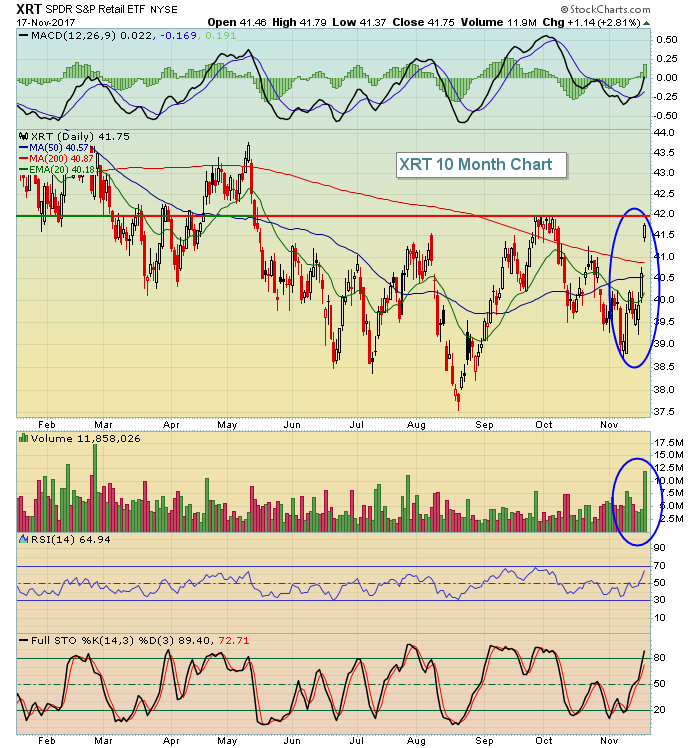
RETAIL SPDR CHALLENGES OCTOBER HIGH -- ITS LONGER RANGE CHART SUGGESTS BASING ACTIVITY -- APPAREL RETAILERS HAVE TURNED UP -- LEADERS INCLUDE BURLINGTON STORES, GAP, AND URBAN OUTFITTERS -- INVESTORS ARE BUYING TIPS AS A HEDGE AGAINST RISING INFLATION

by John Murphy,
Chief Technical Analyst, StockCharts.com
S&P 500 RETAIL SPDR ATTEMPTS UPSIDE BREAKOUT ... Retail stocks may have a strong holiday season after all. Chart 1 shows the S&P 500 Retail SPDR (XRT) trying to clear its early October high near 42. That would put it at the highest level in six months....
READ MORE
MEMBERS ONLY
Abbreviated Holiday Session Results In More Records

by Tom Bowley,
Chief Market Strategist, EarningsBeats.com
Market Recap for Friday, November 24, 2017
Wall Street was only open for half a day on Friday, but that didn't stop the bulls' momentum as all the major indices closed at fresh all-time highs. Amazon.com (AMZN) and a host of semiconductor stocks led the advance...
READ MORE
MEMBERS ONLY

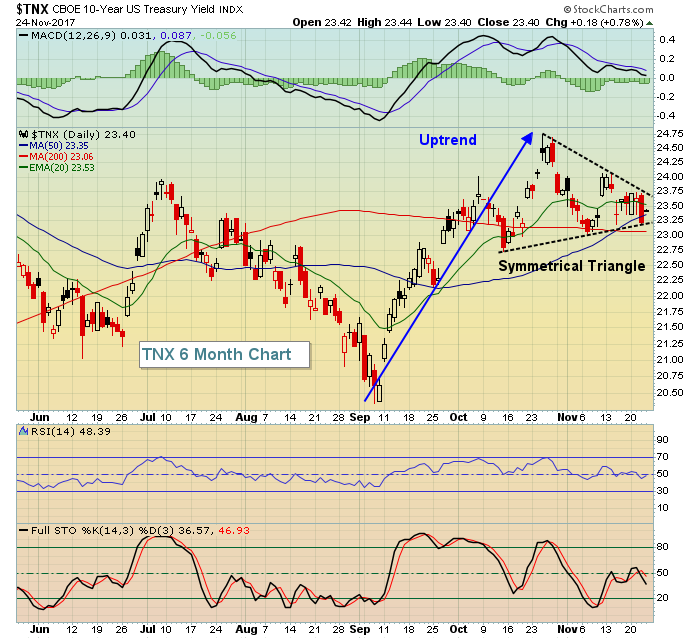
SEVERAL UNUSUAL FACTORS ARE CONTRIBUTING TO THE FLATTENING YIELD CURVE -- LOW INFLATION IS HELPING KEEP BOND YIELDS DOWN -- SO IS THE FACT THAT FOREIGN BOND YIELDS ARE MUCH LOWER THAN TREASURIES
by John Murphy,
Chief Technical Analyst, StockCharts.com
YIELD CURVE FALLS TO LOWEST LEVEL IN A DECADE ... I've been reading a lot about the yield curve falling to the lowest level since 2007 and the potential warning that carries. The green bars in Chart 1 plot the spread between 10-year and 2-year Treasury yields (the yield...
READ MORE
MEMBERS ONLY
DP Weekly Wrap: No Holiday Surprises

by Carl Swenlin,
President and Founder, DecisionPoint.com
Thanks mostly to a pop on Tuesday the market once again moved to new, all-time highs. Typical of holiday trading volume was lower than average, except for Tuesday, which had a surge confirming the price advance. Positive market action on a holiday week was no surprise, considering the persistent strength...
READ MORE
MEMBERS ONLY
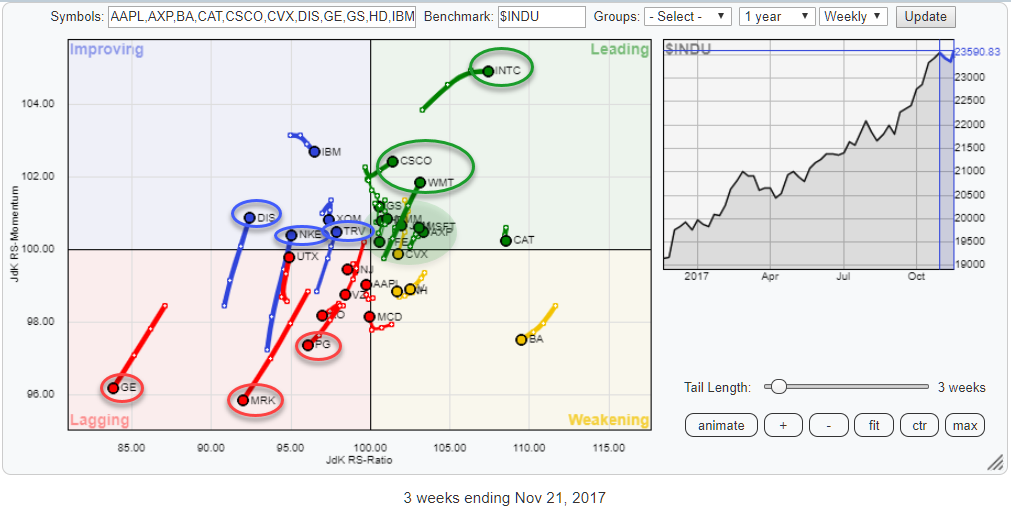
GE in freefall while WMT is shooting for the stars on Relative Rotation Graph for $INDU

by Julius de Kempenaer,
Senior Technical Analyst, StockCharts.com
Above is the Relative Rotation Graph for the DJ Industrials index, comparing the relative rotation of all members around $INDU.
On this chart, a few stocks stand out because of their clear directional moves.
Inside the leading quadrant, INTC, CSCO, and WMT are pulling away from the crowd further into...
READ MORE
MEMBERS ONLY

DOLLAR INDEX IS WEAKENING -- THAT MAY BE HELPING COMMODITIES -- THE BLOOMBERG COMMODITY INDEX IS BOUNCING OFF ITS 50-DAY AVERAGE -- CRUDE OIL TOUCHES TWO-YEAR HIGH -- ENERGY SPDR IS BOUNCING OFF CHART SUPPORT -- SO ARE TRANSPORTS AND FINANCIALS
by John Murphy,
Chief Technical Analyst, StockCharts.com
DOLLAR INDEX THREATENS ITS 50-DAY AVERAGE... The U.S. dollar is in retreat today against most major foreign currencies. Chart 1 shows the PowerShares Dollar Index Fund (UUP) threatening to drop below its 50-day moving average (blue line). That would be the first time the UUP has slipped below that...
READ MORE
MEMBERS ONLY
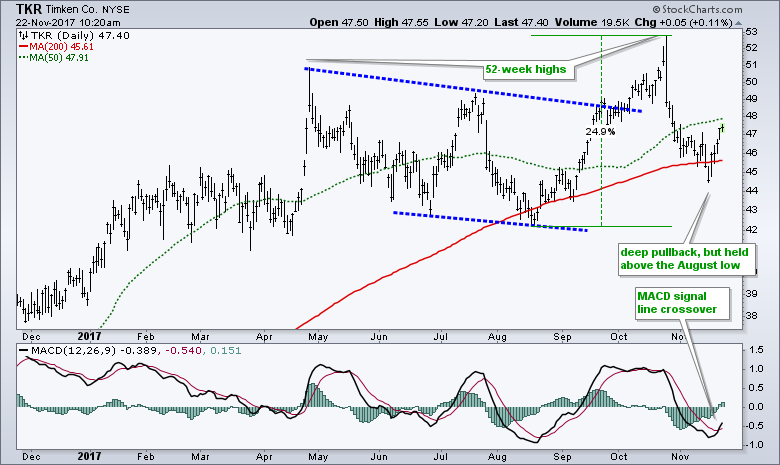
Timken Surges off Rising 200-day SMA

by Arthur Hill,
Chief Technical Strategist, TrendInvestorPro.com
Timken (TKR), a mid-cap industrial, looks like it is resuming its bigger uptrend with a surge off the 200-day SMA. The chart below shows the stock hitting 52-week highs in April and October. The October high formed after a channel breakout and 25% advance. Timken then corrected with a rather...
READ MORE
MEMBERS ONLY
The Superfecta: All Four Major Indices Print All-Time Record Highs
by Tom Bowley,
Chief Market Strategist, EarningsBeats.com
Market Recap for Tuesday, November 21, 2017
I am traveling for the Thanksgiving Day holiday, so today's article will be brief. I hope everyone has a very Happy Thanksgiving! Enjoy your family and friends and please be safe. :-)
It was a very bullish day on Wall Street...
READ MORE
MEMBERS ONLY
DP Bulletin #2: Here and Gone...NDX Switches Back to PMO BUY Signal

by Erin Swenlin,
Vice President, DecisionPoint.com
You know you're in trouble when you wake up and find a snarky tweet about the timeliness of a particular signal change. That was the case this morning when I got the tweet about the NDX PMO SELL signal that arrived after the market closed yesterday. Today, the...
READ MORE
MEMBERS ONLY

Small Caps Break To The Upside Big Time

by Martin Pring,
President, Pring Research
* Small Caps breaking out
* Gold and Silver may be close to a resolution to their recent rangebound activity
* Euro in a real dilemma but with a bullish bias
In sorting through a number of charts I recently came across some potential price patterns that are developing in several key markets....
READ MORE
MEMBERS ONLY
Financials And Industrials Lead As Slowing Momentum Issues Subside
by Tom Bowley,
Chief Market Strategist, EarningsBeats.com
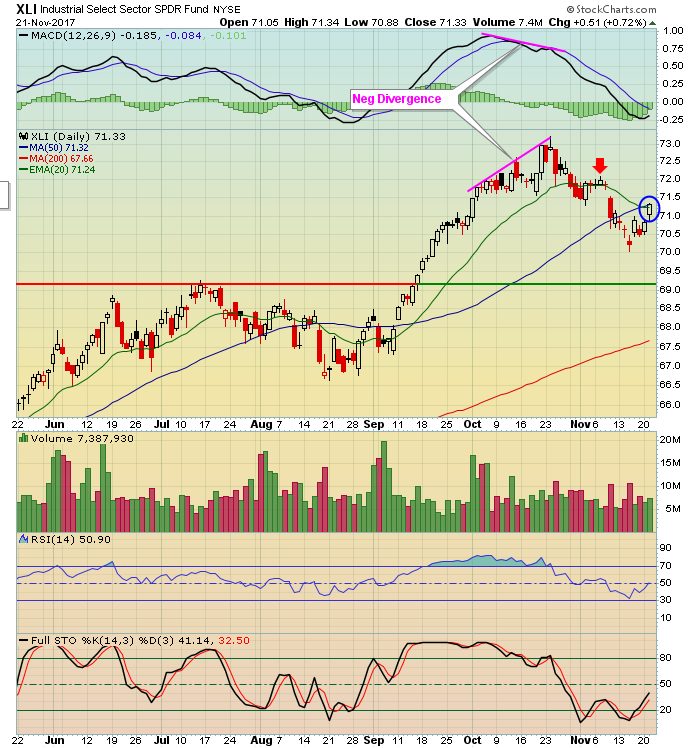
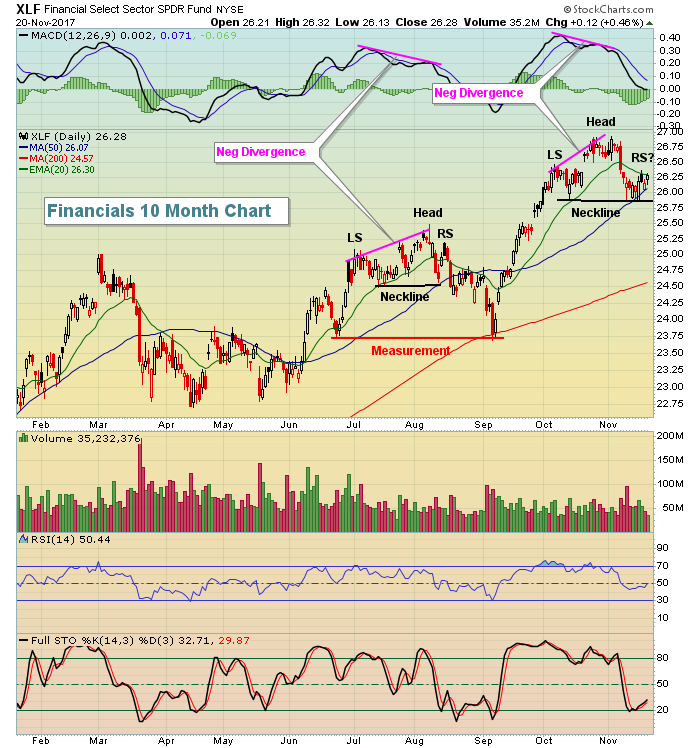
Market Recap for Monday, November 20, 2017
It had been awhile since financials (XLF, +0.46%) and industrials (XLI, +0.45%) were the top two performing sectors during a market session, but that's exactly what we saw on Monday. Welcome back! Both the XLF and XLI had serious...
READ MORE
MEMBERS ONLY
DP BULLETIN: NDX Generates PMO SELL Signal
by Erin Swenlin,
Vice President, DecisionPoint.com
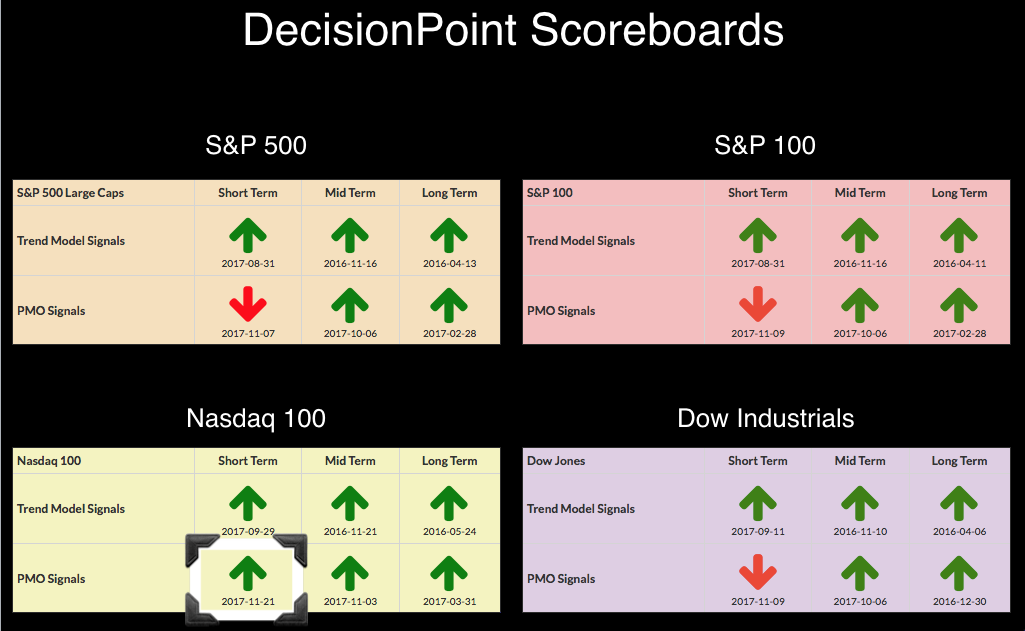
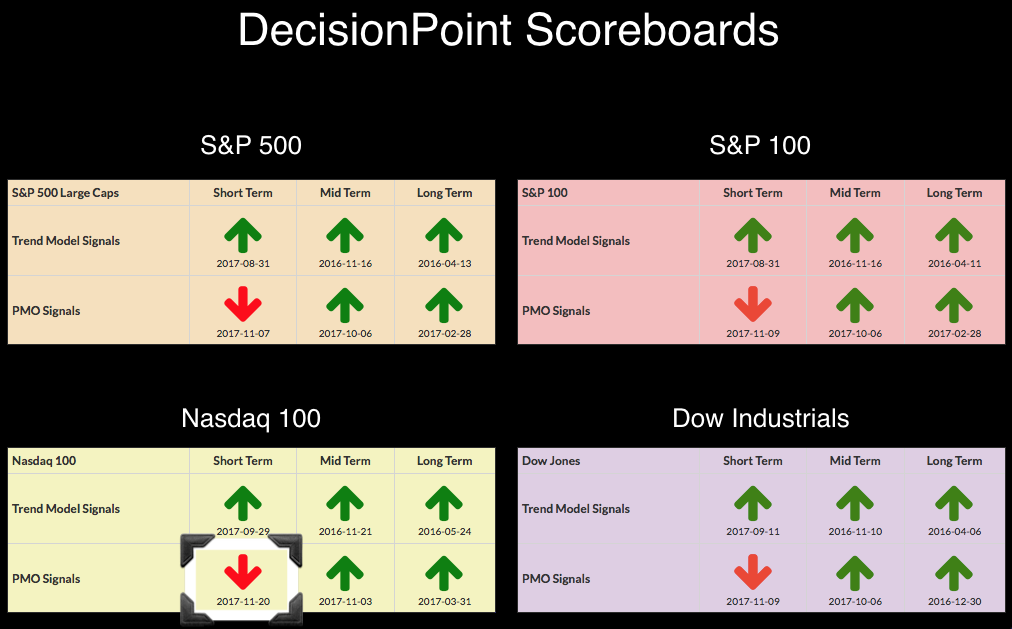
As promised to the MarketWatchers LIVE viewers and my DecisionPoint Faithful, I am updating you on the latest DP Scoreboard signal change. The NDX's momentum finally deteriorated enough to generate a PMO SELL Signal.
The other three indexes (SPX, OEX, INDU) triggered PMO SELL signals earlier this month....
READ MORE
MEMBERS ONLY

Natural Gas Follows Crude?

by Bruce Fraser,
Industry-leading "Wyckoffian"
In the prior post, we evaluated Crude Oil which appeared to have completed a Reaccumulation. Natural Gas has a family resemblance to Crude Oil, but seems to be in a slightly different position. Early in 2016 $NATGAS and $WTIC began important rallies that lasted through the year and then entered...
READ MORE
MEMBERS ONLY
Friday: The Tale Of Two Markets
by Tom Bowley,
Chief Market Strategist, EarningsBeats.com
Market Recap for Friday, November 17, 2017
It was an interesting day on Friday. While most of our major indices struggled and finished in negative territory with the Dow Jones, S&P 500 and NASDAQ falling 0.43%, 0.26% and 0.15%, respectively, the Russell 2000 continued its...
READ MORE
MEMBERS ONLY
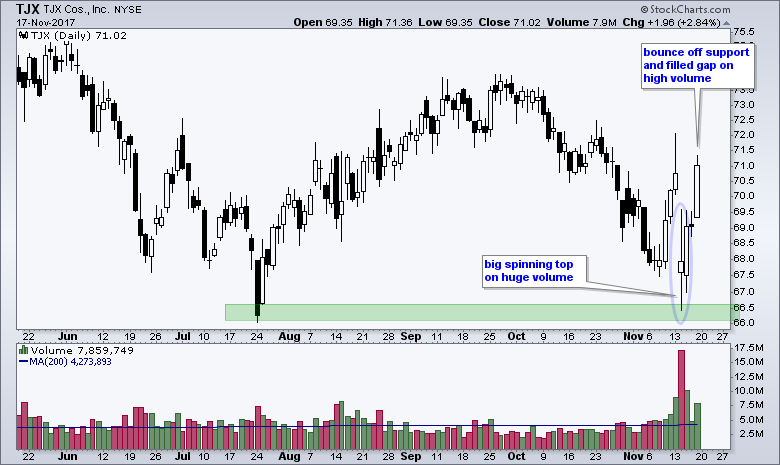
TJX Companies Reverses with Big Spinning Top
by Arthur Hill,
Chief Technical Strategist, TrendInvestorPro.com
Retail stocks surged last week and discounter TJX Companies ($TJX) bounced off support with high volume. Technically, the big trend is still down because the 50-day EMA is below the 200-day EMA and TJX is below the 200-day EMA. These EMAs are not shown on the chart to keep it...
READ MORE
MEMBERS ONLY
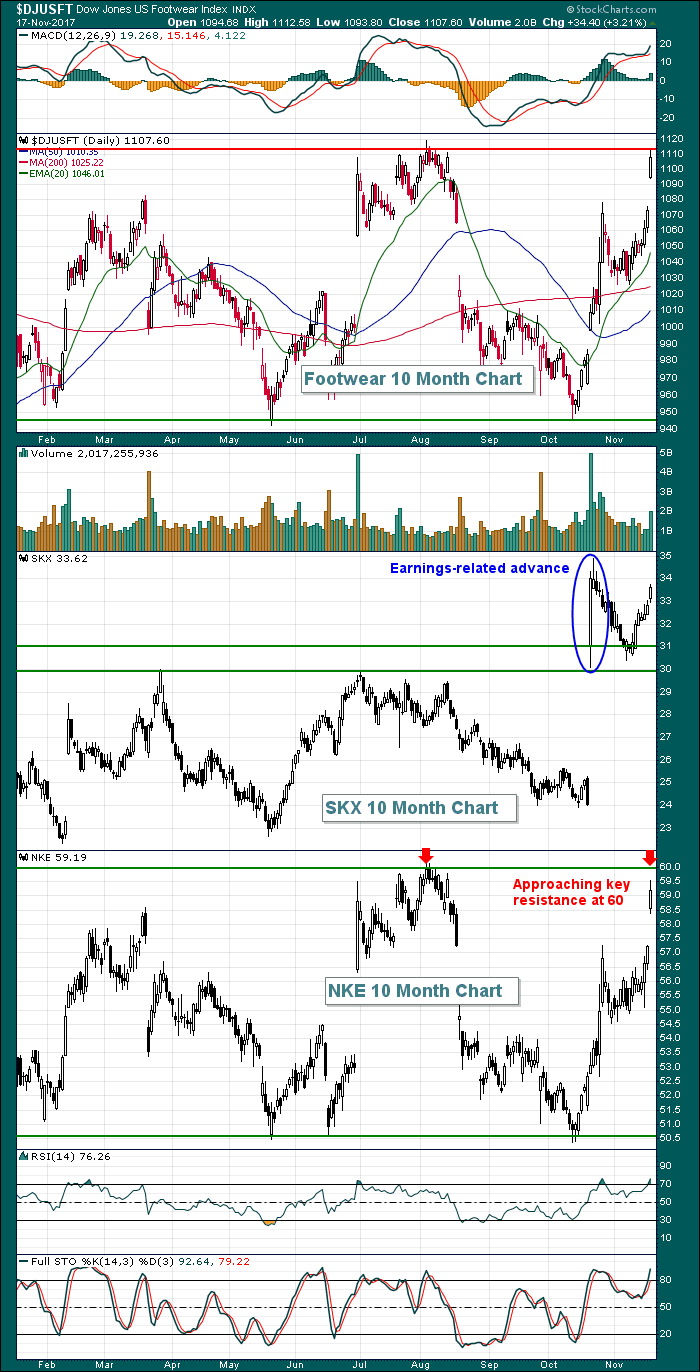
Nike, Skechers Lead Rally In Footwear Stocks
by Tom Bowley,
Chief Market Strategist, EarningsBeats.com
Skechers (SKX) rallied approximately 40% after its most recent quarterly earnings report and Nike (NKE) has gone from 2017 lows to nearly a 2017 high in the past five weeks, highlighting a significant rally in the Dow Jones U.S. Footwear Index ($DJUSFT). The DJUSFT rallied 3.21% on Friday...
READ MORE
MEMBERS ONLY
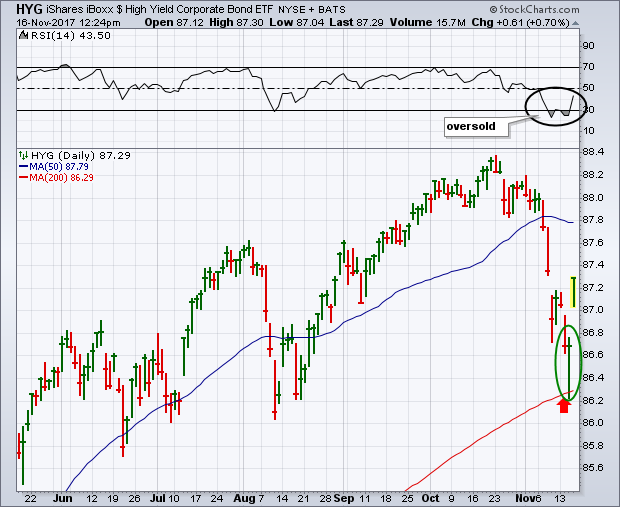
High Yield Bond ETF is Bouncing Sharply Off Support, Telecom Weakest Sector
by John Murphy,
Chief Technical Analyst, StockCharts.com
The recent selloff in high yield junk bonds has attracted a lot of attention in the financial media. My Tuesday message showed the iBoxx High Yield Corporate Bond iShares (HYG) headed down for a test of chart support at its August low and its 200-day moving average. Chart 1 shows...
READ MORE
MEMBERS ONLY
Focusing on Solid Earnings can Boost your Risk Adjusted Returns

by John Hopkins,
President and Co-founder, EarningsBeats.com
One by-product of focusing on stocks that beat earnings handily is the opportunity to boost overall returns. I know this for a fact as we studied the performance of almost 40 stocks that were trade alerts to EarningsBeats members over the past six months and found that on a risk...
READ MORE
MEMBERS ONLY
Here Are Five S&P 500 Stocks Poised To Rise Through December
by Tom Bowley,
Chief Market Strategist, EarningsBeats.com
I'm a big historian and a fan of the "history repeats itself" theory. But I'm a bigger fan of technical analysis where price action simply doesn't lie. You can listen to all the CNBC "hype" if you'd like,...
READ MORE
MEMBERS ONLY
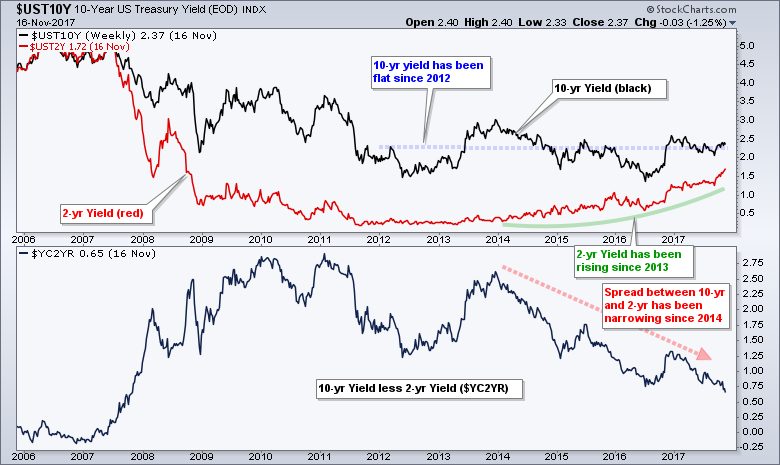
What Does a Flat Yield Curve Look Like Anyway?
by Arthur Hill,
Chief Technical Strategist, TrendInvestorPro.com
I hear talk that the yield curve is flattening and that this is a problem for the stock market. While it is true that the spread between the 10-yr T-Yield ($UST10Y) and 2-yr T-Yield ($UST2Y) is the lowest since 2007, the yield curve itself is by no means flat. The...
READ MORE
MEMBERS ONLY
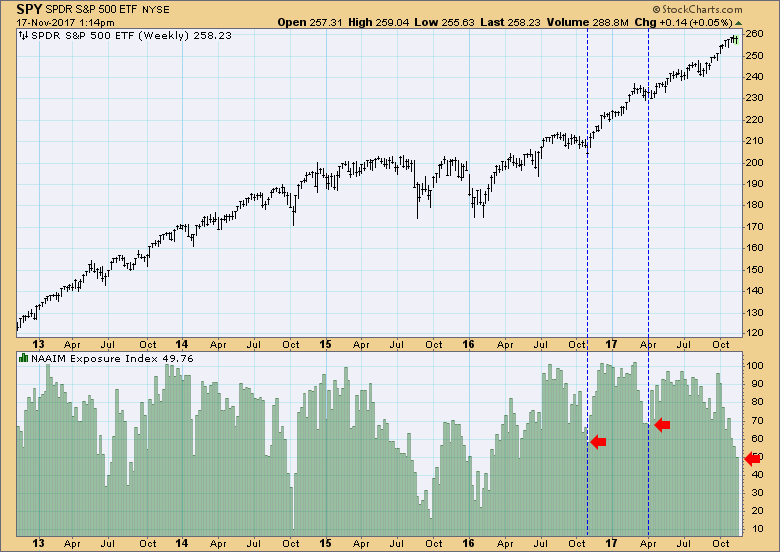
DP Weekly Wrap: Incongruous Sentiment
by Carl Swenlin,
President and Founder, DecisionPoint.com
When I posted the NAAIM (National Association of Active Investment Managers) Exposure Index this week, I thought to myself, "What's wrong with this picture?". To clarify, rather than stay fully invested all the time, NAAIM members adjust their exposure based upon their assessment of market conditions,...
READ MORE
MEMBERS ONLY
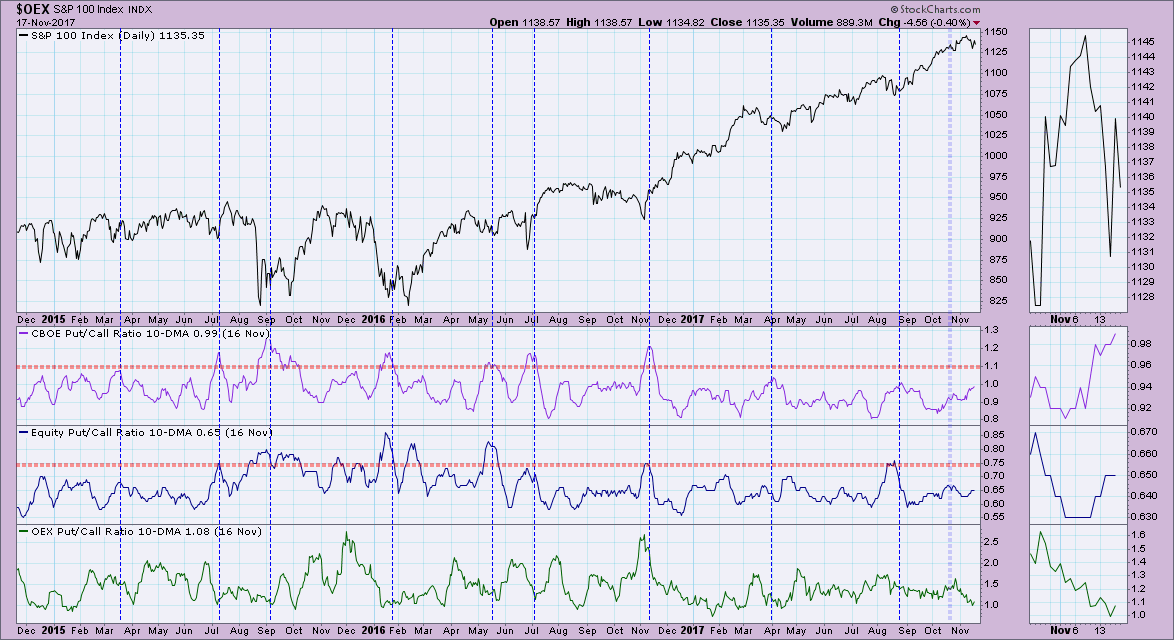
Sentiment Is Almost Bearish Enough
by Erin Swenlin,
Vice President, DecisionPoint.com
Sentiment charts haven't been all that enlightening with mostly neutral readings. However, we are reaching bearish levels that generally result in a rally. Here's my interpretation of the latest sentiment from the put/call ratios, AAII, NAAIM and Rydex Ratio.
What I pointed out in today&...
READ MORE
MEMBERS ONLY

Buffett-isms and Bezos-isms: Great Investing Insights

by Gatis Roze,
Author, "Tensile Trading"
“Rule #1: Never lose Money.”
“Rule #2: Never forget Rule #1.”
—Warren Buffett
Sure, a lot of investors dissect every word that Warren Buffett writes in the annual report for Berkshire Hathaway. For years, these Buffett-isms have provided investors with profitable insights. In a similar vein, I found that the...
READ MORE
MEMBERS ONLY

Weekly Market Review & Outlook (with Video) - Small Caps and Retailers Take the Lead - Energy Hits Moment of Truth
by Arthur Hill,
Chief Technical Strategist, TrendInvestorPro.com
.... Broad Strength in the Nasdaq 100
.... IJR Bounces from Oversold Levels
.... Small-cap Sector Leaders
.... Healthcare and Consumer Discretionary Surge
.... Retail SPDR Goes for a Bottom
.... Starbucks, Nike and Disney Power XLY Higher
.... SPY Bounces as QQQ Hits New High
.... Four Sectors Correct (XLF, XLI, XLB, XLV)
.... Bobby, Billy and Arthur...
READ MORE
MEMBERS ONLY
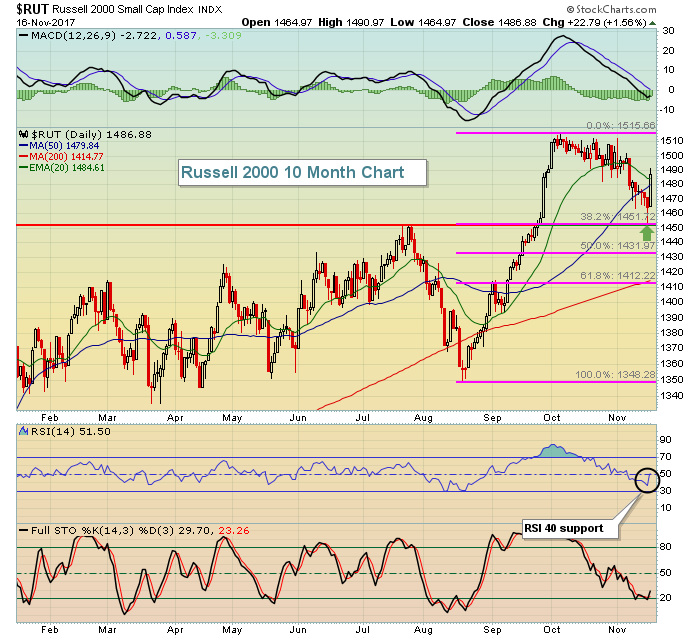
Russell 2000 Soars After Nearing Initial Fibonacci Retracement Level
by Tom Bowley,
Chief Market Strategist, EarningsBeats.com
Market Recap for Thursday, November 16, 2017
U.S. indices spiked sharply higher on Thursday's open in contrast to many recent days where the bulls have found themselves underwater in early action, trying to reclaim control of the action throughout the balance of the session. Yesterday, there wasn&...
READ MORE
MEMBERS ONLY
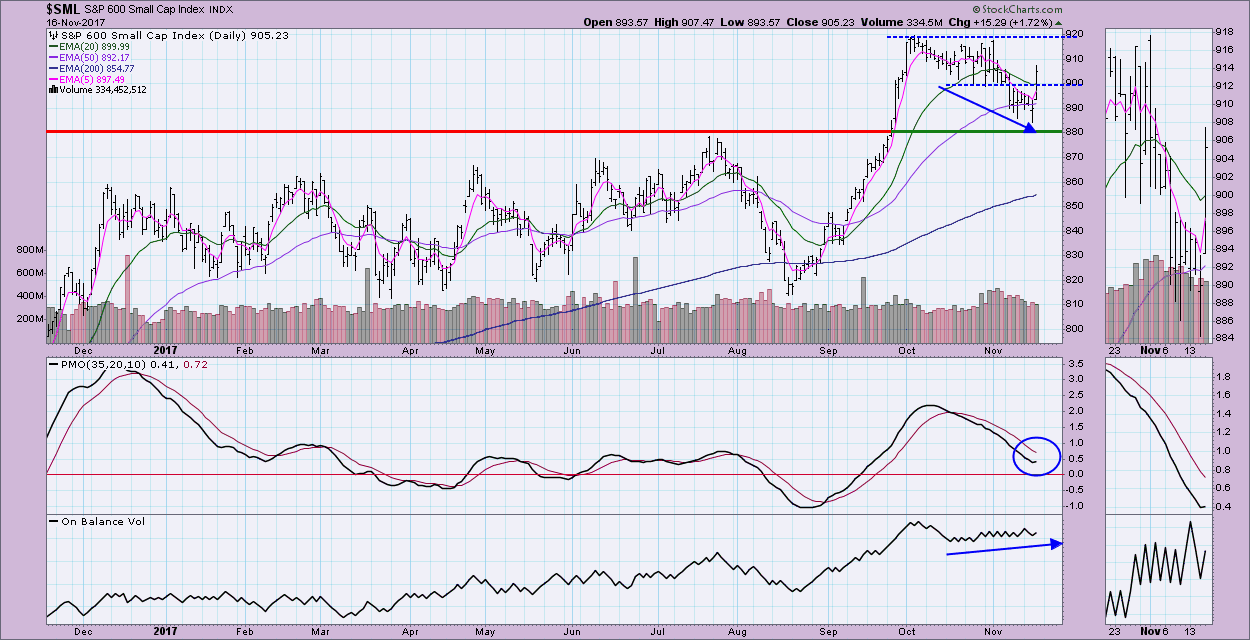
S&P 600 Bounces Off Support - IT Indicators Oversold
by Erin Swenlin,
Vice President, DecisionPoint.com
I had this article in the queue yesterday with the headline "S&P 600 Nearing Important Support". Well, it turned out to be a bounce off that support today. Small-caps have been hit hard while most large-cap indexes spent the last month consolidating and moving slightly lower....
READ MORE
MEMBERS ONLY

GLOBAL STOCKS ARE HAVING A STRONG DAY -- HIGH YIELD BOND ETF IS BOUNCING SHARPLY OFF CHART SUPPORT -- MOST OF ITS RECENT SELLING HAS BEEN IN THE TELECOM SECTOR -- INDIVIDUAL TELECOM STOCKS ARE REBOUNDING FROM OVERSOLD CONDITIONS
by John Murphy,
Chief Technical Analyst, StockCharts.com
HIGH YIELD BOND ISHARES BOUNCE SHARPLY OFF 200-DAY AVERAGE... The recent selloff in high yield junk bonds has attracted a lot of attention in the financial media. My Tuesday message showed the iBoxx High Yield Corporate Bond iShares (HYG) headed down for a test of chart support at its August...
READ MORE
MEMBERS ONLY
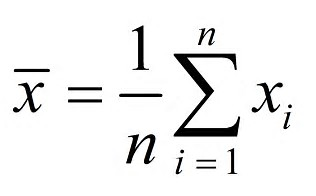
The Deception of Average
by Greg Morris,
Veteran Technical Analyst, Investor, and Author
I mentioned in the last article I would discuss ‘average’ soon; so here it is, sooner than I thought.
The “World of Finance” is fraught with misleading information. The use of average is one that needs a discussion. Chart A is a chart showing the compounded rates of return for...
READ MORE
MEMBERS ONLY
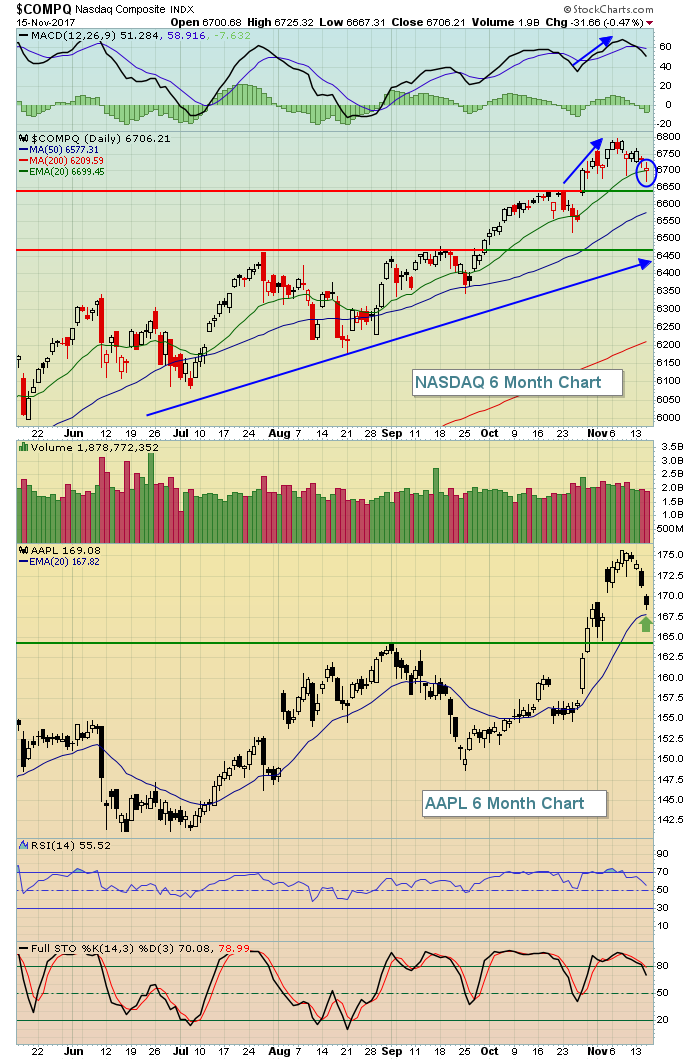
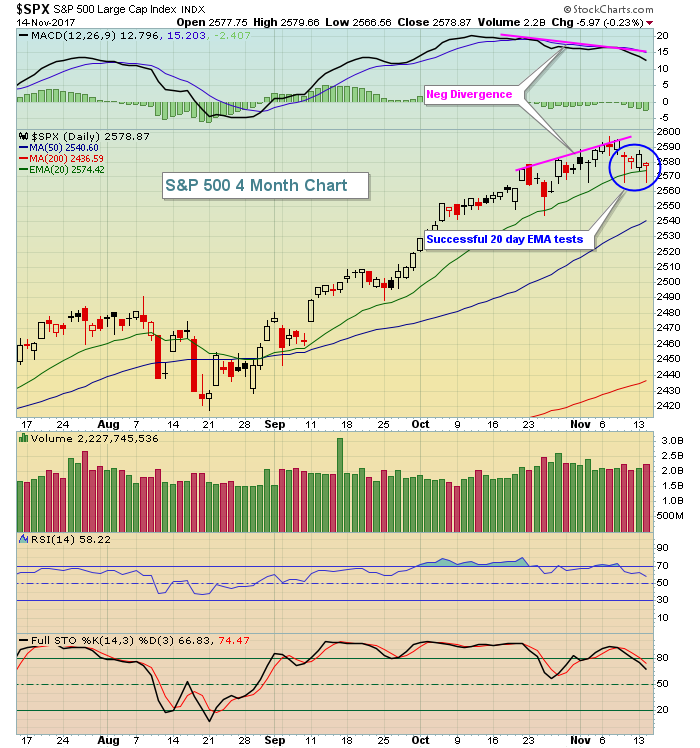
Selling Grips Wall Street, Key Moving Average Lost
by Tom Bowley,
Chief Market Strategist, EarningsBeats.com
Market Recap for Wednesday, November 15, 2017
Eight of nine sectors lost ground on Wednesday and while that, along with a couple major indices closing beneath their respective 20 day EMAs, might be cause for concern, I actually thought much of the action was bullish. First and foremost, the tech-heavy...
READ MORE
MEMBERS ONLY
A Raging Battle in the Bond Market - Junk Bond Update - Big Banks - Copper - Biotechs - Disney
by Arthur Hill,
Chief Technical Strategist, TrendInvestorPro.com
.... A Raging Battle in the Bond Market
.... Junk Bond Update
.... Big Banks Shrug off Yield Plunge
.... Copper Corrects with Bullish Wedge
.... And then there were Three
.... Biotech SPDR Becomes Oversold Again
.... Competition Increasing for NetFlix
.... Disney Goes for Lift Off ....
A Raging Battle in the Bond Market
There is a...
READ MORE
MEMBERS ONLY
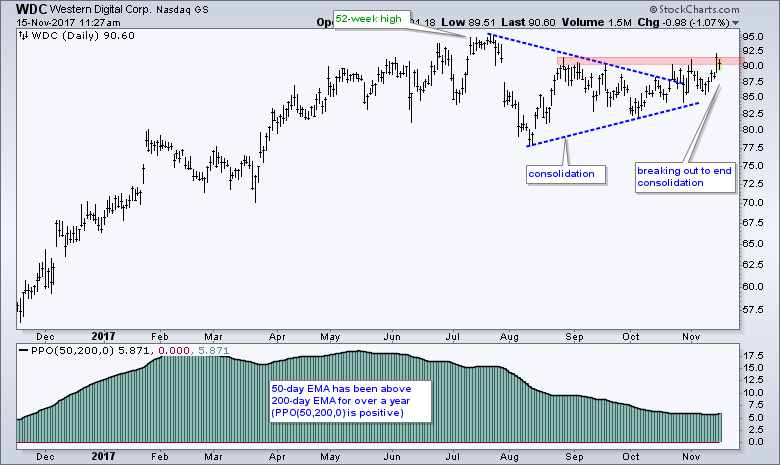
Western Digital Breaks Out of Continuation Pattern
by Arthur Hill,
Chief Technical Strategist, TrendInvestorPro.com
Western Digital (WDC) appears to be emerging from a consolidation pattern and this increases the chances of new highs in the coming weeks. The chart shows WDC hitting a new high in July and then falling with a rather sharp decline into early August. The stock immediately rebounded after this...
READ MORE
MEMBERS ONLY
Technology Weakening, But How Much Selling Might We Expect?
by Tom Bowley,
Chief Market Strategist, EarningsBeats.com
Market Recap for Tuesday, November 14, 2017
For the third time in the last four days, we saw U.S. equities gap lower, only to reverse intraday to close near their highs of the session. It's still resulted in losses for the day, but it also shows the...
READ MORE
MEMBERS ONLY

Commodities: Are They About To Experience A Pause?
by Martin Pring,
President, Pring Research
The long-term picture
* Is the stock market smarter than the commodity market?
* Commodity indexes short-term overbought
The long-term picture
Since mid-summer, commodity prices reflected in broadly based indexes such as the CRB ($CRB), Bloomberg Commodity ETN (DJP) or the DB Commodity ETF (DBC) have been on a tear. However, short-term...
READ MORE
MEMBERS ONLY

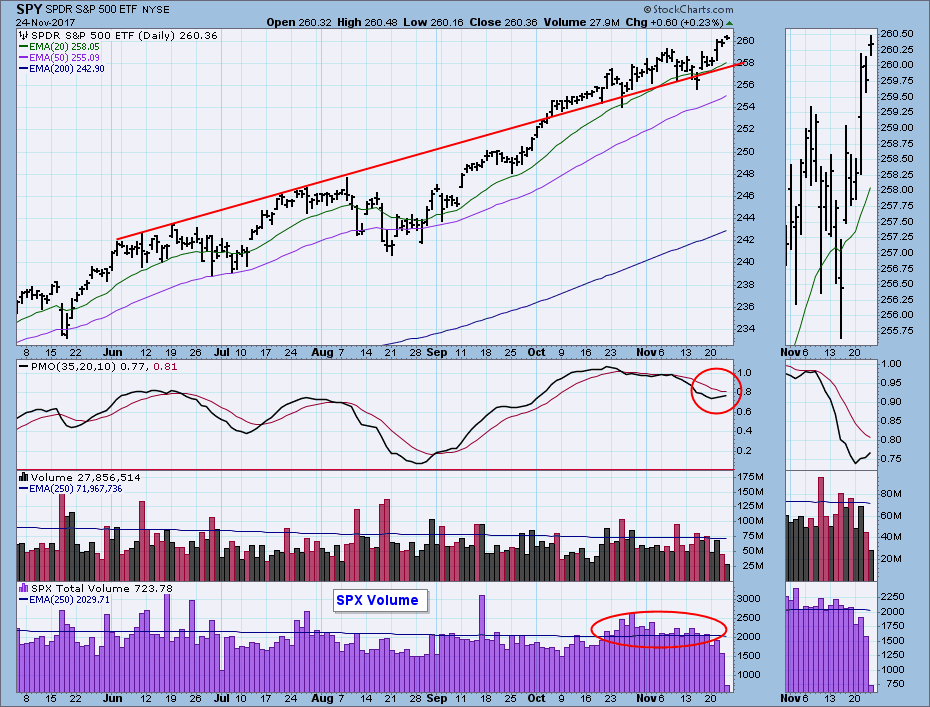
DP Alert: SPY Rising Trend Channel Broken - DP Indicators Bearish in ST and IT - PMO SELL on UUP
by Erin Swenlin,
Vice President, DecisionPoint.com
Since November 9th, the DP Scoreboards have been quiet. It isn't surprising to see the weakness on these Scoreboards to be short-term momentum given the recent decline. The SPY/SPX have now dropped below rising trend channels, but support remains. With DP indicators looking bearish, we could be...
READ MORE
MEMBERS ONLY

STOCKS TAKE ON A MORE DEFENSIVE TONE AS STAPLES AND UTILITIES TAKE THE LEAD -- UTILITIES HIT NEW RECORD -- JUNK BOND SELLOFF IS ANOTHER CAUTION SIGNAL -- SELLOFF IN DOLLAR MAY BE PUSHING SOME DEFENSIVE MONEY BACK INTO GOLD
by John Murphy,
Chief Technical Analyst, StockCharts.com
UTILITIES HIT NEW RECORD ... With the rest of the market on the defensive, utility stocks are having another strong day. Chart 1 shows the Utilities Sector SPDR (XLU) climbing to another record high today. Utilities are the day's strongest sector (along with consumer staples), while all other sectors...
READ MORE
MEMBERS ONLY
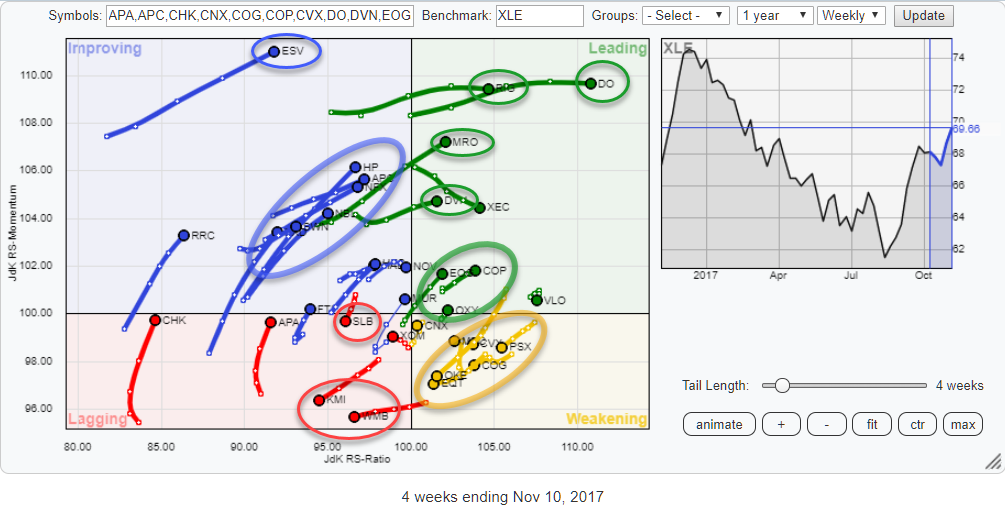
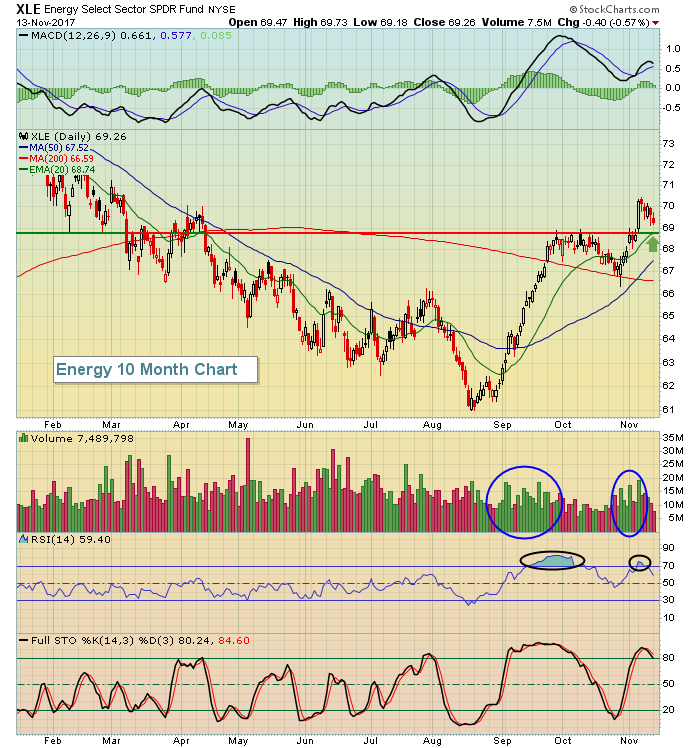
Energy sector bursting into leading quadrant on Relative Rotation Graph, strong potential for EOG and COP
by Julius de Kempenaer,
Senior Technical Analyst, StockCharts.com
The Relative Rotation Graph above shows all the members of the S&P 500 Energy sector against XLE, the ETF that tracks the Energy sector price index.
The main reason for looking at this universe at the moment is the fact that the sector (XLE) on the RRG for...
READ MORE
MEMBERS ONLY
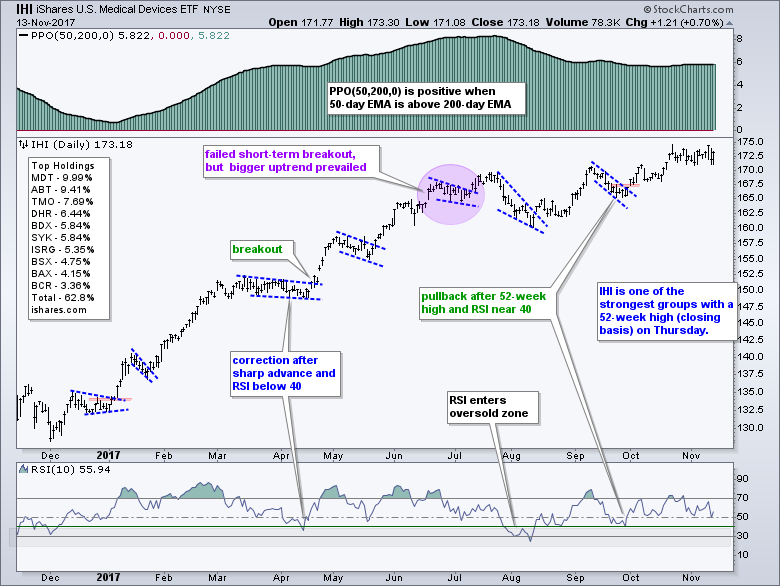
Dissecting the Medical Devices Group - Discount Brokers with Bullish Continuation Patterns - Banks, Gold, Utes and the 10-yr Yield
by Arthur Hill,
Chief Technical Strategist, TrendInvestorPro.com
.... Medical Devices Group Leads Healthcare
.... Medtronic Bids to End Correction
.... Abbot Labs Leads Medical Device Group
.... Boston Scientific Bounces from Oversold Levels
.... Four Medical Device Stocks (WAT, VAR, ALOG, CMD)
.... First Oversold Readings Since Breakouts (BMY, BIIB)
.... Discount Brokers Consolidate within Uptrends
.... Banks, Utilities, Gold and the 10-yr T-Yield ....
Medical...
READ MORE
MEMBERS ONLY
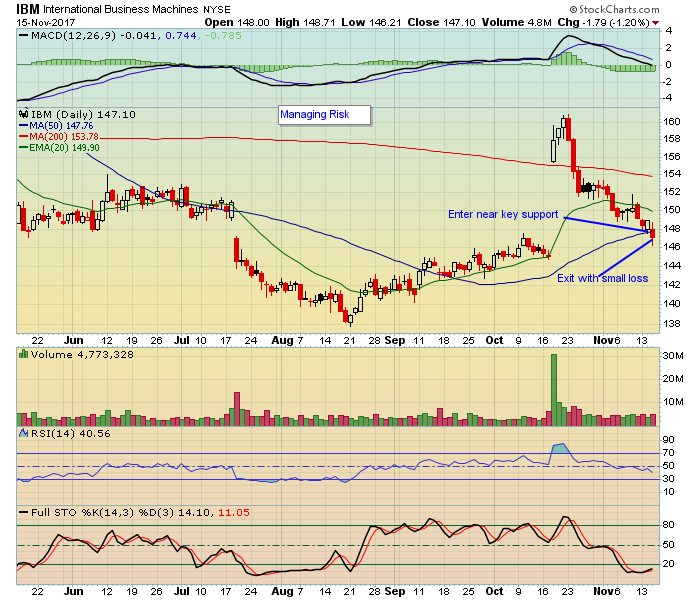
Industrials Are Teaching Us How To Evaluate Risk....If We'll Listen
by Tom Bowley,
Chief Market Strategist, EarningsBeats.com
Reminder
If you enjoy my blog, be sure to subscribe at the bottom of this article! Just type in your email address and click on the green "Notify Me!" button. My articles will then be sent to your email immediately upon publishing! It's 100% free and...
READ MORE
MEMBERS ONLY
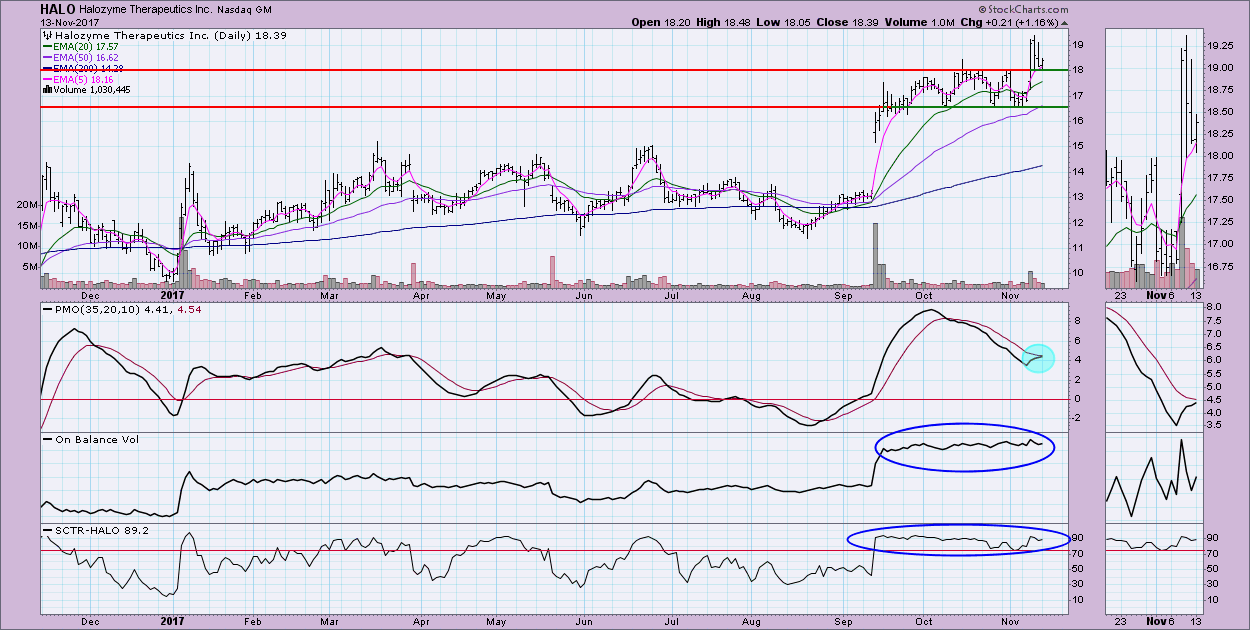
HALO - Angel or Devil?
by Erin Swenlin,
Vice President, DecisionPoint.com
As part of the MarketWatchers LIVE show (airs M-F, 12p-1:30p - You'll find today's recording under the "Webinars" tab), Tom Bowley and I come up with set-ups on Monday. We call the segment "Monday Set-Ups". This segment has an eye toward...
READ MORE