MEMBERS ONLY

Only One Group Has Shown Consistent Relative Strength For The Past Year

by Tom Bowley,
Chief Market Strategist, EarningsBeats.com
When I look back at leading industry groups for the past day, week, month, 3-month, 6-month, and 1-year periods, only one industry group has been among the Top 20 industry groups for each of those 6 different periods. It's a group that I liked heading into 2024 and...
READ MORE
MEMBERS ONLY

The Best Five Sectors, #3

by Julius de Kempenaer,
Senior Technical Analyst, StockCharts.com
KEY TAKEAWAYS
* Energy replaces Technology in top-5
* Financials rise to #2 position pushing XLC down to #3
* Top-5 portfolio out-performs SPY 0.52%
* A closer look at the (equal) weighting scheme
Energy Replaces Technology
At the end of this week, 1/17/2024, the Technology sector dropped out of the...
READ MORE
MEMBERS ONLY

Mid-Caps Make a Statement with a Breadth Thrust

by Arthur Hill,
Chief Technical Strategist, TrendInvestorPro.com
KEY TAKEAWAYS
* Short-term breadth became oversold in mid December.
* Stocks surged this week with mid-caps triggering a bullish breadth thrust.
* A small bullish divergence preceded the breadth thrust.
Mid-caps show leadership and were the first to trigger a breadth thrust. Stocks surged this week with mid-caps showing the highest participation...
READ MORE
MEMBERS ONLY

How the S&P 500 Reaches 6500 By March 2025

by David Keller,
President and Chief Strategist, Sierra Alpha Research
KEY TAKEAWAYS
* The S&P 500 experienced a sudden upside reversal to finish the week right around the 6000 level.
* If the market reacts positively to earnings, and Trump's new administration takes a more conservative approach, we could see the S&P 500 reach 6500 by...
READ MORE
MEMBERS ONLY

DexCom Stock Rises From the Ashes: A Breakout You Can't Ignore

by Tony Zhang,
Chief Strategist, OptionsPlay
As advancements in medical technology continue to shape the healthcare landscape, DexCom, Inc. (DXCM) stands out with its innovative continuous glucose monitoring solutions. Recent price action suggests that DXCM's stock price has triggered a potentially new bullish run. In this article, I will examine the technical and fundamental...
READ MORE
MEMBERS ONLY

Long Bonds Continue to Break Down

by Carl Swenlin,
President and Founder, DecisionPoint.com
The trouble with bonds is best portrayed by this long-term chart. Bonds were in a rising trend for about forty years, but the trend line was broken in 2022. This breakdown and subsequent price activity implies that bonds are going to be in a long-term falling trend for years to...
READ MORE
MEMBERS ONLY

Quantum Computing: Top Stocks You Should Watch Now!

by Jayanthi Gopalakrishnan,
Director of Site Content, StockCharts.com
KEY TAKEAWAYS
* Quantum computing stocks may be bouncing back.
* Four stocks made it to the Top 10 SCTR Report in the mid-cap category.
* Watch for quantum computing stocks to gain momentum and revisit their 52-week highs.
Jensen Huang may have burst the quantum computing bubble when he said it would...
READ MORE
MEMBERS ONLY

What Would It Take For Small Caps to Lead?
by David Keller,
President and Chief Strategist, Sierra Alpha Research
KEY TAKEAWAYS
* Financials represent one of the top sector weights in the IWM, and banks have kicked off earnings season with renewed strength.
* A resurgence in biotech stocks, one of the largest industries represented in the IWM, could provide an upside catalyst.
* US Dollar strength could adversely impact mega cap...
READ MORE
MEMBERS ONLY

The Financial Sector's Bullish Comeback: Is It Time to Start Looking at Bank Stocks?

by Karl Montevirgen,
The StockCharts Insider
KEY TAKEAWAYS
* The Bullish Percentage Index for Financials made a dramatic jump on Wednesday.
* Positive bank earnings plus encouraging CPI and PPI data are driving market optimism.
* Citigroup stock notched a 52-week high, making the stock worth analyzing.
One effective way to spot potential market opportunities on a sector level...
READ MORE
MEMBERS ONLY

How to Find a BUY Signal Using The 1-2-3 Reversal Pattern

by Joe Rabil,
President, Rabil Stock Research
In this exclusive StockCharts video, Joe demonstrates how to use the 1-2-3 reversal pattern as a buy signal on the weekly chart. This approach can be used when the monthly chart is in a strong position. Joe shares how to use MACD and ADX to help when the trendline pattern...
READ MORE
MEMBERS ONLY

Investors Await CPI and Bank Earnings: Will They Spark Investor Optimism?
by Jayanthi Gopalakrishnan,
Director of Site Content, StockCharts.com
KEY TAKEAWAYS
* Broader stock market indexes are seeing a lot of choppy activity.
* December CPI and bank earnings are on deck and could move the markets.
* The interest rate-sensitive banking sector will be impacted by CPI and bank earnings.
The December Producer Price Index (PPI) came in cooler than expected,...
READ MORE
MEMBERS ONLY
The Bullish Case for Small Caps vs. Large Caps
by David Keller,
President and Chief Strategist, Sierra Alpha Research
Will small cap stocks finally take on a leadership role in 2025? In this video, Dave provides a thorough technical analysis discussion of the Russell 2000 ETF (IWM) and how that compares to the current technical configuration of the S&P 500 index. He also shares three charts he&...
READ MORE
MEMBERS ONLY

Gold Prices: De-Dollarization, Inflation, and $3,000 Gold—What You Need to Know Now
by Karl Montevirgen,
The StockCharts Insider
KEY TAKEAWAYS
* Central banks are accumulating gold at an increased pace which could increase the price of gold.
* While retail sentiment for gold may decline slightly, institutional accumulation remains steady.
* Compare gold futures with the ETF and look at the key levels, as a buying opportunity may be near.
Gold...
READ MORE
MEMBERS ONLY

Bullish AND Bearish Options Trade Ideas
by Tony Zhang,
Chief Strategist, OptionsPlay
In this video, Tony starts the week with a very different tone as he looks at how markets are currently playing out. He then shares individual trade ideas, pointing out which ones they continue to have a bullish or bearish outlooks on. He looks at some key stocks including META,...
READ MORE
MEMBERS ONLY
Stocks UNDER PRESSURE! Which Sector is Leading Now?
by Julius de Kempenaer,
Senior Technical Analyst, StockCharts.com
In this exclusive StockCharts video,Julius takes a look at asset class rotation on Relative Rotation Graphs. He then addresses the 6 sectors that are NOT in the "best five sectors" for this week. To conclude, he dives into the Technology sector to find some of the best...
READ MORE
MEMBERS ONLY
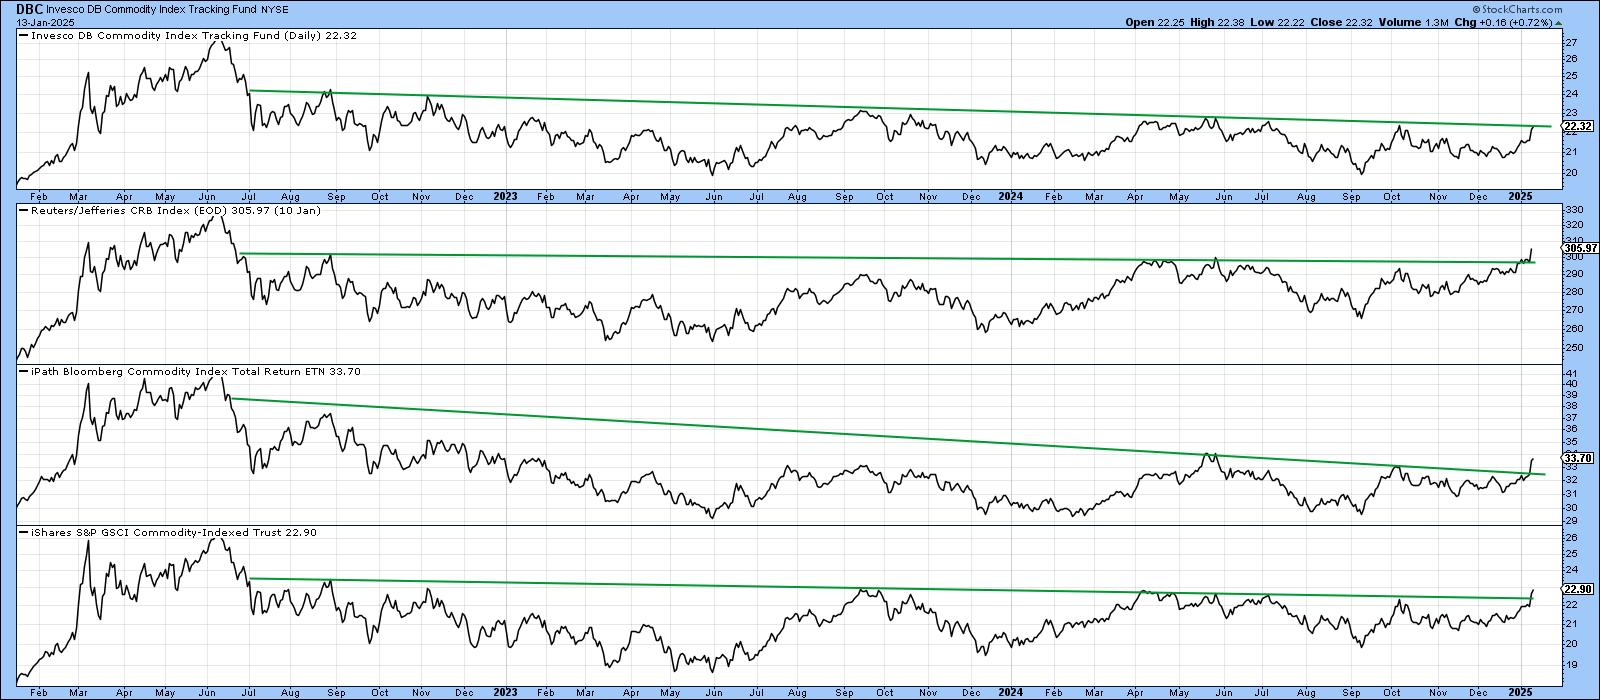
One Small Push by Commodities Could Lead to a Giant Leap for Commoditykind

by Martin Pring,
President, Pring Research
That may seem like a strange title, but it is intended to make the point that commodities look as though they are in the process of breaking out. Furthermore, this breakout, if successful, would jump-start a finely balanced long-term technical position into a primary bull market, all courtesy of our...
READ MORE
MEMBERS ONLY

Here's Why The Bottom Is Dropping Out of the Dow Jones
by Tom Bowley,
Chief Market Strategist, EarningsBeats.com
To understand what makes the Dow Jones tick, you have to first understand one of the key differences between the Dow Jones and the S&P 500 indices. There are a few, but none more critical than the following:
Index Weighting
The S&P 500 is market-cap weighted,...
READ MORE
MEMBERS ONLY

Market Pullbacks Provide Opportunities <BR>to Build your WatchList - Here's How
by Arthur Hill,
Chief Technical Strategist, TrendInvestorPro.com
KEY TAKEAWAYS
* ETFs holding up during corrections often lead when the market turns up again.
* Ranking performance based on year-to-date and one month Rate-of-Change.
* ARTY and IHI show relative and absolute strength.
The stock market is in pullback mode with the S&P 500 EW ETF down 5.15%...
READ MORE
MEMBERS ONLY

Week Ahead: NIFTY Steps Into Next Week With These Two Negative Technical Developments

by Milan Vaishnav,
Founder and Technical Analyst, EquityResearch.asia and ChartWizard.ae
The markets extended their decline over the past five sessions and ended the week in a negative way. While the week started on a bearish note, the Nifty violated a few key levels on higher and lower time frame charts. Along with the weak undercurrent, the trading range widened again...
READ MORE
MEMBERS ONLY

Stock Market Panic: Why Strong Jobs and Inflation Signal Trouble Ahead
by Jayanthi Gopalakrishnan,
Director of Site Content, StockCharts.com
KEY TAKEAWAYS
* Stock market indexes end the week lower on concerns of fewer rate cuts in 2025.
* Treasury yields rose on strong jobs data.
* Strong earnings from Delta Air Lines helped boost airline industry stocks.
December non-farm payrolls data came in much hotter than expected. More jobs were added, the...
READ MORE
MEMBERS ONLY
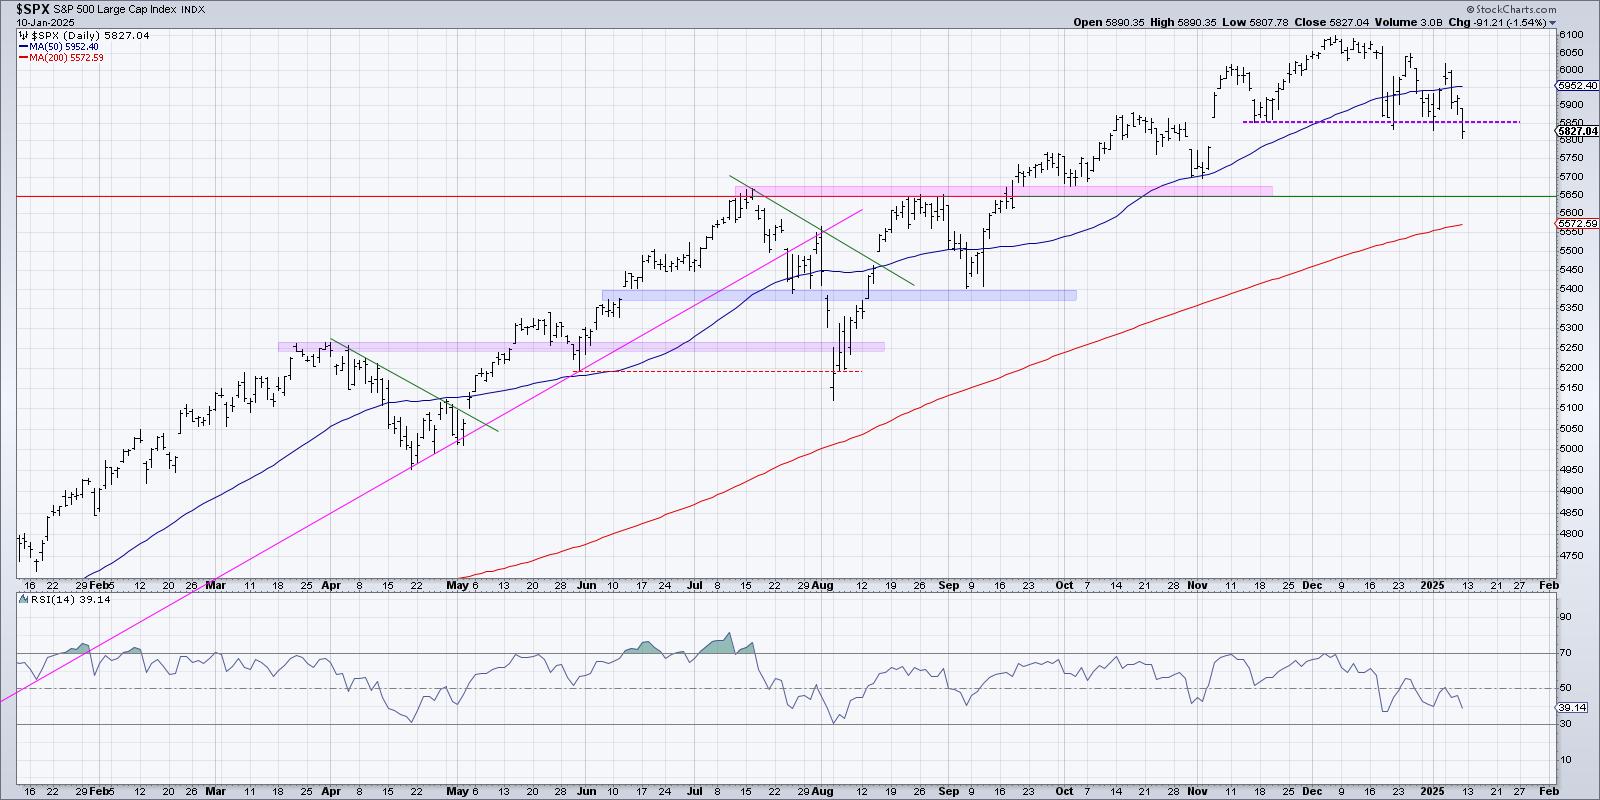
S&P 500 Breakdown Alert! Downside Targets Explained
by David Keller,
President and Chief Strategist, Sierra Alpha Research
KEY TAKEAWAYS
* The break of SPX 5850 suggests further downside in January for the equity benchmarks.
* Using price pattern analysis, we can use the height of the head and shoulders pattern to determine potential support around SPX 5600.
* We can further validate this downside target using Fibonacci Retracements and moving...
READ MORE
MEMBERS ONLY
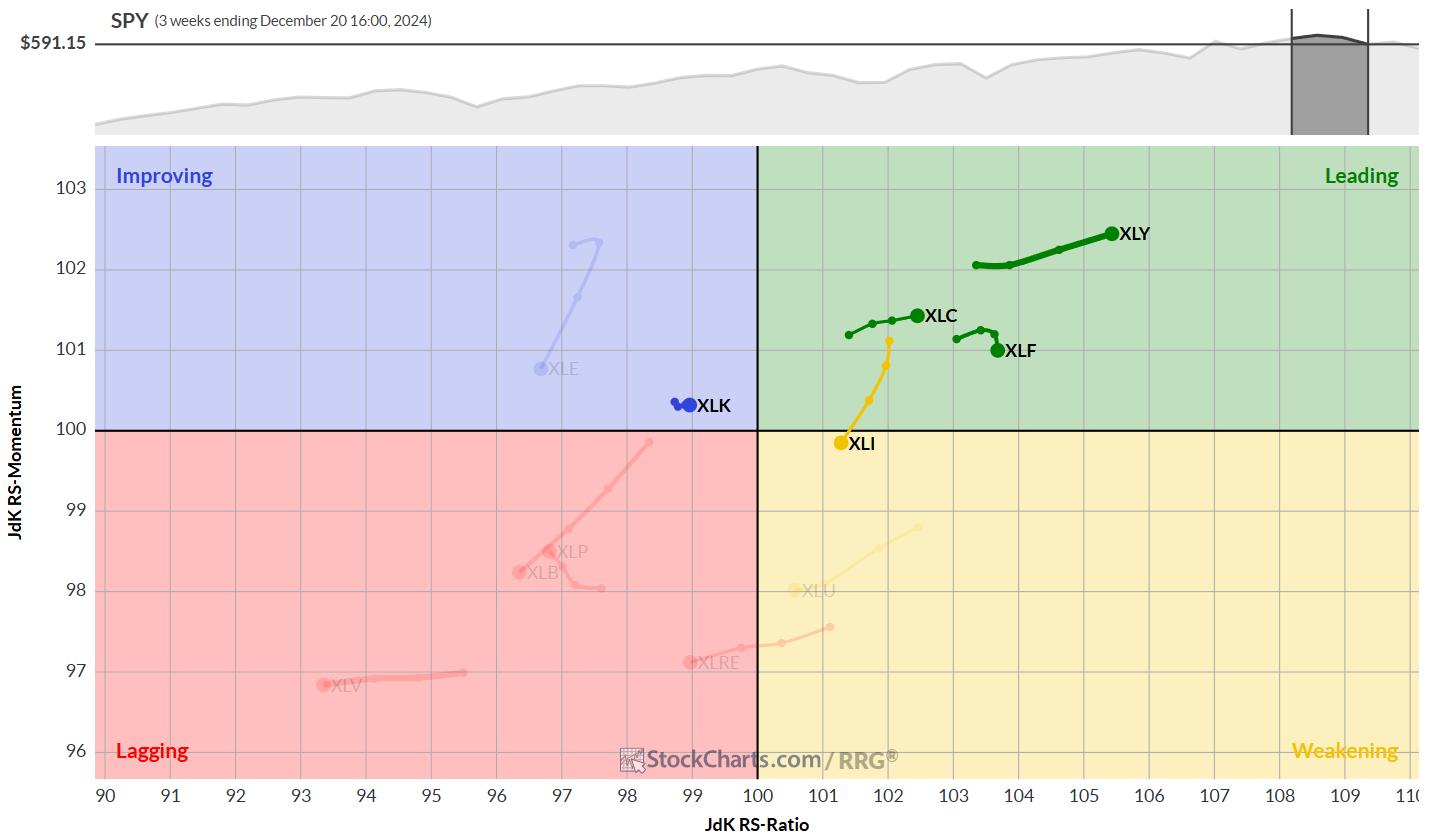
The Best Five Sectors, #2
by Julius de Kempenaer,
Senior Technical Analyst, StockCharts.com
KEY TAKEAWAYS
* The best five sectors remain unchanged.
* XLC and XLF are both starting to show weakness.
* XLI is holding above support, while XLK remains within rising channel.
The composition of the top five sectors remains unchanged this week, despite an interrupted trading week. This stability comes against a backdrop...
READ MORE
MEMBERS ONLY
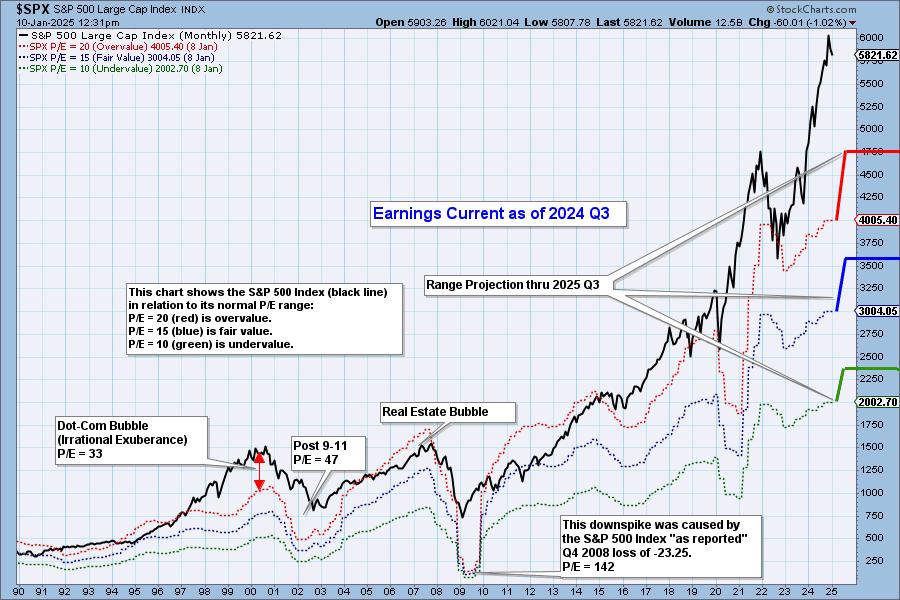
S&P 500 Earnings 2024 Q3: Still Overvalued
by Carl Swenlin,
President and Founder, DecisionPoint.com
S&P 500 earnings are in for 2024 Q3, and here is our valuation analysis.
The following chart shows the normal value range of the S&P 500 Index, indicating where the S&P 500 would have to be in order to have an overvalued P/E...
READ MORE
MEMBERS ONLY

Boston Scientific's Record Surge: Here's How I Found It
by Karl Montevirgen,
The StockCharts Insider
KEY TAKEAWAYS
* StockCharts' New Highs tool is invaluable for spotting outliers during market uncertainty.
* In the case of BSX stock, the New Highs spotted a stock that's significantly defied the healthcare sector's bearish trend.
* BSX may soon be approaching a buy point if you'...
READ MORE
MEMBERS ONLY

What Higher Rates Could Mean for the S&P 500
by David Keller,
President and Chief Strategist, Sierra Alpha Research
KEY TAKEAWAYS
* Higher interest rates can directly impact industry groups like homebuilders, which are driven by consumers borrowing money.
* While a normal shaped yield curve suggests optimism for economic growth, the transition from an inverted yield curve usually results in weaker stock prices.
* The market trend remains the most important...
READ MORE
MEMBERS ONLY

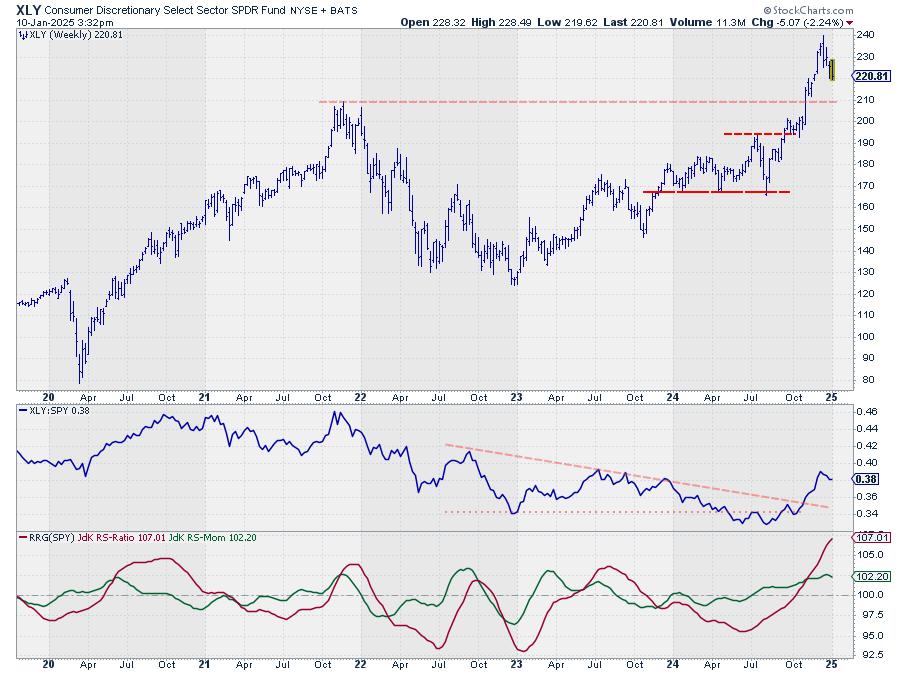
THIS is the BEST Market Sector Right Now!
by Julius de Kempenaer,
Senior Technical Analyst, StockCharts.com
In this exclusive StockCharts video,Julius takes a look at what he recently called "The Best Five Sectors" on a relative rotation graph side-by-side with their price charts. He then takes an in-depth at Consumer Discretionary, and shares some interesting stocks within, including AMZN, ULTA, and more.
This...
READ MORE
MEMBERS ONLY

When to Pull the Trigger: Identifying the BEST Entry Point
by Joe Rabil,
President, Rabil Stock Research
In this exclusive StockCharts video, Joe shares how to identify the best entry point by using two timeframes, Moving Averages, MACD and ADX. He shows two different examples of when to pull the trigger. Joe highlights weakness in the Large Cap universe, and finally goes through the symbol requests that...
READ MORE
MEMBERS ONLY
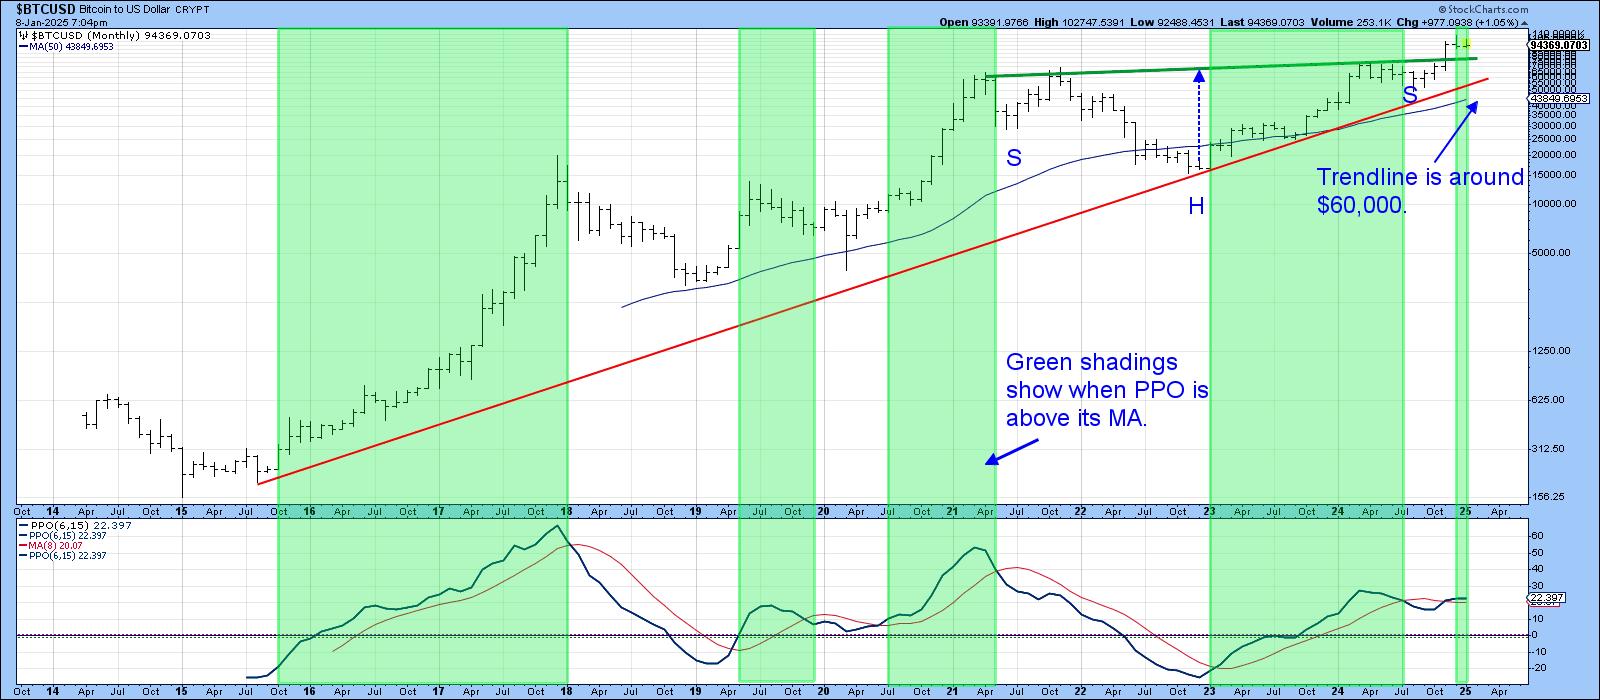
Is The First Domino About to Fall for the Bitcoin Bull Market?
by Martin Pring,
President, Pring Research
The Long-Term Picture
No market goes up forever and, at some point, Bitcoin will top out. It's currently down about 12% from its peak, set on December 17 less than 4 weeks ago, so there is scant evidence at this point indicating a primary bear market. For example,...
READ MORE
MEMBERS ONLY

Inflation Sparks Stock Market Downturn: What This Means for Your Portfolio
by Jayanthi Gopalakrishnan,
Director of Site Content, StockCharts.com
KEY TAKEAWAYS
* Strong Services PMI and more job openings puts inflation narrative back in focus.
* Rising Treasury yields put pressure on large-cap tech stocks.
* Energy and healthcare stocks saw the biggest gains in Tuesday's trading.
What a difference a day makes! December ISM Services data suggests the service...
READ MORE
MEMBERS ONLY

BEST Options Trading IDEAS This Week!
by Tony Zhang,
Chief Strategist, OptionsPlay
In this video, after a general market and sectors review, Tony shares the latest OptionsPlay trade ideas, including bullish and bearish ideas for GOOGL, NVDA, DIS, SHOP, and many more. He analyzes sector rotation with RRGs, and takes a look at key earnings.
This video premiered on January 7, 2025....
READ MORE
MEMBERS ONLY

Which Top AI Semiconductor Stocks are Positioned for Growth?
by Karl Montevirgen,
The StockCharts Insider
KEY TAKEAWAYS
* CES 2025 kicks off this week with many products likely to feature AI functionalities.
* Semiconductors are among the backbone components driving AI tech.
* Be sure to monitor the general industry and focus on key semiconductor stocks, a few of which may be approaching buy points.
On Tuesday, January...
READ MORE
MEMBERS ONLY

Rising Rates Suggest Weaker Stocks - Here's What I'm Watching!
by David Keller,
President and Chief Strategist, Sierra Alpha Research
In this video, Dave shares a long-term analysis of the Ten-Year Treasury Yield, breaks down how the shape of the yield curve has been a great leading indicator of recessionary periods and weaker stock prices, and outlines the chart he's watching to determine if early 2025 will look...
READ MORE
MEMBERS ONLY

DP Trading Room: Does This Rally Have Legs?

by Erin Swenlin,
Vice President, DecisionPoint.com
In today's free DP Trading Room Carl and Erin discuss whether this market rally can get legs and push the market even higher? Mega-caps are looking very positive with the Magnificent Seven leading the charge. Technology is showing new strength along with Communication Services.
Carl starts the trading...
READ MORE
MEMBERS ONLY

How to Trade Erratic Uptrends - An Example and Setup using IWM
by Arthur Hill,
Chief Technical Strategist, TrendInvestorPro.com
KEY TAKEAWAYS
* The Russell 2000 ETF (IWM) gained 10% in 2024 - but did it the hard way.
* Even when trending higher, IWM is prone to pullbacks and erratic price action.
* Chartists can put this to their advantage by using %B to identify tradable pullbacks.
The Russell 2000 ETF managed...
READ MORE
MEMBERS ONLY

These Riskier Areas Start the New Year RALLY!

by Mary Ellen McGonagle,
President, MEM Investment Research
In this video, Mary Ellen analyzes the divergence between the S&P 500 and the Nasdaq while highlighting some of the areas driving Growth stocks. She also talks about the continuation rally in Energy and Utility stocks and shares which stocks are driving these areas higher.
This video originally...
READ MORE
MEMBERS ONLY

Stock Market Ends the Week Strong: Could It Spark a Bullish January?
by Jayanthi Gopalakrishnan,
Director of Site Content, StockCharts.com
KEY TAKEAWAYS
* No Santa Claus Rally this year, but the stock market's optimistic price action on Friday lifted investors' moods.
* Stocks like TSLA and NVDA had big gains while X, CVNA, and alcoholic beverages had big declines.
* Treasury yields and the US dollar remain high, and oil...
READ MORE
MEMBERS ONLY
These 3 Charts Are Among The Most Critical To Start 2025
by Tom Bowley,
Chief Market Strategist, EarningsBeats.com
Obviously, there will be many ups and downs in 2025 and no one chart or indicator can be relied upon 100% to help guide us throughout the year. But some key and very influential areas of the market do meet crossroads from time to time and it seems like one...
READ MORE
MEMBERS ONLY

Block and Loaded: Targeting Gains in SQ
by Tony Zhang,
Chief Strategist, OptionsPlay
KEY TAKEAWAYS
* SQ stock's recent price action makes it a candidate for a favorable risk/reward options strategy.
* Fundamentally, SQ stock looks promising, with attractive valuation, robust growth metrics, and recent earnings.
* A bull put spread would be an ideal strategy to take advantage of SQ stock'...
READ MORE
MEMBERS ONLY
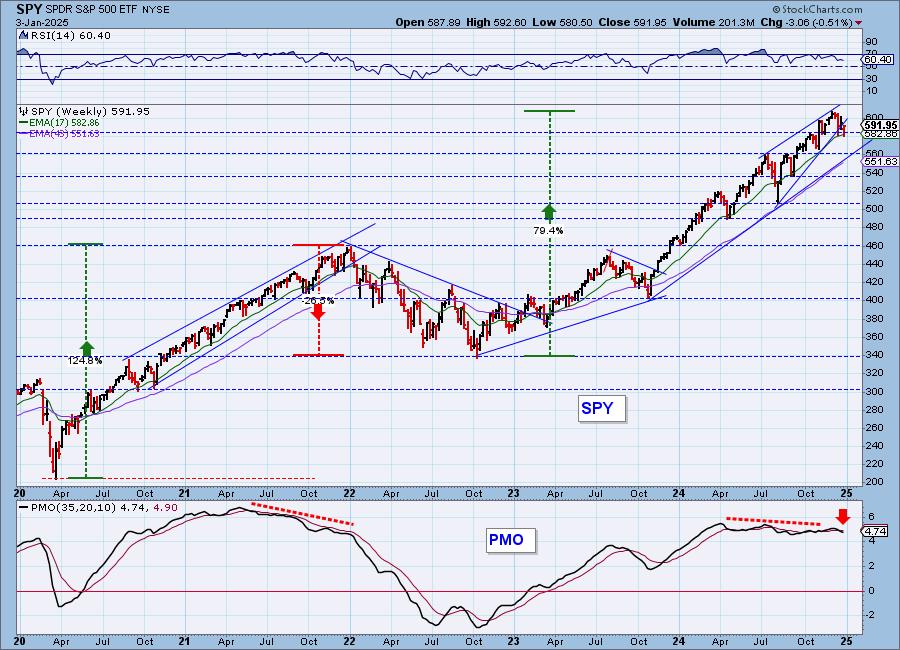
SPY Weekly Chart Breaking Down
by Erin Swenlin,
Vice President, DecisionPoint.com
We monitor the weekly SPY chart and present it to our subscribers every Friday in our DP Weekly Wrap. We have been watching a bearish rising wedge on the weekly chart. The rising wedge pattern implies that you will get a breakdown from the rising bottoms trendline. That is exactly...
READ MORE
MEMBERS ONLY
The Best Five Sectors, #1
by Julius de Kempenaer,
Senior Technical Analyst, StockCharts.com
HAPPY NEW YEAR!!!
Ever since the introduction of RRG back in 2011, many people have asked me questions like: "What is the track record for RRG" or "What are the trading rules for RRG"?
My answers have always been, and will continue to be, "There...
READ MORE