MEMBERS ONLY
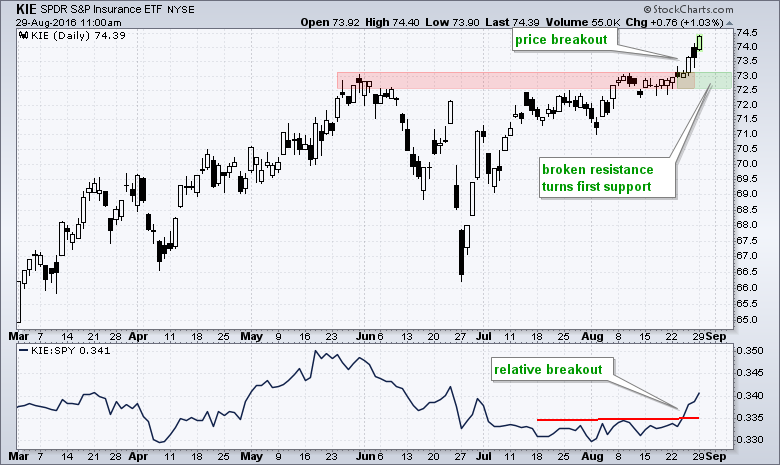
Insurance SPDR Leads Finance Related ETFs

by Arthur Hill,
Chief Technical Strategist, TrendInvestorPro.com
Stocks in the finance sector have been strong the last four days with the Insurance SPDR (KIE) showing chart leadership. Note that the Finance SPDR (XLF), Broker-Dealer iShares (IAI) and Regional Bank SPDR (KRE) are all up over the past week, but KIE is the only one trading at a...
READ MORE
MEMBERS ONLY
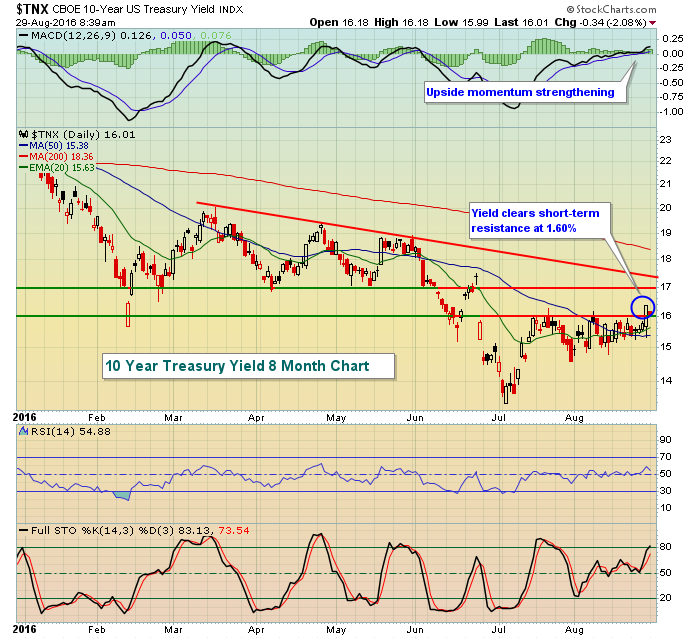
10 Year Treasury Yield Surges To 2 Month High

by Tom Bowley,
Chief Market Strategist, EarningsBeats.com
Special NOTE
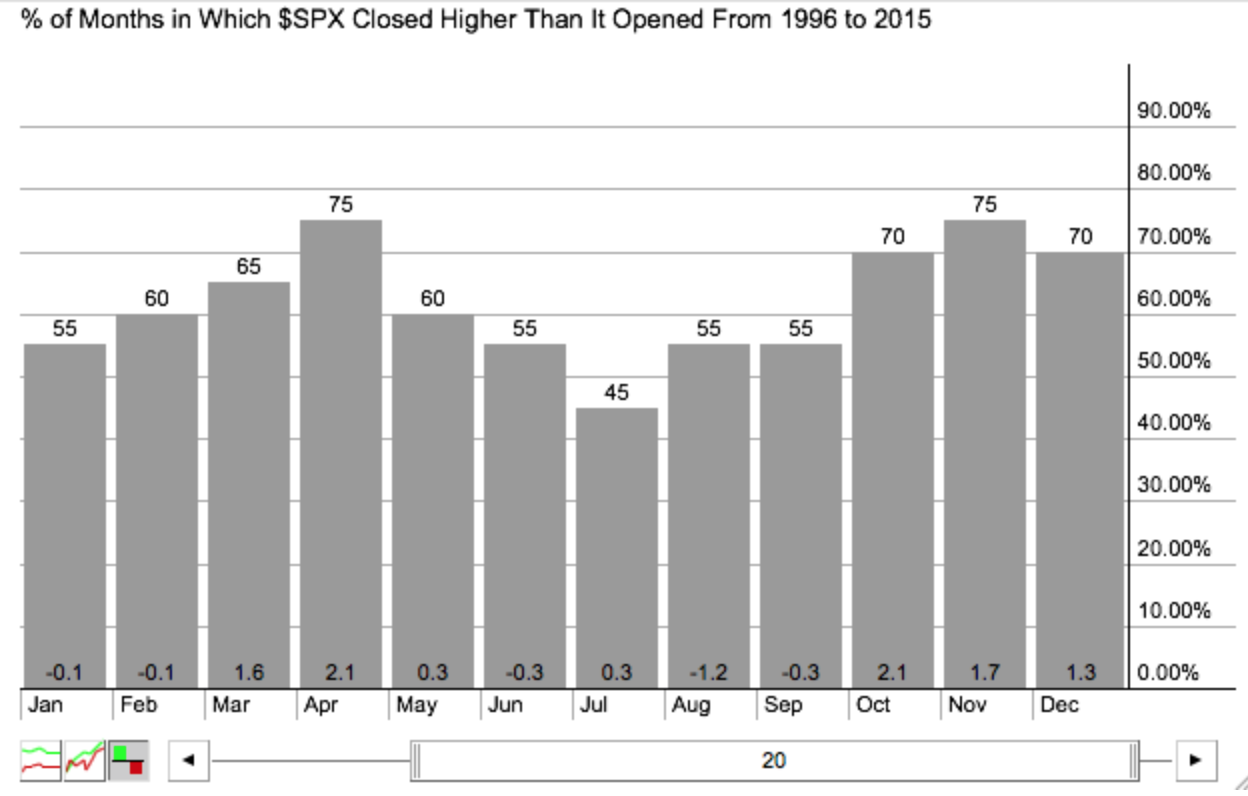
Please check out the Historical Tendencies section below for important seasonal information as we approach the bearish month of September. There are a couple of important links - one to join me for my webinar today at 1pm and also one to join us at StockCharts.com for...
READ MORE
MEMBERS ONLY
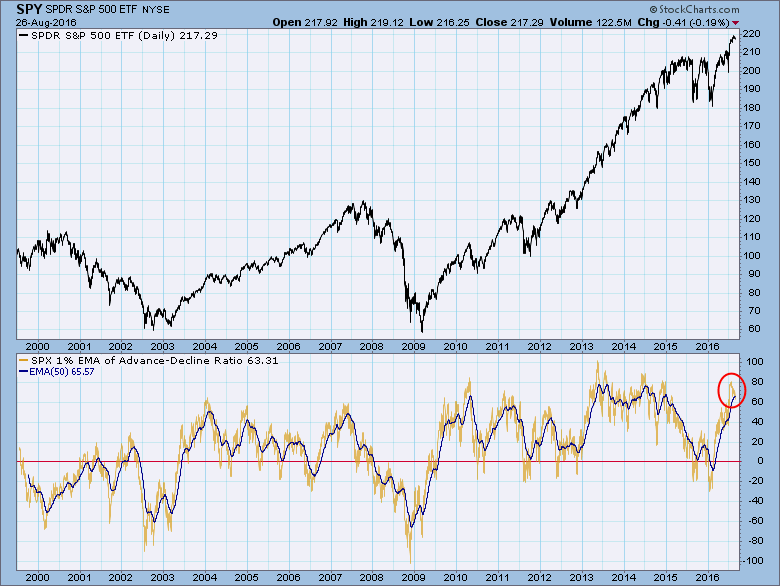
SPY: Long-Term Indicators Overbought

by Carl Swenlin,
President and Founder, DecisionPoint.com
As we watch day-to-day market action, there is a tendency to focus on shorter-term indicators and to lose touch with the longer-term picture. With this in mind, I thought it would be a good idea to look at a trio of long-term indicators that tend to escape our immediate attention....
READ MORE
MEMBERS ONLY

Phase Analysis. Two Case Studies

by Bruce Fraser,
Industry-leading "Wyckoffian"
Accumulation is a process, from beginning to end. The purpose of Accumulation is to create an environment where the Composite Operator (C.O.) is able to accumulate large quantities of stock. This is referred to as Absorption. A long and robust stock uptrend follows Accumulation. The Absorption of stock is...
READ MORE
MEMBERS ONLY
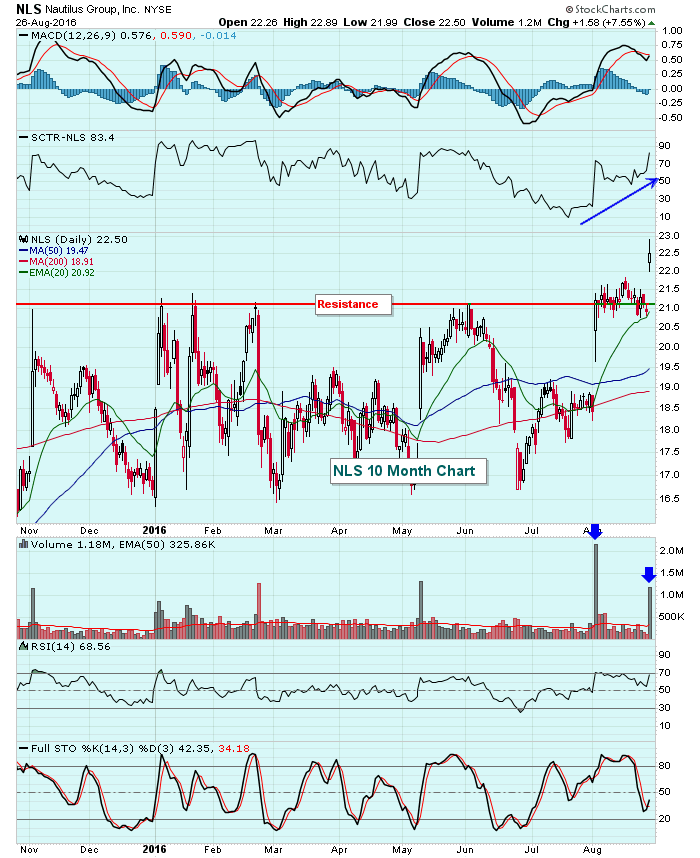
Nautilus Does Some Heavy Lifting On Friday
by Tom Bowley,
Chief Market Strategist, EarningsBeats.com
Nautilus (NLS) officially became a technical heavyweight on Friday as its stock price soared through price resistance to a fresh new 52 week high, bouncing bullishly off its rising 20 day EMA in the process. Volume supported its first very bullish gap in early August and it once again confirmed...
READ MORE
MEMBERS ONLY
Fundamentals versus Technicals: This Ends the Debate!

by Gatis Roze,
Author, "Tensile Trading"
In one corner, you have investors. In the other corner, you have the stock market. When the two communicate accurately, you make money. Yes, it is that simple. Stay with me and I’ll make it worth your while.
Investors, stock pickers, traders – pick a label – all sit somewhere along...
READ MORE
MEMBERS ONLY
S&P 500 Hadn't Done This In Two Months
by Tom Bowley,
Chief Market Strategist, EarningsBeats.com
Market Recap for Thursday, August 25, 2016
For the first time since late June, the S&P 500 closed beneath its 20 day EMA. We've seen plenty of closes near its 20 day EMA, but yesterday marked the first one beneath. Normally that's a pretty...
READ MORE
MEMBERS ONLY

Natural Gas ETF (UNG) Lights Up and Triggers PMO BUY Signal

by Erin Swenlin,
Vice President, DecisionPoint.com
Oil has been enjoying a strong rally. I wrote about a possible bull flag forming on Oil in today's DecisionPoint Alert blog that you may want to review. Natural gas, on the other hand, has not had the advantages that Oil has had. However, it may be lighting...
READ MORE
MEMBERS ONLY

Look Up Not Down

by Martin Pring,
President, Pring Research
* More corrective activity to come?
* Are we there yet with Dow Theory?
* Does the correction matter?
The market has been moving sideways for the last 2 months, thereby frustrating bull and bear alike. Chart 1 shows that the technical position, so far as breadth is concerned, has been improving. That...
READ MORE
MEMBERS ONLY
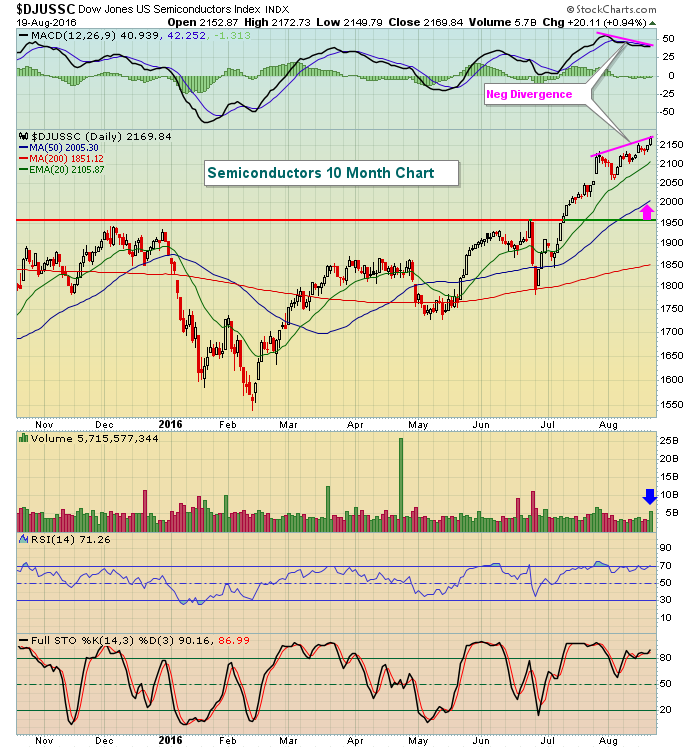
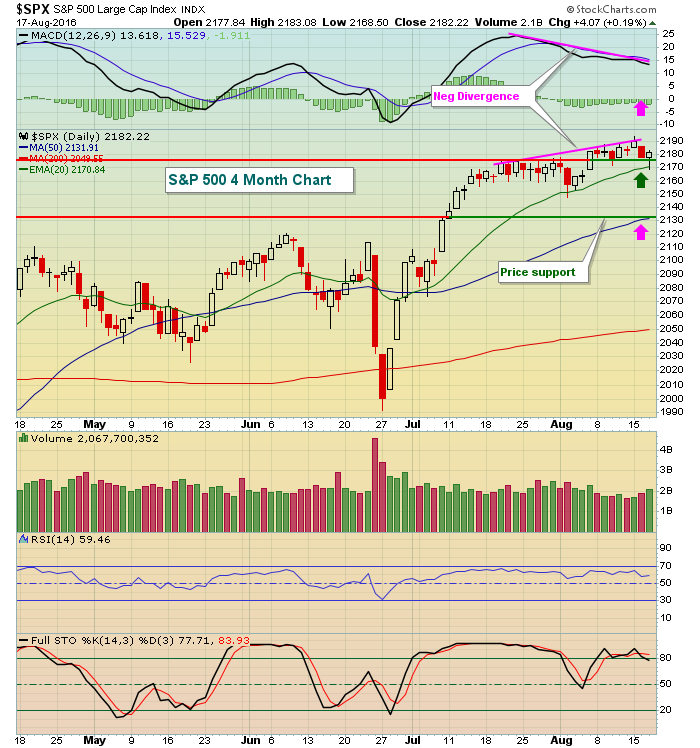
Slowing Momentum And Negative Divergences Are Wreaking Havoc On Equities
by Tom Bowley,
Chief Market Strategist, EarningsBeats.com
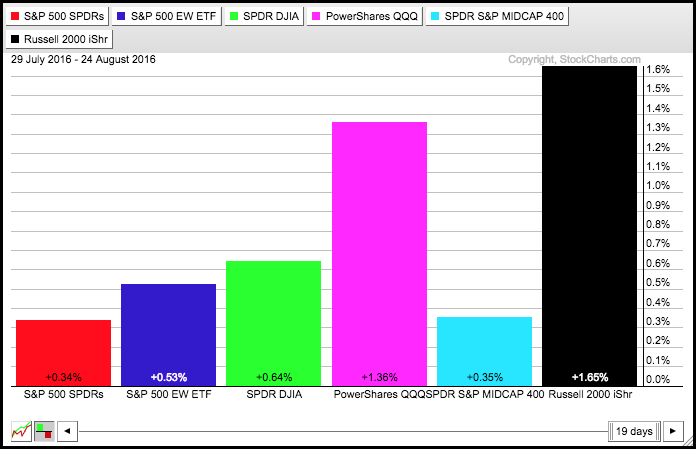
The U.S. stock market has been suffering from a series of negative divergences that have run rampant throughout many sectors and industry groups. As one weakening group sells off, money rotates to another strengthening group. We have not been seeing wide participation moves to the upside. The sector performance...
READ MORE
MEMBERS ONLY
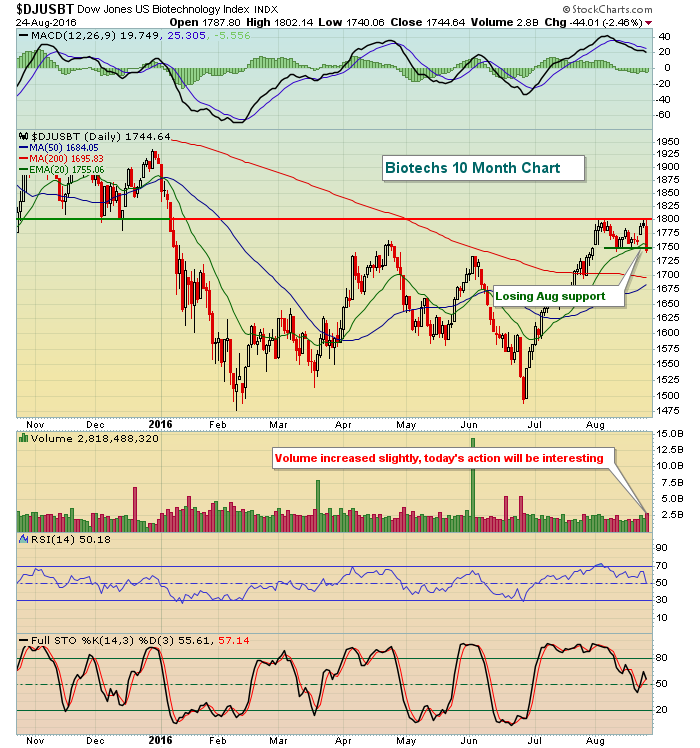
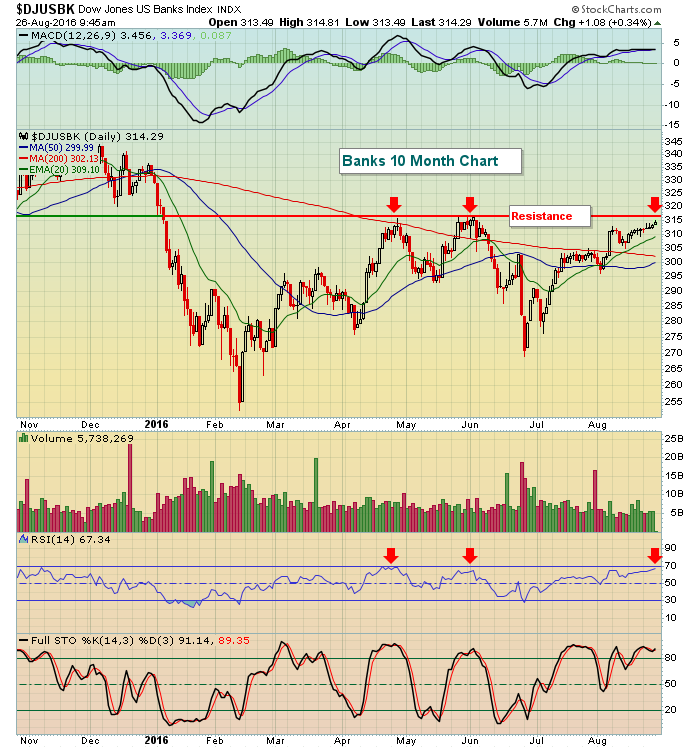
Rough Day For Healthcare As Biotechs Fail At Resistance
by Tom Bowley,
Chief Market Strategist, EarningsBeats.com
Market Recap for Wednesday, August 24, 2016
Healthcare (XLV, -1.57%) was one of two sectors losing more than 1% on Wednesday as the Dow Jones U.S. Biotechnology Index ($DJUSBT) fell 2.46%. There were many losers in the biotech space, but Amgen's loss of its rising...
READ MORE
MEMBERS ONLY
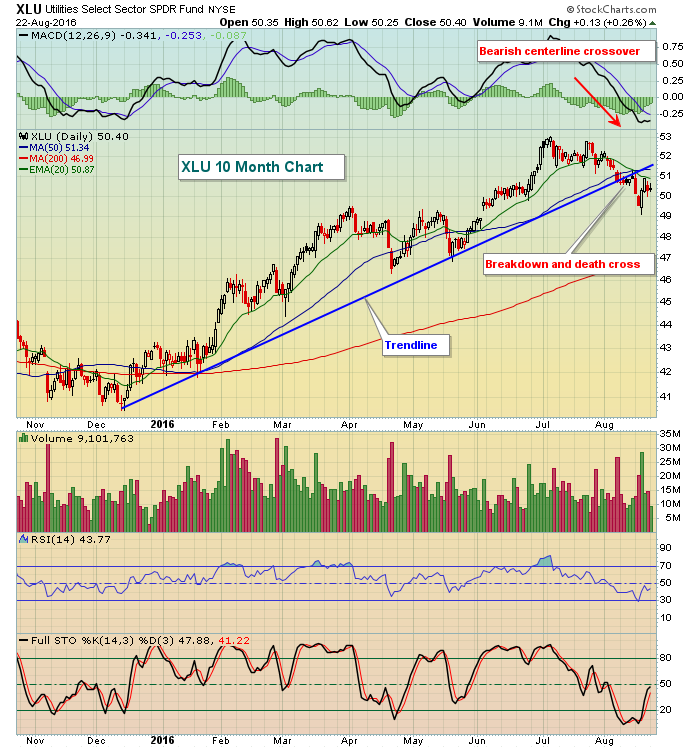
RSI and the Dreaded Double Dip - Gold, Utilities and Banks Key Off Treasuries - XLF and KRE Hold Breakouts
by Arthur Hill,
Chief Technical Strategist, TrendInvestorPro.com
SPY and MDY are Barely Positive this Month // RSI(5) and the Dreaded Double Dip // The Noose Continues to Tighten for Treasuries // How Yields Effect Gold, Utilities and Finance // US 10-yr Yields Sticks Out // XLF and KRE Maintain Breakouts // XLU and IYR Forge Bullish Setups // Gold Breaks, but Becomes Oversold...
READ MORE
MEMBERS ONLY
Oil & Gas Equip & Services SPDR Breaks Wedge and Underperforms
by Arthur Hill,
Chief Technical Strategist, TrendInvestorPro.com
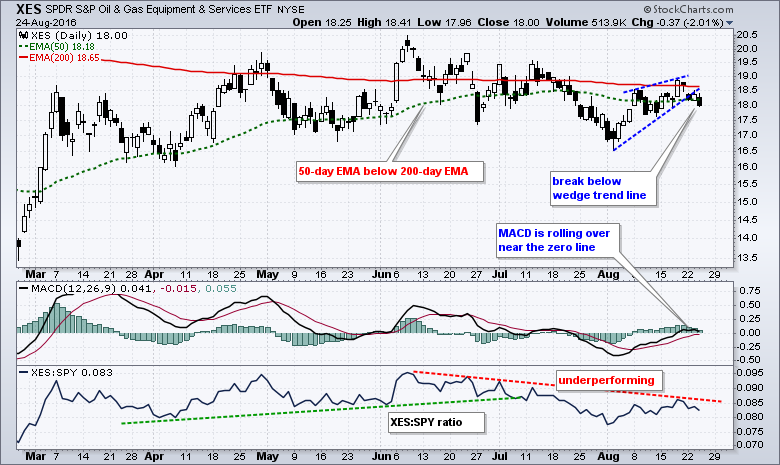
The Oil & Gas Equip & Services SPDR (XES) looks vulnerable because the bigger trend is down and the ETF just broke a wedge trend line. The chart shows the 50-day EMA (green) below the 200-day EMA (red) and this suggests that a long-term downtrend remains underway. The ETF got...
READ MORE
MEMBERS ONLY
Dollar Remains Under Pressure, Lifting Materials And Energy
by Tom Bowley,
Chief Market Strategist, EarningsBeats.com
Market Recap for Tuesday, August 23, 2016
While U.S. equities continue to waver, albeit in a slow northerly fashion, they're not the only asset groups trying to figure out which direction they want to ultimately go. Yesterday, I discussed the 10 year treasury yield ($TNX) struggling to...
READ MORE
MEMBERS ONLY
Small-Cap ETFs Reveal Bullish Bias
by Erin Swenlin,
Vice President, DecisionPoint.com
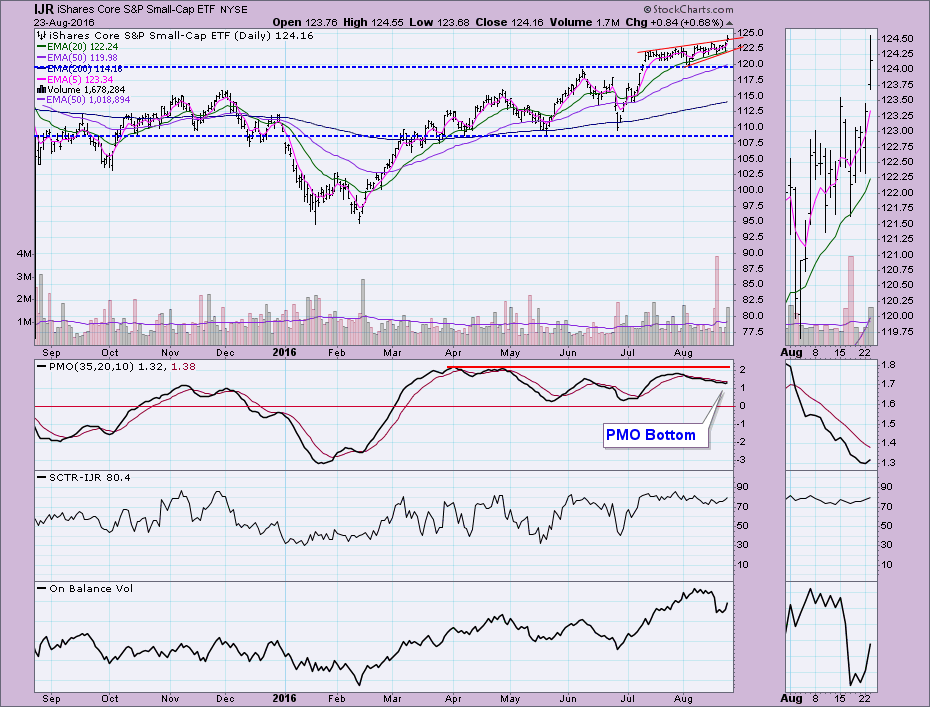
An increase in bullishness on small-cap stocks is needed to support a new bull market move. Small-cap participation or better yet, small-cap leadership can help determine the health of the market in general.
While reviewing the small-cap ETFs in the DecisionPoint LIVE public ChartList, I noticed some bullish characteristics, especially...
READ MORE
MEMBERS ONLY

Survivorship Bias

by Greg Morris,
Veteran Technical Analyst, Investor, and Author
The story about Abraham Wald’s work as a member of the Statistical Research Group during World War II can shed some light into money management (widely disseminated as Abraham Wald’s Memo). Wald was tasked with damage assessments to aircraft that returned from service over Germany, and determine which...
READ MORE
MEMBERS ONLY
Bifurcated Market Signals Little About The Short-Term
by Tom Bowley,
Chief Market Strategist, EarningsBeats.com
Market Recap for Monday, August 22, 2016
Monday was another boring day with most of the action slanting to the negative side, but it was nothing terrible. In fact, both the NASDAQ and Russell 2000 managed to finish the session with small gains while the Dow Jones and S&...
READ MORE
MEMBERS ONLY
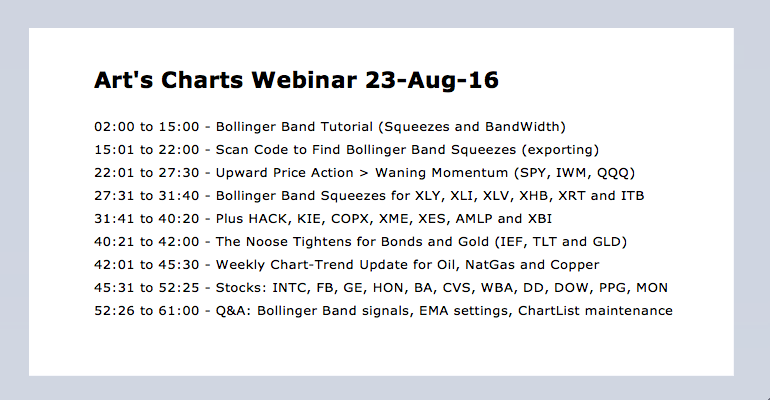
Price Action vs Momentum - All about Bollinger Band Squeezes (KRE, XLF, XSD) - Scanning for Squeezes - Webinar Video
by Arthur Hill,
Chief Technical Strategist, TrendInvestorPro.com
Click here for the webinar video recording
The Song Remains the Same for SPY // Upward Price Action > Waning Momentum // IWM Continues to Lead // Bollinger Band Squeezes for KRE and XLF // Beware of the Head Fake // Adding a Trend Condition // Scanning for Bollinger Band Squeezes // Webinar Preview //// .....
The Song Remains...
READ MORE
MEMBERS ONLY
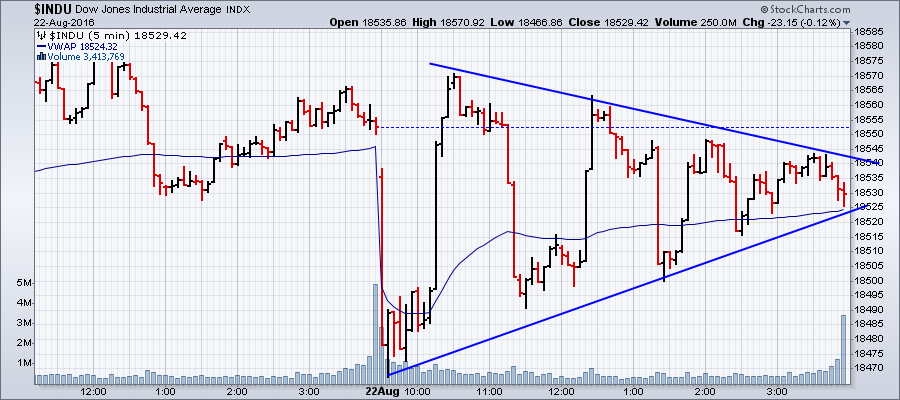
The Dow's Amazing Symmetric Triangle
The Dow did something strange and wonderful today on its intraday chart:
A perfect symmetric triangle pattern! But one with really strange jumps up and down throughout. Truly fascinating. Usually Symmetric Triangles are "Continuation" patterns, which typically break in the direction of the trend prior to their formation....
READ MORE
MEMBERS ONLY
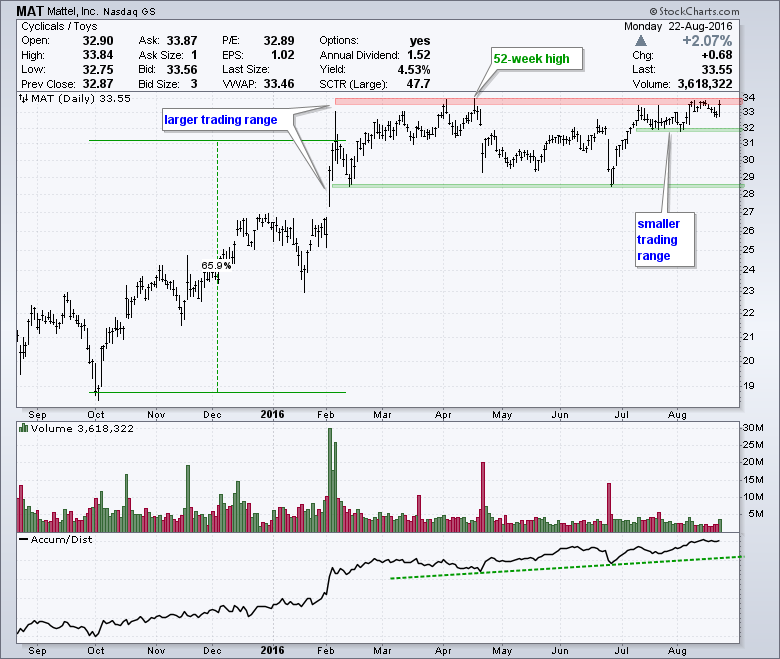
Mattel Challenges Resistance with Signs of Accumulation
by Arthur Hill,
Chief Technical Strategist, TrendInvestorPro.com
Mattel (MAT) led the market from early October to early February with a 65 percent advance and then moved into a large consolidation the last six months. More recently, the stock surged off support in late June and then formed a smaller consolidation near resistance. Notice that the stock advanced...
READ MORE
MEMBERS ONLY
If The Shoe Fits, Then Buy It
by Tom Bowley,
Chief Market Strategist, EarningsBeats.com
Market Recap for Friday, August 19, 2016
Stocks ended last week on a negative note with each of our major indices finishing in negative territory. Losses were very minor on the more aggressive NASDAQ and Russell 2000, however, and three sectors - materials (XLB, +0.14%), technology (XLK, +0.06%...
READ MORE
MEMBERS ONLY
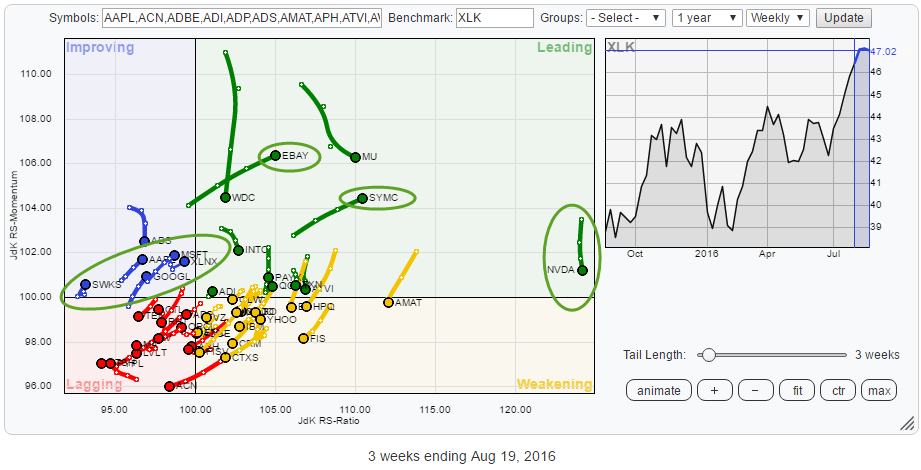
Facebook (FB) not able to keep up with XLK

by Julius de Kempenaer,
Senior Technical Analyst, StockCharts.com
The technology sector, as represented by XLK, started to show some positive sector rotation over the past month and last week managed to crossover from the improving quadrant to the leading quadrant on the weekly Relative Rotation Graph.
Reason enough to check out the relative technical conditions for the stocks...
READ MORE
MEMBERS ONLY
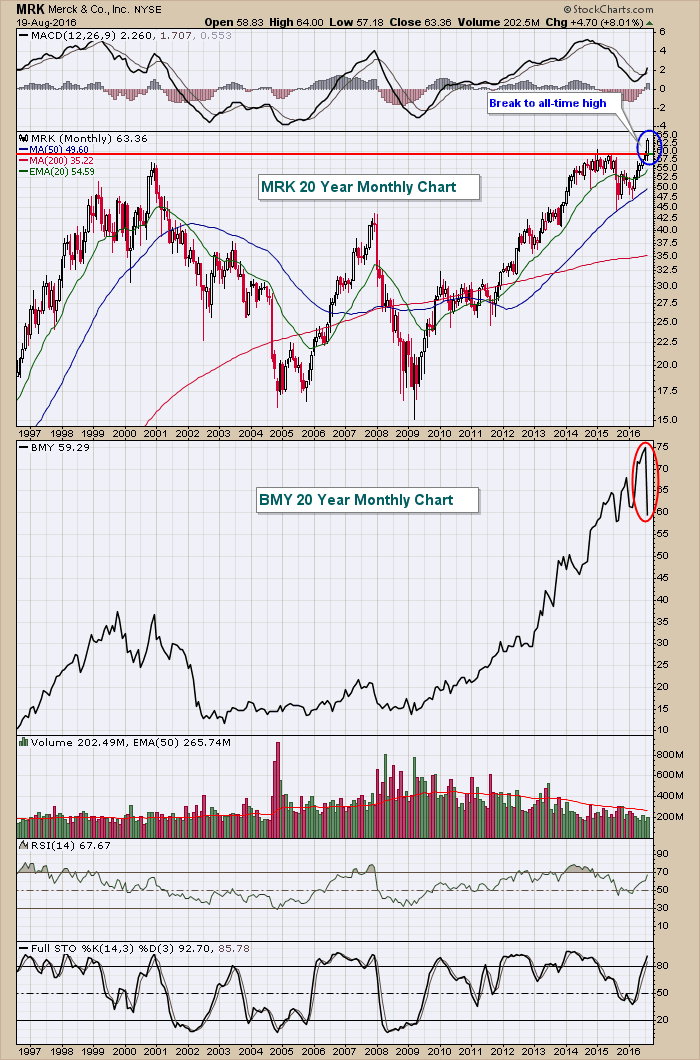
Merck Breaks To An All-Time High
by Tom Bowley,
Chief Market Strategist, EarningsBeats.com
One company's failure can be another company's catalyst. Take for instance Merck & Co (MRK), who on Friday, August 5th surged to an all-time high after Bristol Myers (BMY) had a failed clinical trial of its lung cancer drug. BMY had clearly been outperforming MRK for...
READ MORE
MEMBERS ONLY
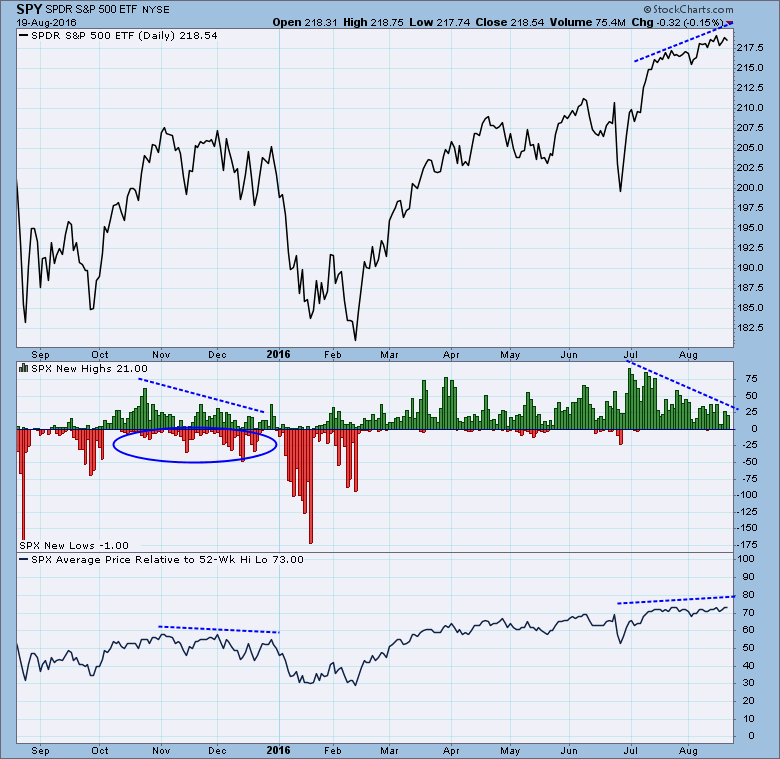
New Highs Contracting Against Higher Prices
by Carl Swenlin,
President and Founder, DecisionPoint.com
Since late-June, prices have been moving higher, while the number of new 52-week highs has been fading. On the face of it this might be cause for concern; however, there are a couple of things that mitigate this apparent weakness.
First, while new highs have been contracting, there has been...
READ MORE
MEMBERS ONLY
Where is Everybody? Low Volume Continues to Plague the Markets
Hello Fellow ChartWatchers!
Where is everybody? Things look pretty darn good on the weekly index charts:
* Stocks are at or near new all-time highs.
* The Tech sector is showing signs of life.
* Energy stocks are roaring up the SCTR rankings
* The "New Highs-New Lows Line" is moving higher...
READ MORE
MEMBERS ONLY
Rising Crude Oil Prices May Start Putting Upward Pressure on Bond Yields

by John Murphy,
Chief Technical Analyst, StockCharts.com
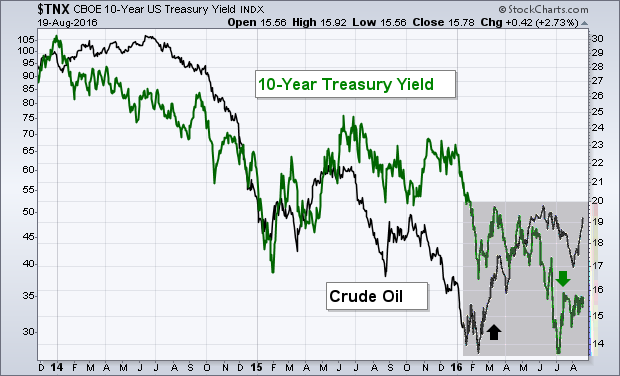
In more normal times, the direction of commodity prices, and oil in particular, had an impact of the direction of bond yields. That because oil is viewed as an early barometer of inflationary trends. A falling oil price (along with other commodities) was disinflationary which boosted bond prices and lowered...
READ MORE
MEMBERS ONLY
With Earnings Season Over, What's Next?

by John Hopkins,
President and Co-founder, EarningsBeats.com
The latest earnings season has come and gone. Now what?
It's a good question, especially with the market in stall mode, with the S&P barely budging in over a month. This stagnation comes after investors seemed to have applauded the majority of earnings reports telling me...
READ MORE
MEMBERS ONLY
Rebound In Crude Oil Prices Trigger Big Gains In Energy
by Tom Bowley,
Chief Market Strategist, EarningsBeats.com
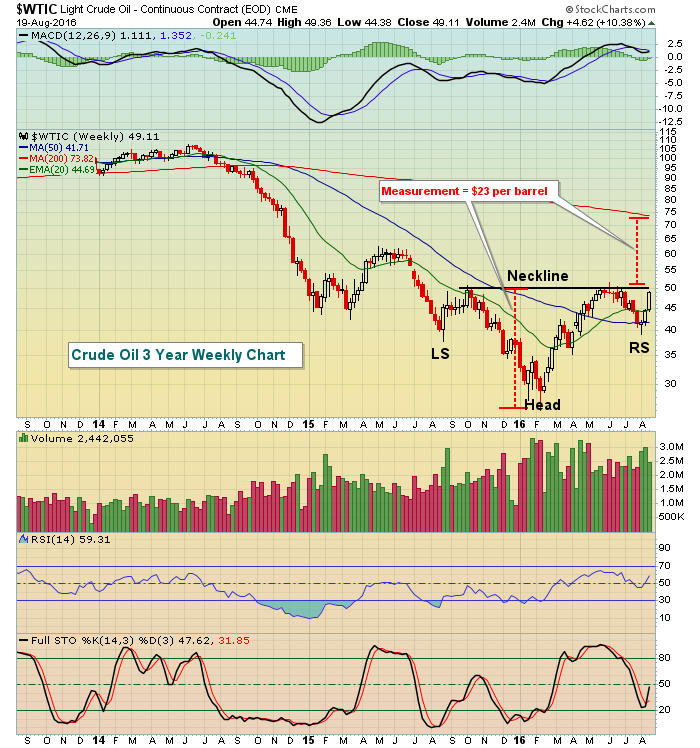
The bottoming formation in crude oil ($WTIC) continues to take shape and the beneficiary clearly has been the energy ETF (XLE). Since dipping below $40 per barrel to begin August, the WTIC has rallied more than 20% in the past three weeks and is now nearing $50 per barrel. A...
READ MORE
MEMBERS ONLY
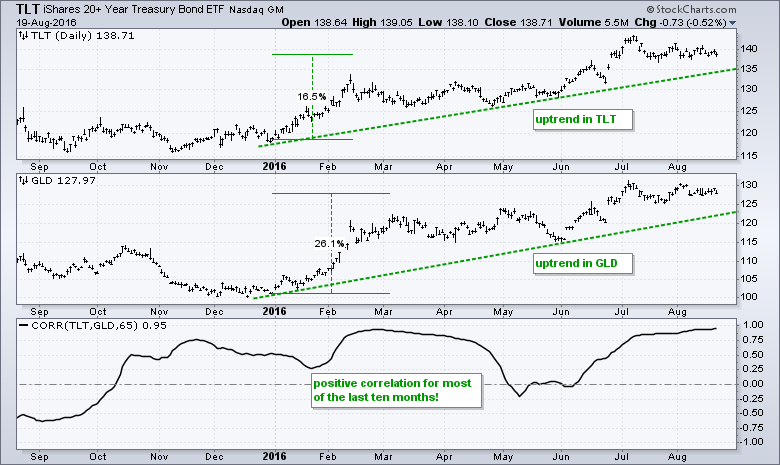
The Squeeze Play is on for the Gold and T-Bond ETFs
by Arthur Hill,
Chief Technical Strategist, TrendInvestorPro.com
The Gold SPDR (GLD) and the 20+ YR T-Bond ETF (TLT) are two of the best performing asset class ETFs this year and both remain in clear uptrends. GLD is up over 26% year-to-date and TLT is up around 16%. One would not expect bonds and gold to be leading...
READ MORE
MEMBERS ONLY
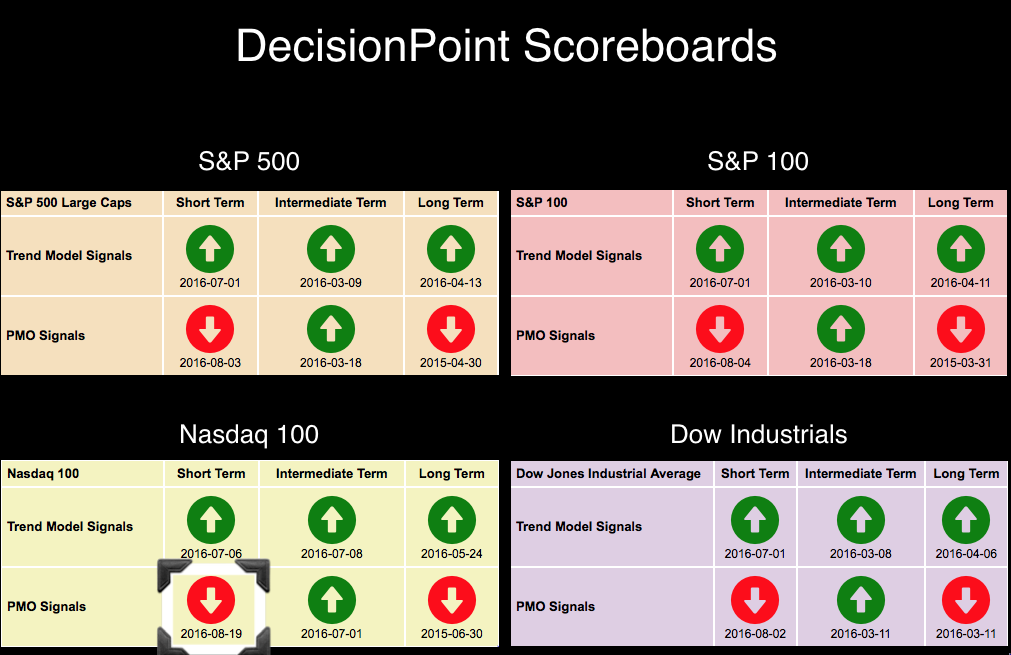
NDX New PMO SELL Signal
by Erin Swenlin,
Vice President, DecisionPoint.com
The DecisionPoint Scoreboards have been quiet since the beginning of the month when we saw the OEX, SPX and Dow all switch to short-term Price Momentum Oscillator (PMO) SELL signals. The NDX which has been enjoying a steep rally, has stalled. In so doing, momentum switched negative and hence the...
READ MORE
MEMBERS ONLY

New Direction, New Feature for The Traders Journal
by Gatis Roze,
Author, "Tensile Trading"
Announcing a new direction for The Traders Journal. Since 2012, I’ve been delving into my own trading journals every week and sharing with my readers what I found there. I will continue to do so, but on a bi-weekly basis. My revised plan is to alternate that with a...
READ MORE
MEMBERS ONLY

CHINA A-SHARES REACH EIGHT-MONTH HIGH ON STRONG VOLUME -- SHANGHAI STOCK INDEX ALSO ACHIEVES BULLISH BREAKOUT -- ANNOUNCEMENT OF SHENZHEN-HONG KONG STOCK CONNECT SHOULD BOOST INTEREST IN MAINLAND CHINESE STOCKS
by John Murphy,
Chief Technical Analyst, StockCharts.com
CSI 300 CHINA A-SHARES COMPLETE CHART BOTTOM ... Last Friday's market message showed a big rise in the Hong Kong stock market, and suggested that mainland A-Shares might be starting to turn up as well. They did that this week. Chart 1 shows the Deutsche X-trackers CSI 300 China...
READ MORE
MEMBERS ONLY
Bandwidth Hits Multi-year Low for S&P 500 - Bull Signal Remains Active for Band Squeeze on Russell 2000
by Arthur Hill,
Chief Technical Strategist, TrendInvestorPro.com
All Time Highs Set the Tone // Four Indecisive Weeks for the S&P 500 EW Index // Bandwidth Hits Lowest Level in over 10 Years // S&P 500 Clears Upper Band // Russell 2000 Remains on Bull Signal //// .....
All Time Highs Set the Tone
The major stock indexes have traded...
READ MORE
MEMBERS ONLY
Energy Makes Huge Breakout As Crude Oil Jumps Again
by Tom Bowley,
Chief Market Strategist, EarningsBeats.com
Market Recap for Thursday, August 18, 2016
Energy (XLE, +2.06%) led the action on Thursday and helped turn the stock market around after it briefly turned negative at mid-day. Utilities (XLU, +1.23%) and materials (XLB, +0.64%) also performed well, but the remaining six sectors fluctuated near the...
READ MORE
MEMBERS ONLY
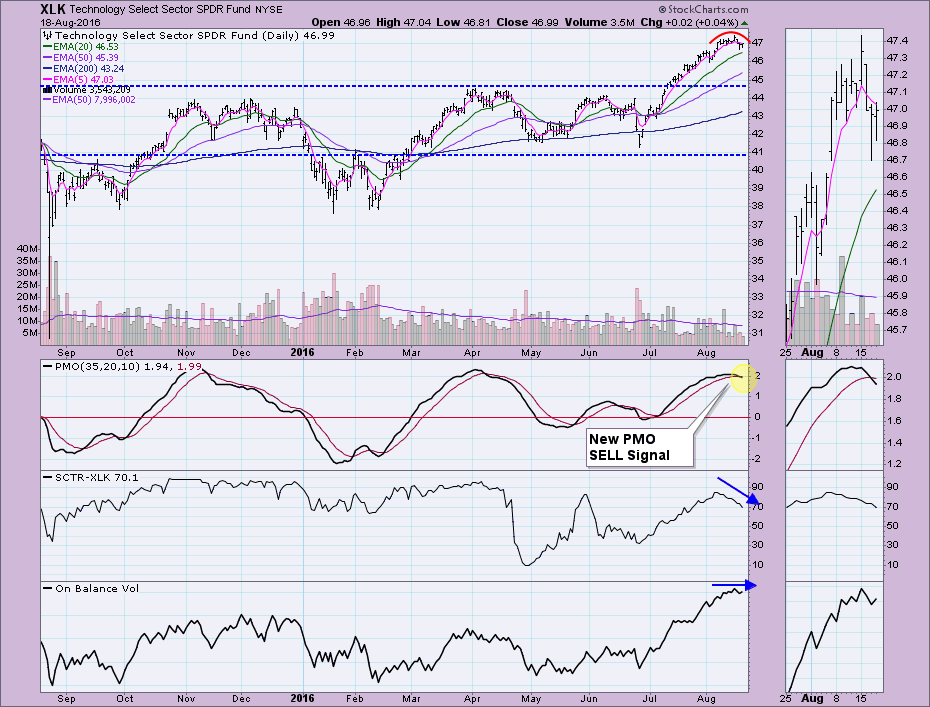
Technology ETF (XLK) Ready for a Pullback
by Erin Swenlin,
Vice President, DecisionPoint.com
While reviewing the DecisionPoint Market/Sector Summary today, I noticed the Technology SPDR (XLK) triggered a new Price Momentum Oscillator (PMO) SELL signal. When I get these "attention flags", I immediately want to check out the chart.
XLK's daily chart shows a distinct rounded top formation...
READ MORE
MEMBERS ONLY

FALLING GREENBACK BOOSTS CANADIAN DOLLAR -- IT'S ALSO PUSHING COMMODITY PRICES HIGHER -- ENERGY SPDR ACHIEVES BULLISH BREAKOUT -- OIL SERVICE ETF IS ALSO TURNING UP -- ENERGY LEADERS ARE SCHLUMBERGER, BAKER HUGHES, AND MARATHON OIL
by John Murphy,
Chief Technical Analyst, StockCharts.com
FALLING DOLLAR BOOSTS COMMODITY CURRENCIES... The falling U.S. dollar continues to support commodity prices and currencies tied to commodities. Chart 1 shows the PowerShares Dollar Index (UUP) falling to the lowest level in two months. A falling dollar is positive for foreign currencies, especially those of commodity producing countries....
READ MORE
MEMBERS ONLY
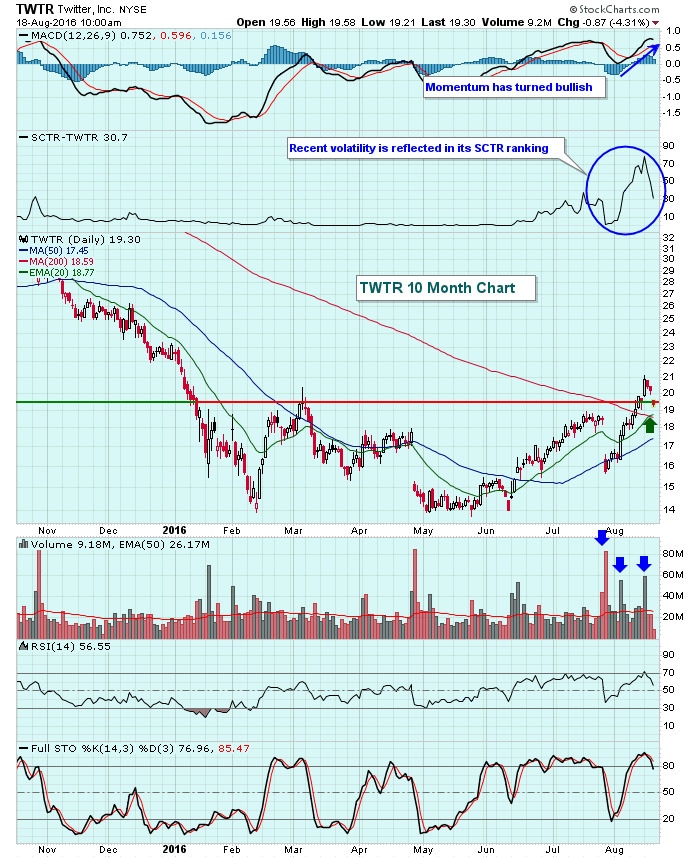
Will The Real Twitter Please Stand Up?
by Tom Bowley,
Chief Market Strategist, EarningsBeats.com
There aren't too many stocks under the same scrutiny as Twitter (TWTR) and expectations range from wildly bullish to wildly bearish. So what is a trader to do? Well, I'd ignore all the news headlines, which lately have gone full circle from potential buyout rumors to...
READ MORE
MEMBERS ONLY
Afternoon Rally Erases Early Losses
by Tom Bowley,
Chief Market Strategist, EarningsBeats.com
Market Recap for Wednesday, August 17, 2016
The Tuesday selling continued into early Wednesday, but initial support held in the support zone that was highlighted yesterday. 2170-2175 was the support zone and the S&P 500's intraday low was 2168 late Wednesday morning before the buyers returned...
READ MORE
MEMBERS ONLY
Short-term Yields Edge Higher - Extrapolating from the June Swoon - First Supports for Fab Five - Chart Potpourri
by Arthur Hill,
Chief Technical Strategist, TrendInvestorPro.com
Broad Market Strength affirms Bull Market // Short-term Yields Edge Higher - Will Long-term Yields Follow? // Extrapolating from the June Swoon in Treasury Yields // Finance Sector Remains Strong // Regional Bank SPDR Holds Breakout - JPM, C, BAC, USB // Setting first Supports for the Fab Five - FB, GOOGL, AMZN, AAPL, MSFT...
READ MORE
MEMBERS ONLY

Is It Time To Emphasize Commodities And Reduce Bond Exposure?
by Martin Pring,
President, Pring Research
* The Six Stages
* Characteristics of Stage IV
* The stock market’s view on commodities
* All that glitters
The Six Stages
In the latest bi-weekly Market Round Up Webinar I looked at several inter-asset relationships to see which ones are likely to outperform going forward (watch the webinar here). To start...
READ MORE
