MEMBERS ONLY

Article Summaries 4-2016 to 7-2016

by Greg Morris,
Veteran Technical Analyst, Investor, and Author
Most blog authors on StockCharts.com are writing about the current markets and do an exceptional job. I do not write about the current markets as I wanted to share my experiences after 40+ years as a technical analyst. Not only experiences with trading and investing, but model building and...
READ MORE
MEMBERS ONLY
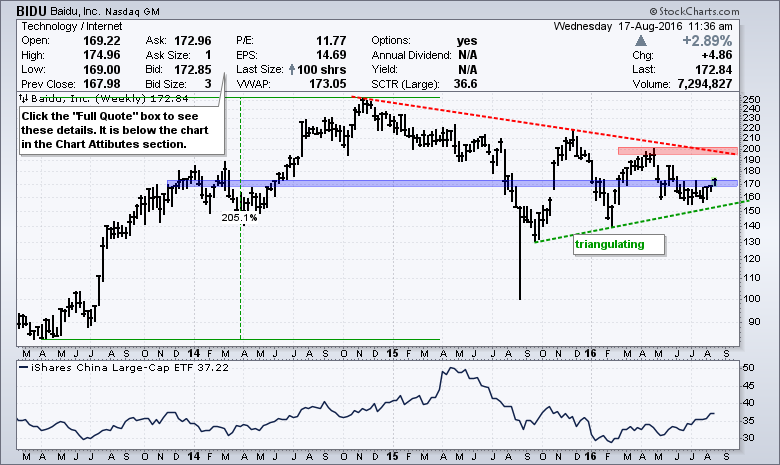
Baidu Goes for Breakout after Long Stall

by Arthur Hill,
Chief Technical Strategist, TrendInvestorPro.com
Baidu ($BIDU) has basically gone nowhere since 2014, but the stock is showing signs of buying pressure recently with a wedge breakout. First, the weekly chart shows the stock surging some 200% and moving above 170 for the first time in late 2013. The stock peaked in late 2014 and...
READ MORE
MEMBERS ONLY
U.S. Stocks Weaken, Watch This Support Level

by Tom Bowley,
Chief Market Strategist, EarningsBeats.com
Market Recap for Tuesday, August 16, 2016
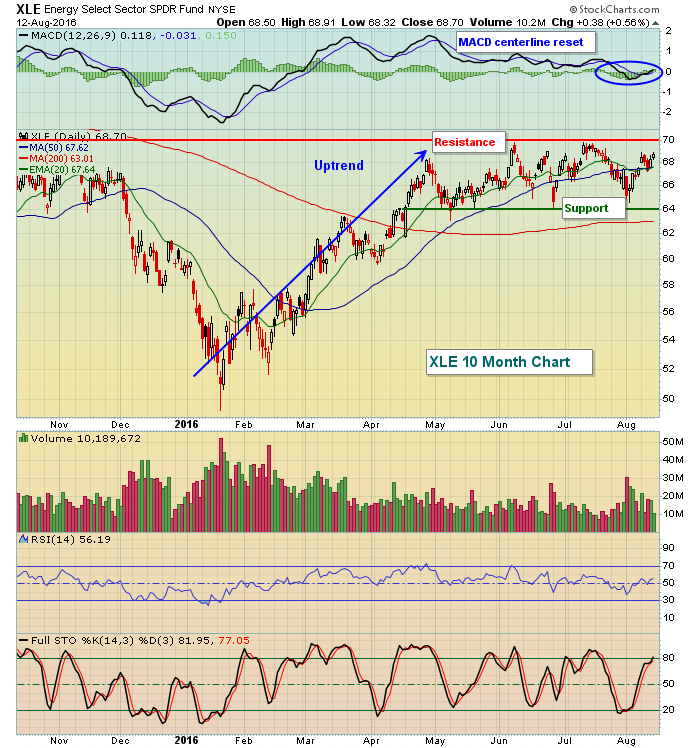
Eight of nine sectors fell on Tuesday with energy (XLE, +0.16%) the lone sector that managed to finish in positive territory. That was attributable to a continuing rise in crude oil prices ($WTIC) that has taken black gold from $39 per barrel...
READ MORE
MEMBERS ONLY
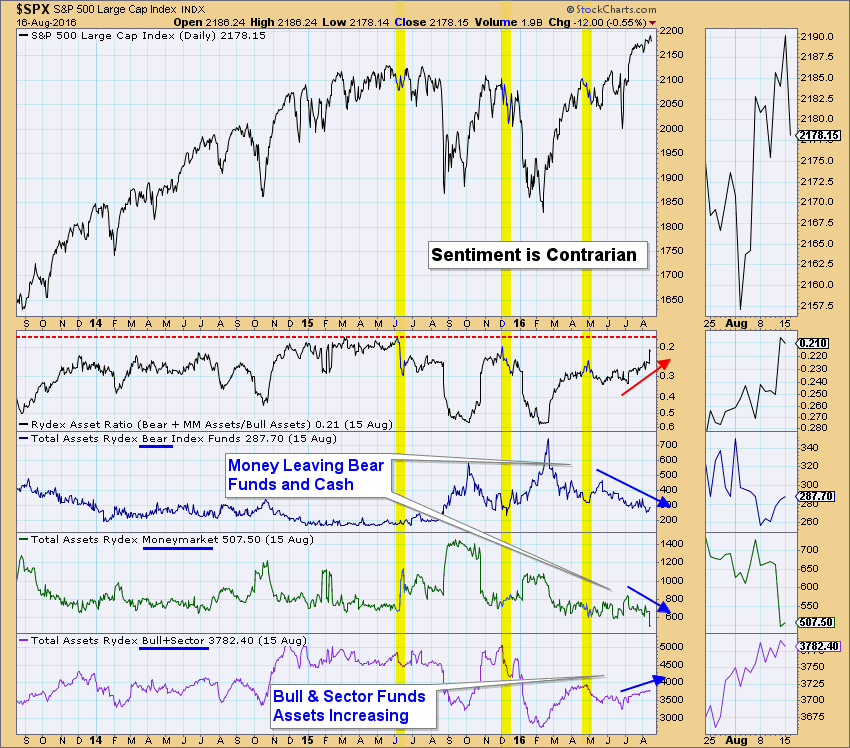
Rydex Assets Question - New DecisionPoint LIVE ChartList

by Erin Swenlin,
Vice President, DecisionPoint.com
StockCharts.com members got a sneak peek yesterday at the new DecisionPoint LIVE Public ChartList. There you will find all of the charts that I analyze during my webinars. They will be updated prior to my webinars on Wednesdays and Fridays. Additionally, I'll include a Chart Spotlight or...
READ MORE
MEMBERS ONLY
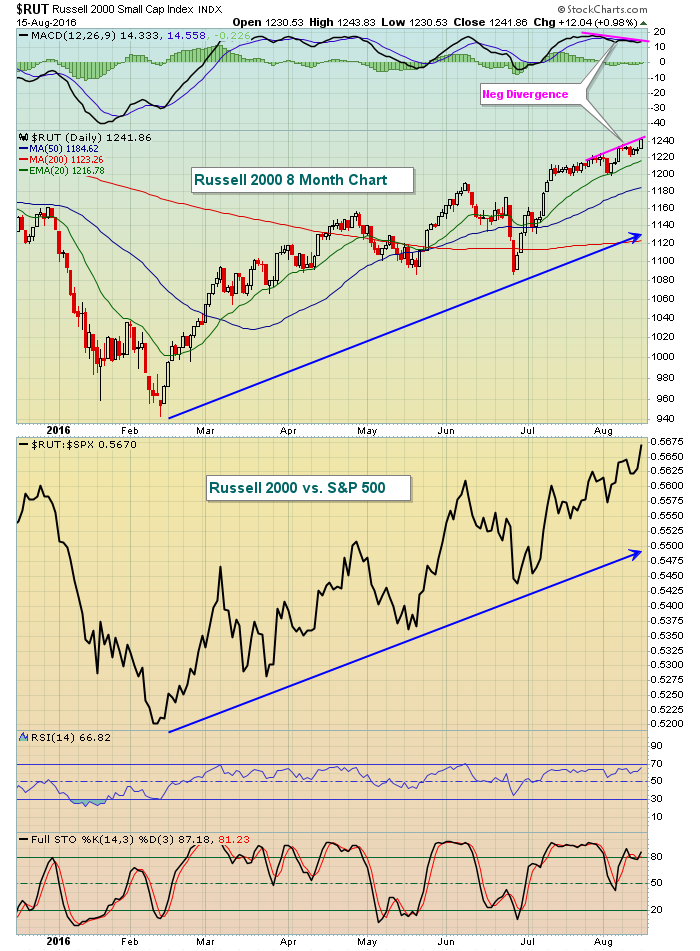
Small Caps Lead Broad-Based Rally
by Tom Bowley,
Chief Market Strategist, EarningsBeats.com
Market Recap for Monday, August 15, 2016
The Russell 2000 index surged nearly 1%, more than three times the percentage gain seen on the S&P 500 as small caps were once again held in favor by traders. The outperformance by small caps has been continuing since the S&...
READ MORE
MEMBERS ONLY
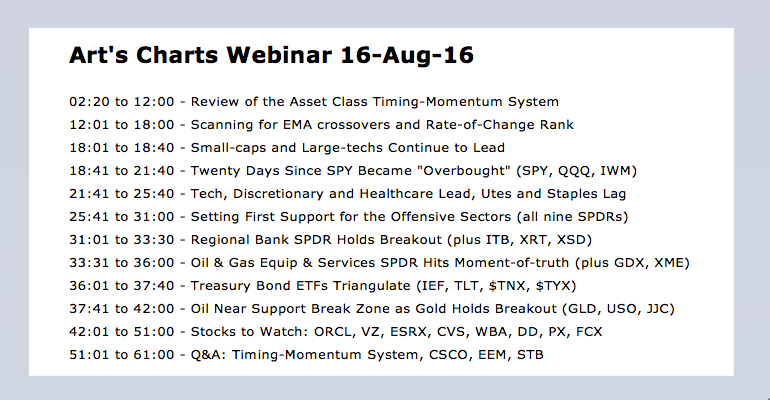
IWM Takes the Lead - Setting First Support for Offensive Leaders - XLU and XLP Continue to Lag - Webinar Video
by Arthur Hill,
Chief Technical Strategist, TrendInvestorPro.com
Click here for the Webinar video - Click here for the Webinar ChartList
Twenty Days Since SPY Became "Overbought" // RSI for IWM finally Hits 70 // Small-caps and Large-techs Continue to Lead // Tech, Consumer Discretionary and Healthcare Lead // Utilities and Staples are Lagging // Setting First Support for the Offensive...
READ MORE
MEMBERS ONLY
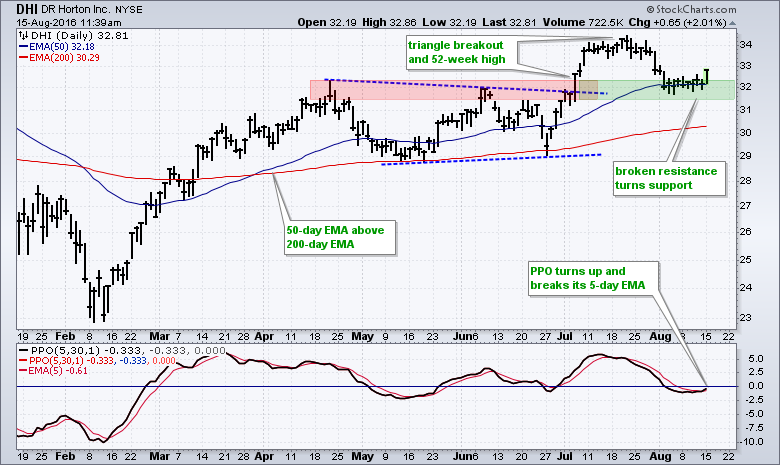
DR Horton Looks Poised to Continue Bigger Trend
by Arthur Hill,
Chief Technical Strategist, TrendInvestorPro.com
DR Horton (DHI) is part of the housing group and the stock is in a long-term uptrend. I based this trend assessment on three things. First, the 50-day EMA is above the 200-day. Second, the 200-day EMA is rising. Third, the stock hit a 52-week high in July. DHI pulled...
READ MORE
MEMBERS ONLY
Bifurcated Action Stifles The Bulls On Friday
by Tom Bowley,
Chief Market Strategist, EarningsBeats.com
Market Recap for Friday, August 12, 2016
It was another day of indecision - but within the confines of a continuing uptrend. The NASDAQ and Russell 2000 eked out gains while both the Dow Jones and S&P 500 suffered fractional losses. Negative divergences are now present on the...
READ MORE
MEMBERS ONLY
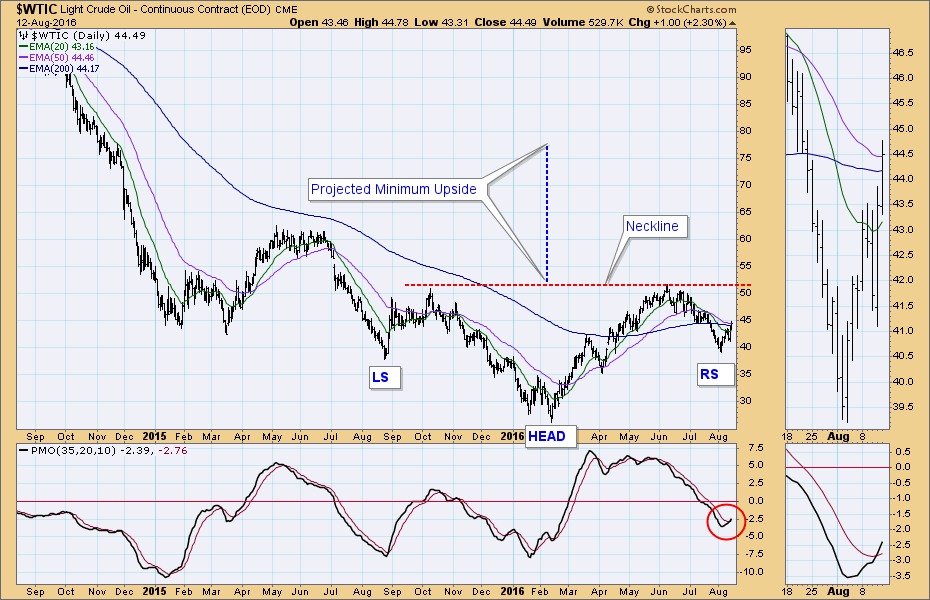
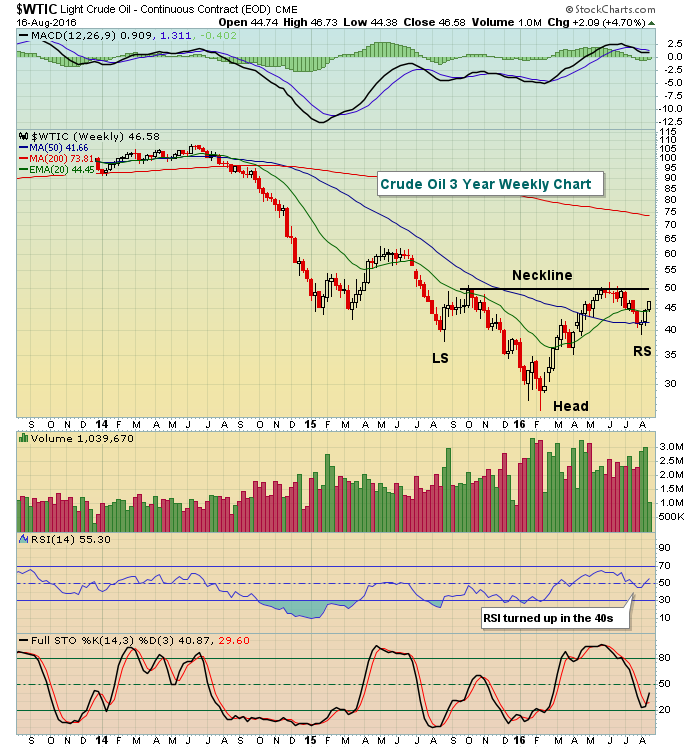
Crude Oil: Bullish Bottom

by Carl Swenlin,
President and Founder, DecisionPoint.com
In the last week a bullish reverse head and shoulders pattern has emerged on the crude oil chart. Also, the PMO generated a crossover BUY signal as it crossed up through its signal line, increasing, in my opinion, the odds that price will penetrate the neckline.
If the neckline is...
READ MORE
MEMBERS ONLY
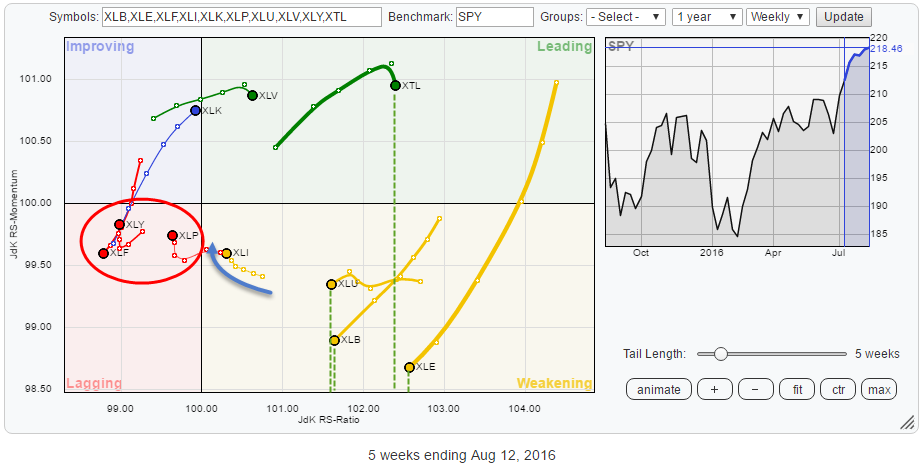
Strong rotation for Technology but SPY is still lacking fuel

by Julius de Kempenaer,
Senior Technical Analyst, StockCharts.com
To surrender or not to surrender? That's the question!
After a nice run up in the S&P 500, I started to worry about its ability to push higher when resistance levels coming off previous highs started to act up. At, more or less, the same time,...
READ MORE
MEMBERS ONLY
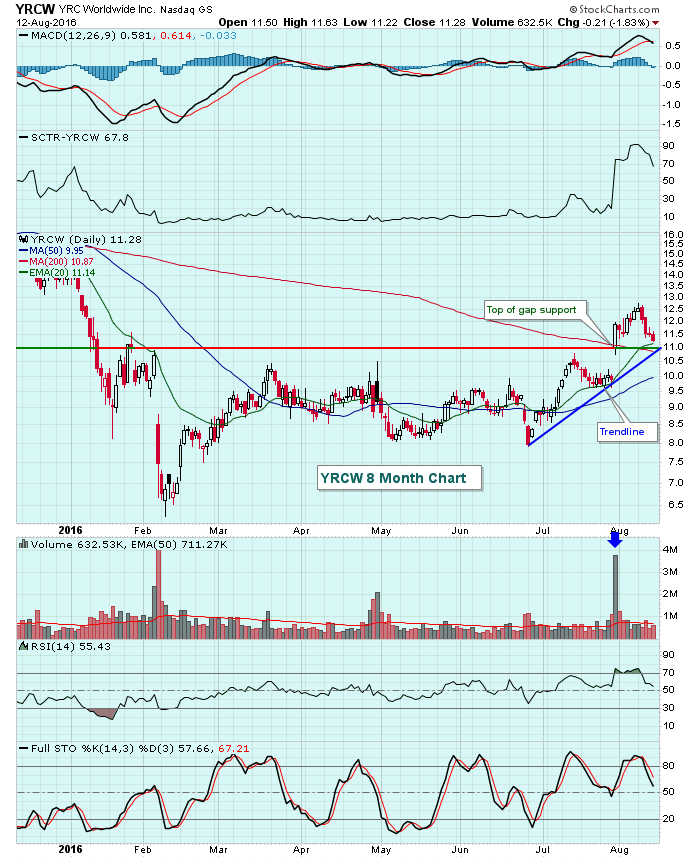
Here's A Trucker Looking For Gap Support
by Tom Bowley,
Chief Market Strategist, EarningsBeats.com
YRC Worldwide (YRCW) recently posted quarterly results that blew away Wall Street consensus estimates with EPS reported at $.83. The estimate was for just $.51. That news was well received by traders as YRCW gapped up and opened at 10.98 on July 29th and never looked back. After becoming...
READ MORE
MEMBERS ONLY
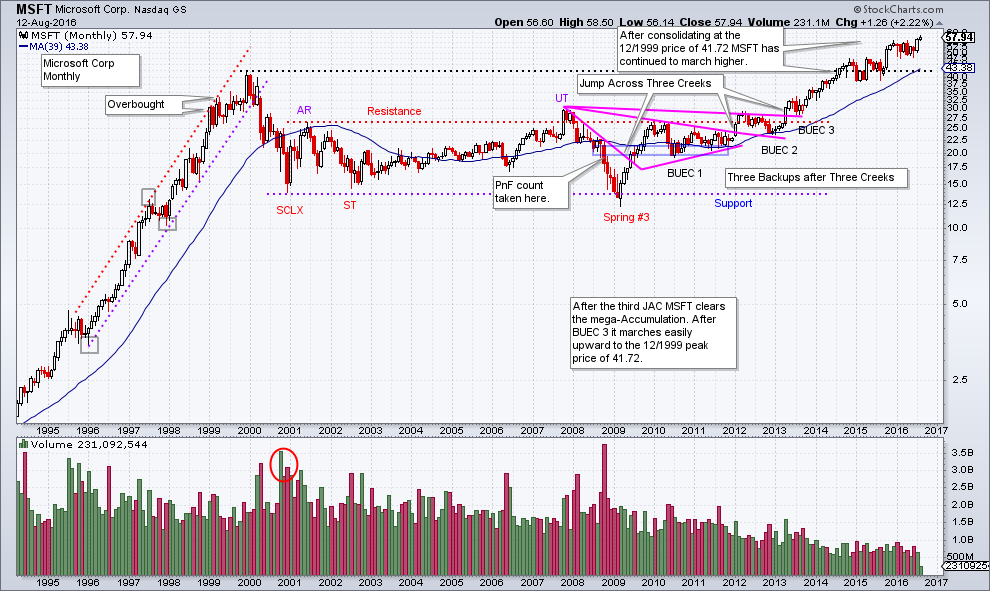
The Really Big Picture

by Bruce Fraser,
Industry-leading "Wyckoffian"
The Wyckoff Method scales down into smaller timeframes. It also is very effective in large timeframes. We have spent much time and attention evaluating daily and weekly charts (and intraday charts). Now we will turn our attention to monthly charts where a decade or more of data can be evaluated....
READ MORE
MEMBERS ONLY
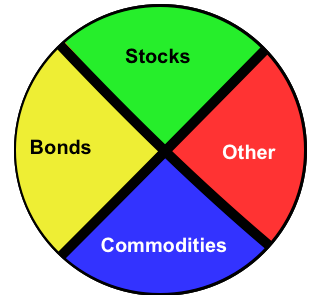
SystemTrader - A Timing-Momentum System for Trading Asset Classes - Vanguard Mutual Funds and ETFs - Revised
by Arthur Hill,
Chief Technical Strategist, TrendInvestorPro.com
SystemTrader // Introduction // Setting Ground Rules // Picking the Securities // Buy-and-Hold Performance // Reducing Drawdowns with Simple Timing // Increasing Returns with Pure Momentum // Combining Trend-Following and Momentum // Conclusions - Past Performance.... // Asset Group ETFs // Further Study //// ........
Introduction
Today we will dive into the world of asset class rotation by testing some tradi...
READ MORE
MEMBERS ONLY

All Successful Investors Need an EDGE: Here's Mine

by Gatis Roze,
Author, "Tensile Trading"
All successful investors must have some type of “edge”. If you don’t know what yours is, odds are you don’t have one.
Not long ago, I heard an address by Ben Bernanke, the former Fed Chairman, who said, “it’s not illegal to make stupid investments.” I submit...
READ MORE
MEMBERS ONLY

COMMODITY CURRENCIES CONTINUE TO STRENGTHEN -- CANADIAN DOLLAR MAY BE TURNING UP -- EMERGING MARKET CURRENCIES RISE WITH STOCKS -- HONG KONG STOCKS HAVE BEEN CHINESE LEADERS -- BUT A-SHARES MAY BE BOTTOMING AS YUAN STABILIZES

by John Murphy,
Chief Technical Analyst, StockCharts.com
CANADIAN DOLLAR STRENGTENS ... My Tuesday message wrote about the fact that stock ETFs in Canada and Mexico were looking stronger. I also mentioned their stronger currencies resulting from the rebound in crude oil and other commodity prices. With oil rebounding some more this week, commodity currencies in Australia, Canada, Mexico,...
READ MORE
MEMBERS ONLY
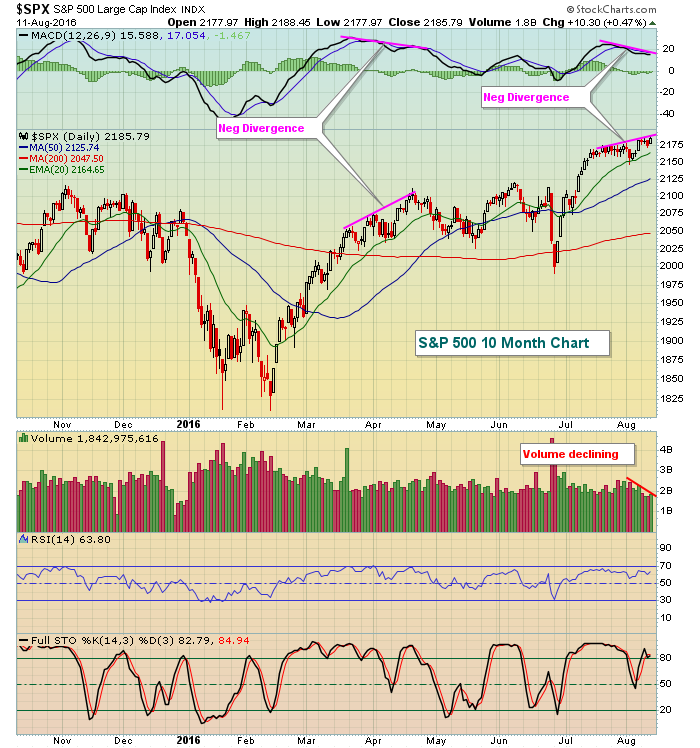
Big Rise In Crude Oil Extends S&P 500 Rally
by Tom Bowley,
Chief Market Strategist, EarningsBeats.com
Market Recap for Thursday, August 11, 2016
Crude oil surged more than 6% yesterday and energy (XLE, +1.47%) led yet another S&P 500 rally with that benchmark index finishing at a record high. Initial price support at 2175 held before the bulls were back on the attack....
READ MORE
MEMBERS ONLY
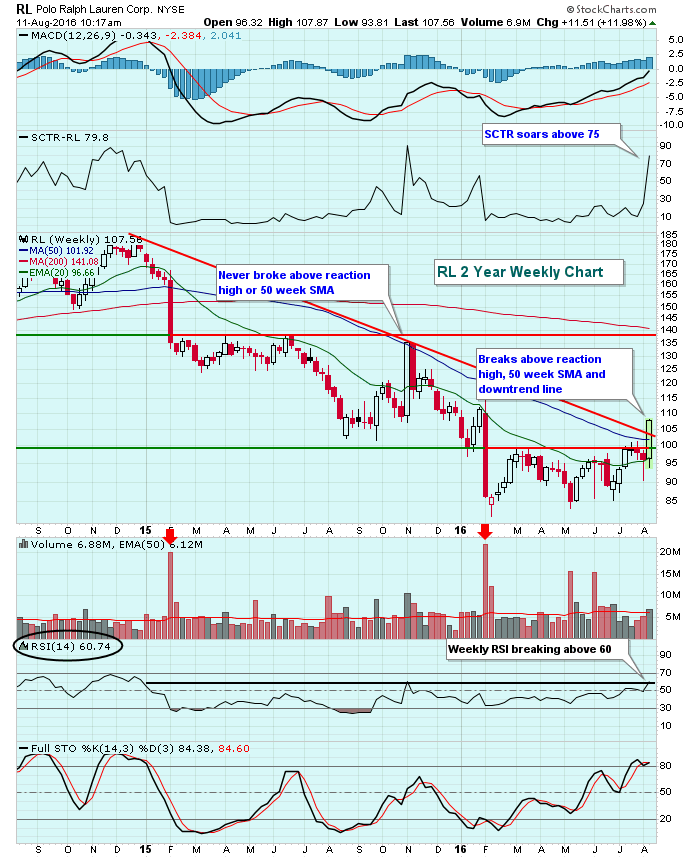
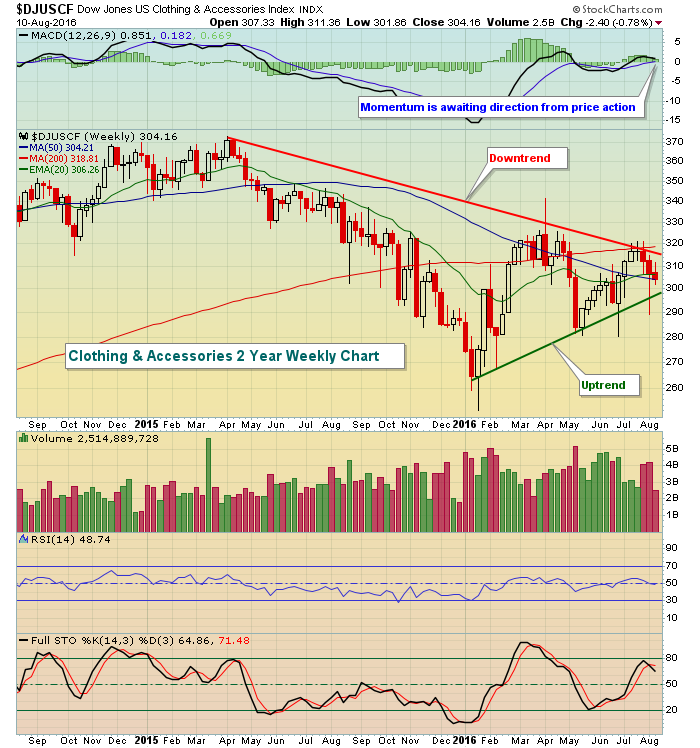
This Clothing Retailer Has Your Back
by Tom Bowley,
Chief Market Strategist, EarningsBeats.com
The Dow Jones U.S. Clothing Accessories Index ($DJUSCF) has been challenged technically with a long-term downtrend and a short-term uptrend currently in play. It'll be interesting to see which way this index breaks, but if the overall market holds any clue, then the DJUSCF will likely break...
READ MORE
MEMBERS ONLY
Should We Shop For Retail Stocks?
by Tom Bowley,
Chief Market Strategist, EarningsBeats.com
Market Recap for Wednesday, August 10, 2016
U.S. stocks fell across all of our major indices on Wednesday (gasp!). Don't worry, it wasn't anything of technical significance. As I highlighted in the Current Outlook section below, the S&P 500 still remains poised for...
READ MORE
MEMBERS ONLY
Bulls Maintain Short-term Edge - Energy Complex Weakens - Setups in IHF and IYZ - Watching XLF and KRE
by Arthur Hill,
Chief Technical Strategist, TrendInvestorPro.com
Bulls Maintain Short-term Edge // Nasdaq and Russell 2000 Outperforming // Energy Complex Weakens Across the Board // Energy-related ETFs Could be Vulnerable // Bullish Setups in HealthCare Providers and Telecoms // Regional Bank SPDR and Finance SPDR Stutter after Breakouts ///// .....
Bulls Maintain Short-term Edge
Long-term, the stock market is in bull mode, which means...
READ MORE
MEMBERS ONLY
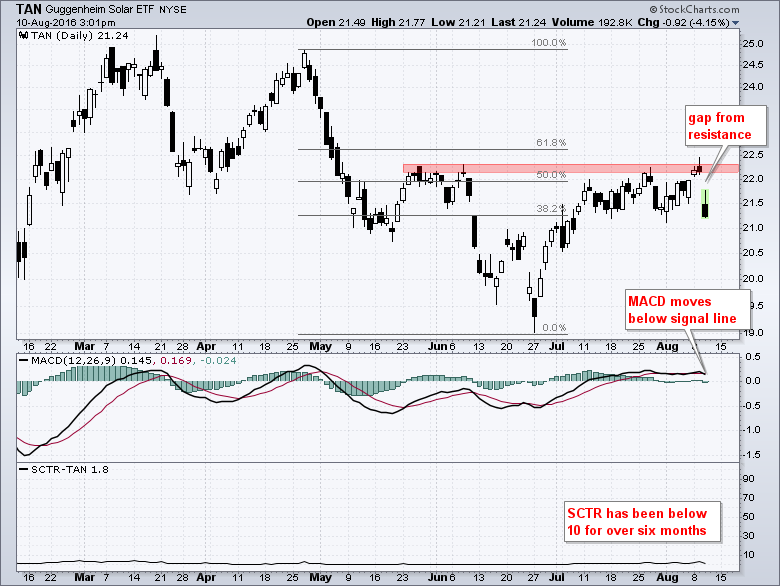
Solar ETF Fails at Resistance Yet Again
by Arthur Hill,
Chief Technical Strategist, TrendInvestorPro.com
The Solar Energy ETF (TAN) got a nice bounce along with the stock market from late June to early August, but this bounce has now reversed and it looks like the bigger downtrend is resuming. The chart shows the highs from late May and early June marking resistance in the...
READ MORE
MEMBERS ONLY

The World Order May Be Changing

by Martin Pring,
President, Pring Research
* The S&P 500 versus the world
* If things go against the US, where would be a good place to be?
* A true contrarian play
The S&P 500 versus the world
For several years the US stock market has been outperforming the rest of the world in...
READ MORE
MEMBERS ONLY
Consumer Staples Lead With Weak Volume
by Tom Bowley,
Chief Market Strategist, EarningsBeats.com
Market Recap for Tuesday, August 9, 2016
It was another day of watching paint dry as the Dow Jones, S&P 500, NASDAQ and Russell 2000 gained 0.02%, 0.10%, 0.24% and 0.11%, respectively. The Dow Jones traded in a 70 point range and a final...
READ MORE
MEMBERS ONLY

No Manure - Agribusiness ETF (MOO) Corralled Using DP ETF Tracker
by Erin Swenlin,
Vice President, DecisionPoint.com
DecisionPoint Reports are created everyday but not many know how to use them to quickly find investments. While reviewing the ETF Tracker spreadsheet, I realized there were some interesting attention flags. Let me enlighten you on a very underused investment tool available to members.
While Price Momentum Oscillator (PMO) scans...
READ MORE
MEMBERS ONLY

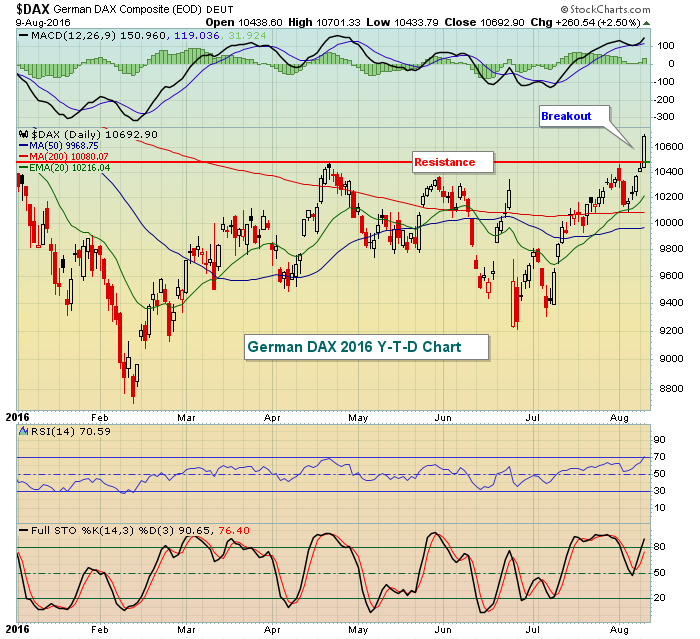
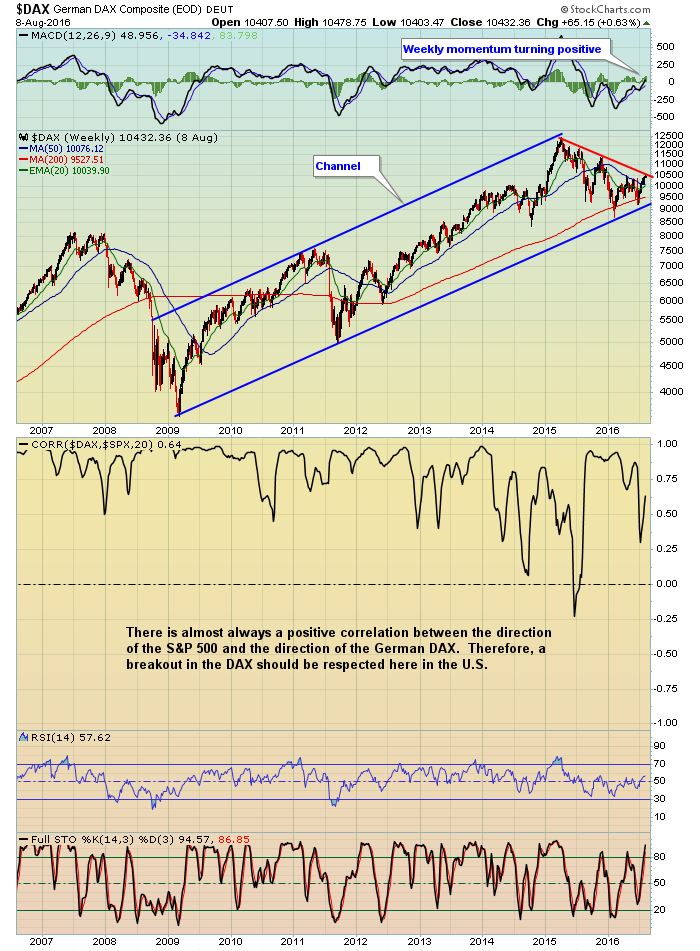
MSCI ALL WORLD STOCK INDEX HITS 12-MONTH HIGH -- VANGUARD ALL-WORLD EX US ETF ACHIEVES BULLISH BREAKOUT -- CANADIAN STOCKS CONTINUE TO CLIMB -- BRAZIL ISHARES HAVE STRONG YEAR -- MEXICO ISHARES MAY BE TURNING UP -- GERMAN STOCKS LEAD EUROPE HIGHER
by John Murphy,
Chief Technical Analyst, StockCharts.com
MSCI ALL COUNTRY WORLD INDEX HITS 12-MONTH HIGH ... Chart 1 shows the MSCI All Country World Index iShares (ACWI) trading at the highest level since last July. The index of world stocks recently broke through a "neckline" drawn over its November/May highs. The ACWI includes stocks in...
READ MORE
MEMBERS ONLY
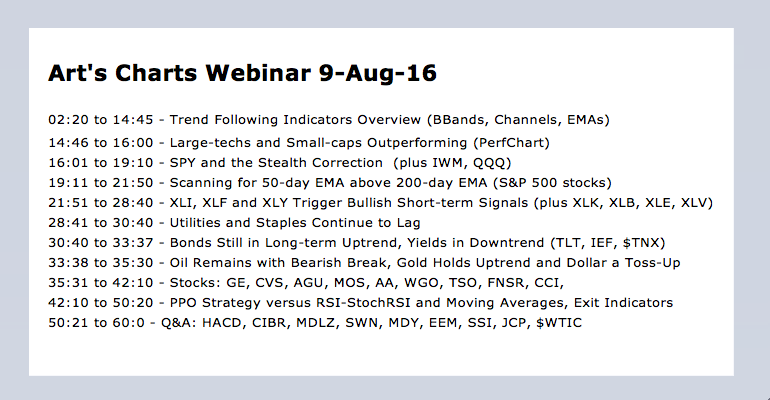
Large-techs and Small-Caps Lead - Utes and Staples Lag - PPO versus RSI-StochRSI Strategy - Webinar Video
by Arthur Hill,
Chief Technical Strategist, TrendInvestorPro.com
Click here for Webinar Video
Large-techs and Small-caps Outperforming // SPY and the Stealth Correction // Golden Crosses remain for All Nine Sector SPDRs // XLI, XLF and XLY Trigger Bullish Short-term Signals // Utilities and Staples Continue to Lag // PPO Strategy versus RSI-StochRSI and Moving Averages // Webinar Preview ///// .....
Large-techs and Small-caps Outperforming
Once...
READ MORE
MEMBERS ONLY
Where's The Summer Weakness?
by Tom Bowley,
Chief Market Strategist, EarningsBeats.com
Market Recap for Monday, August 8, 2016
It's summer time in the stock market, but you wouldn't know it by the action since June 27th. There's no doubt the rally has been strong, but most of the gains have occurred during the more bullish...
READ MORE
MEMBERS ONLY

Know Thyself III
by Greg Morris,
Veteran Technical Analyst, Investor, and Author
This is the third article dealing with cognitive biases that totally screw up your decision making. The first article, Know Thyself, covered anchoring, confirmation bias, herding, hindsight bias, overconfidence, and recency. The second article, Know Thyself II, covered availability, calendar effects, cognitive dissonance, disposition effect, and loss aversion/risk aversion....
READ MORE
MEMBERS ONLY
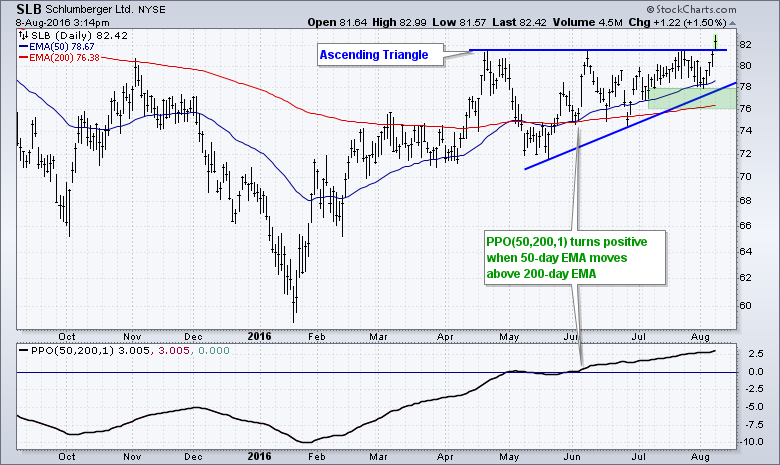
Schlumberger Confirms Bullish Continuation Pattern
by Arthur Hill,
Chief Technical Strategist, TrendInvestorPro.com
Schlumberger (SLB) broke above resistance today and this breakout confirms a bullish ascending triangle. First, note that the bigger trend is up because the 50-day EMA is above the 200-day EMA. Chartists can also plot this difference using the Percentage Price Oscillator (50,200,1), which is shown in the...
READ MORE
MEMBERS ONLY
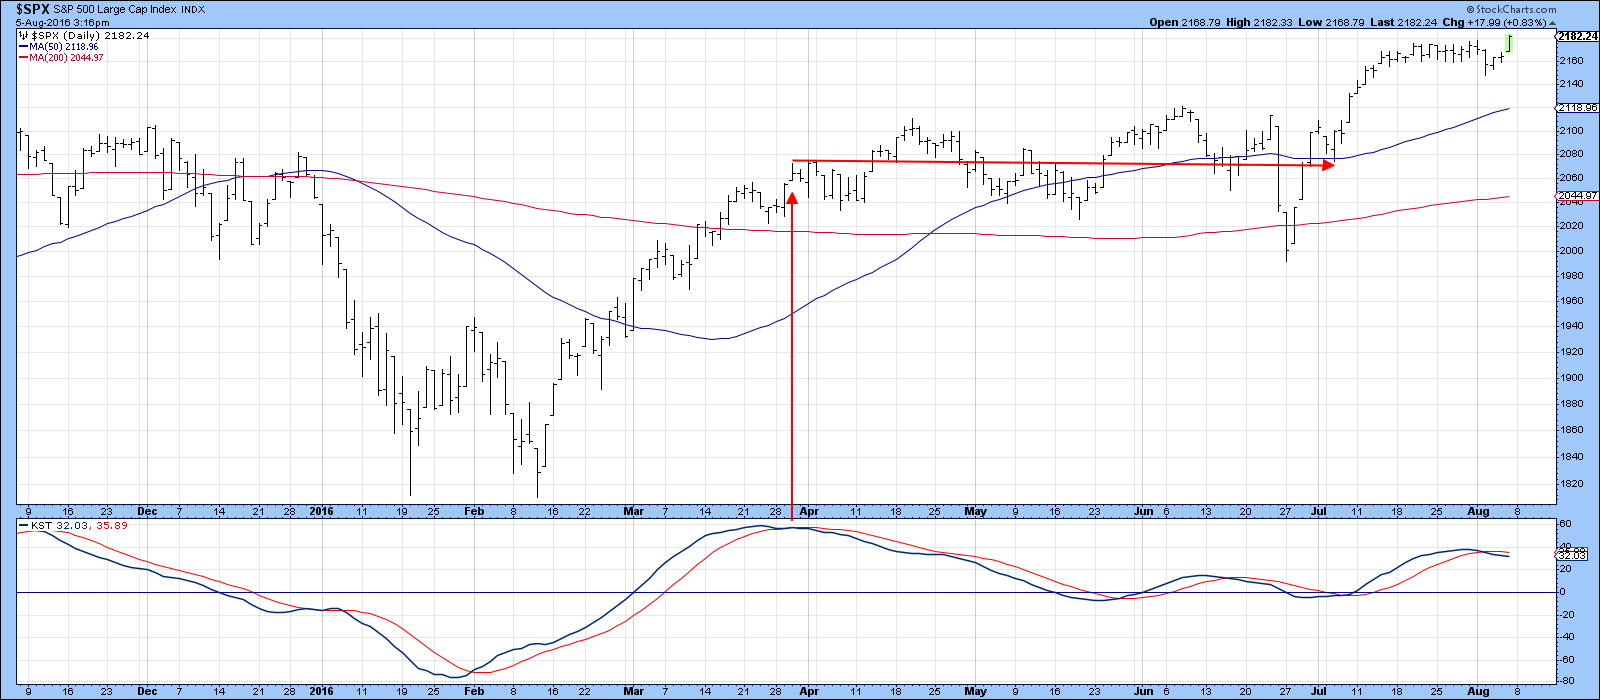
Jobs Beat And Strength In Financials Lead Friday Rally
by Tom Bowley,
Chief Market Strategist, EarningsBeats.com
Market Recap for Friday, August 8, 2016
Friday was a very solid day for the bulls and not just because the S&P 500 closed at all-time highs again. The part I liked the most was the leadership of the financial sector (XLF, +1.91%). The strength was apparent...
READ MORE
MEMBERS ONLY

The Technical Case For A Major Reversal In Bond Yields
by Martin Pring,
President, Pring Research
Two charts that may soon look to the bullish side for rates
Short-term technicals
Watch those metals
In the last 35 years, analysts and investors have gotten used to seeing ever lower rates, even negative ones in Europe and Japan. It seems to me that things may be getting out...
READ MORE
MEMBERS ONLY
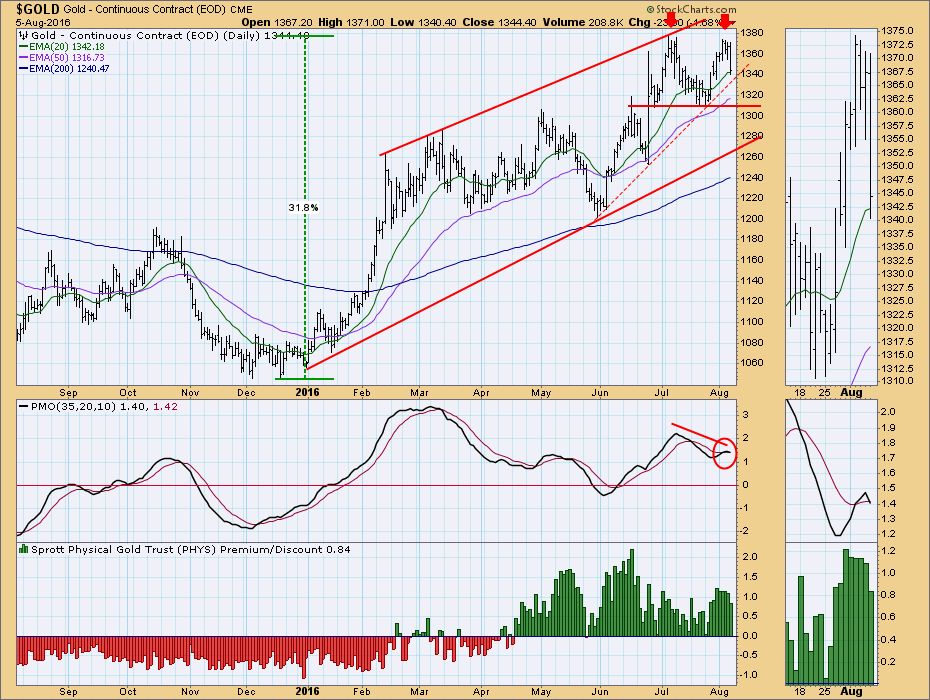
GOLD: Double Top Stall
by Carl Swenlin,
President and Founder, DecisionPoint.com
Gold has been trending upward since the beginning of this year, establishing a well-defined rising trend channel. More recently it rallied off this July's price low, making another run for the top of the channel, but it failed just short of the previous high, forming a double top....
READ MORE
MEMBERS ONLY
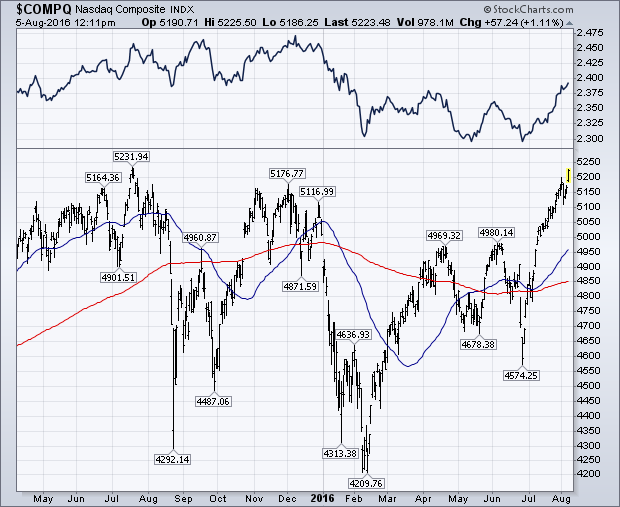
Nasdaq Nears Record - Microsoft is Already There
by John Murphy,
Chief Technical Analyst, StockCharts.com
The Nasdaq Composite Index is on the verge of joining the Dow and S&P 500 in record territory. The first chart below shows the $COMPQ trading at the highest level in a year, and on the verge of clearing last July intra-day peak at 5232. The Nasdaq 100...
READ MORE
MEMBERS ONLY
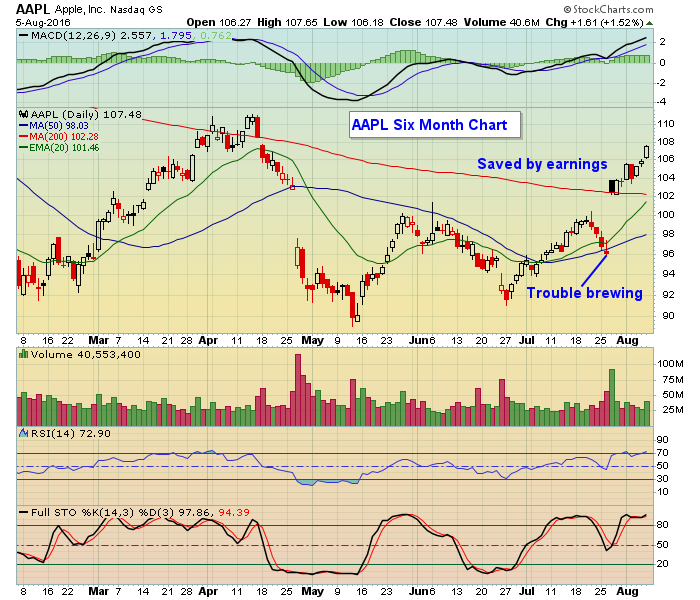
Earnings Power Market Higher

by John Hopkins,
President and Co-founder, EarningsBeats.com
The market has seen both the Dow and S&P hit record highs recently and now the NASDAQ wants to join the party. In fact the NASDAQ got to within just a few points of its all time high Friday, fueled by a very positive response to earnings in...
READ MORE
MEMBERS ONLY

A Gaggle of Groups
by Bruce Fraser,
Industry-leading "Wyckoffian"
So much time is spent on the study of the S&P 500 ($SPX) and other broad market indexes that we forget to have a look at the core themes that make up the performance of the entire market. Let’s take some time to review the underlying sectors...
READ MORE
MEMBERS ONLY

On Conferences (and Why Ours is Better!)
Hello Fellow ChartWatchers!
So as I write this, I’m crammed into seat 18F on the red-eye back to Seattle. I can barely type on my laptop thanks to the wonderful people all around me. It’s not their fault, but I’m about to ask the flight attendant if...
READ MORE
MEMBERS ONLY
SystemTrader - BBand Breakout - Donchian Channels - Weekly EMA Test - Trend Troika Strategy
by Arthur Hill,
Chief Technical Strategist, TrendInvestorPro.com
SystemTrader // Adding Trend to Broad Market Assessment // Three Trend Following Indicators // Using Donchian Channels // Hard to Beat the Humble MA Crossover // Testing Crosses of the 40 Week EMA // Optimizing and Choosing a Focus Index // Setting up the Trend Troika // .....
Adding Trend to Broad Market Assessment
This is the fourth, and...
READ MORE
MEMBERS ONLY
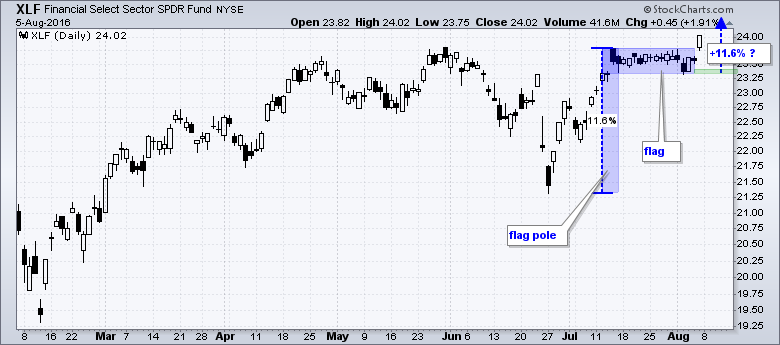
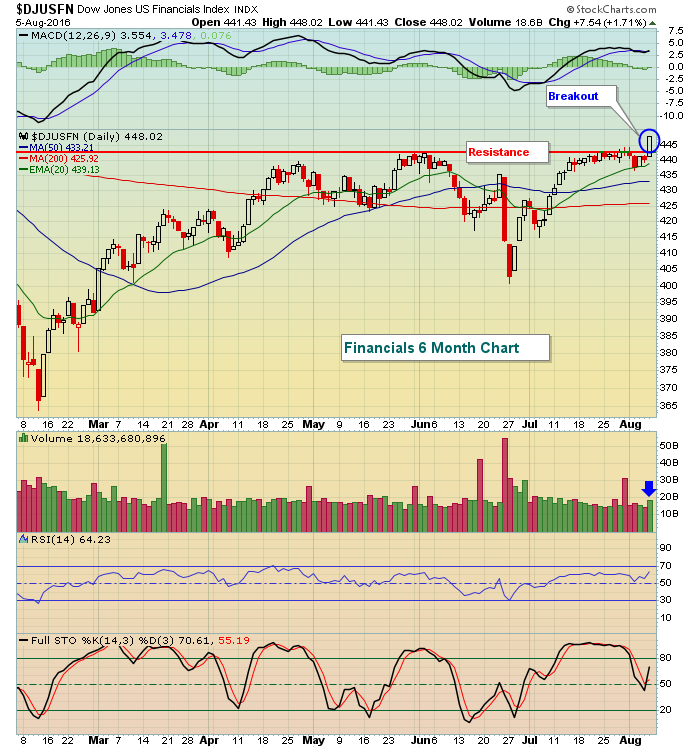
Gaps and Flag Breakouts Dominate Finance Sector
by Arthur Hill,
Chief Technical Strategist, TrendInvestorPro.com
Before looking at some patterns and breakouts, let's first review the basic of the flag pattern. Flags are continuation patterns that depend on the prior move for a directional bias. Flags are bullish continuation patterns when the prior move was up and bearish continuation patterns when the prior...
READ MORE
MEMBERS ONLY
Bearish Short-Term Equity Indicators May Bring Tears To The Bears Themselves!
by Martin Pring,
President, Pring Research
* Short-term technicals
* Two indicators that have not yet gone bullish
* More base building by commodities
* Oil greasing the way?
Last week we looked at some of the longer-term equity indicators. I concluded that prices were likely to work their way significantly higher for the balance of the year, despite historically...
READ MORE
MEMBERS ONLY

One + One = Three/Analogue + Digital/ Fundamentals + Technicals
by Gatis Roze,
Author, "Tensile Trading"
If there’s a better way, take it.
If there’s a bar, raise it.
If there’s a methodology, stake it.
If there’s a dream, chase it.
(paraphrased from an Acura advertisement)
I met a digital trader on the streetcar last month in Toronto. I’ll call him...
READ MORE
MEMBERS ONLY

STRONG JOB REPORT PUSHES STOCKS AND BOND YIELDS HIGHER WITH FINANCIALS IN THE LEAD -- BANK, BROKER, AND INSURANCE ETFS STRENGHEN -- LEADERS INCLUDE BANK OF AMERICA, CHARLES SCHWAB, AND LINCOLN NATIONAL
by John Murphy,
Chief Technical Analyst, StockCharts.com
STRONG JOB REPORT PUSHES BOND YIELDS HIGHER... An unusually strong July job report is causing more optimism in financial markets. When that happens, stock prices usually rise and bond prices fall which is what's happening today. When bond prices fall, bond yields jump which is also happening. Chart...
READ MORE
