MEMBERS ONLY
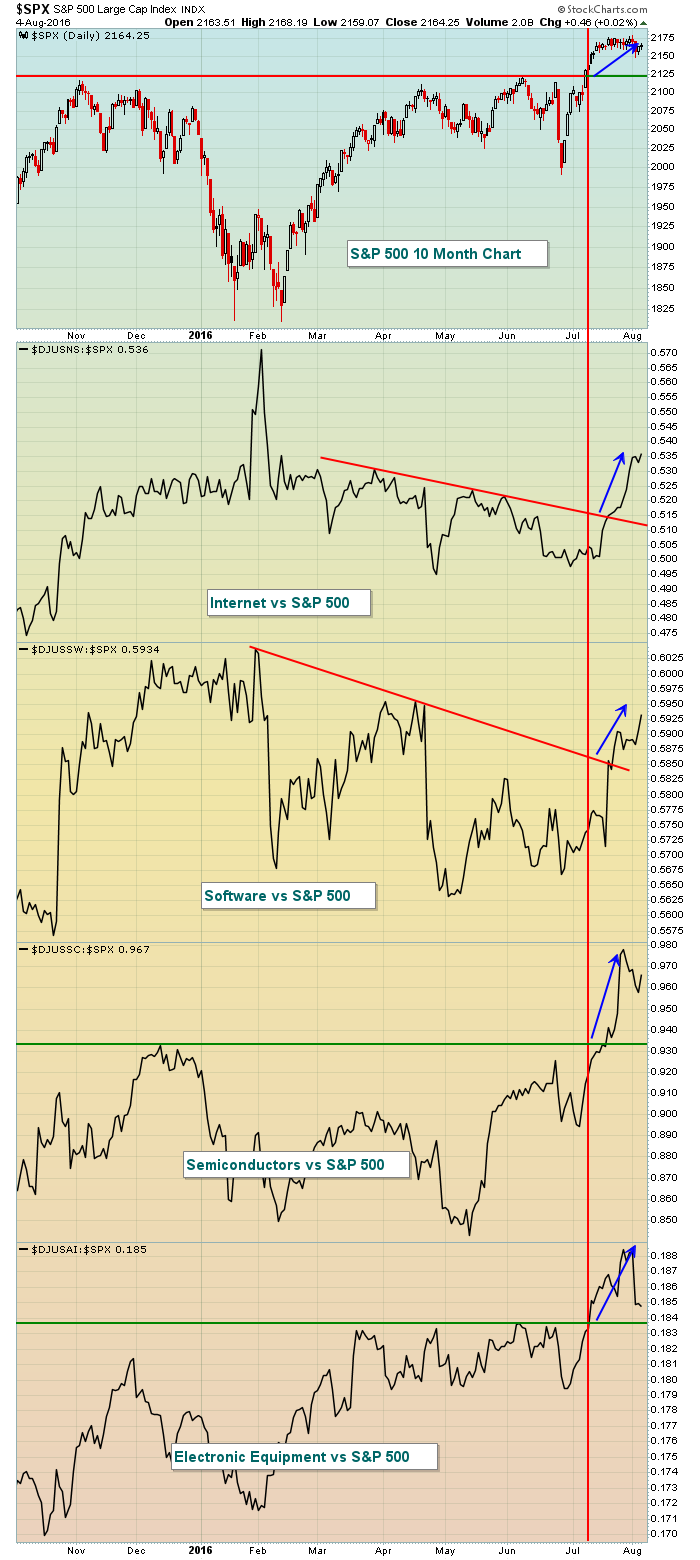
Strength In Technology Shares Continuing To Fuel This Rally

by Tom Bowley,
Chief Market Strategist, EarningsBeats.com
Market Recap for Thursday, August 4, 2016
Technology (XLK, +0.54%) has been the leading sector over nearly every short-term performance measure. Industry groups like internet ($DJUSNS), software ($DJUSSW), semiconductors ($DJUSSC) and electronic equipment ($DJUSAI) have all broken out and are performing exceptionally well vs. the S&P 500....
READ MORE
MEMBERS ONLY
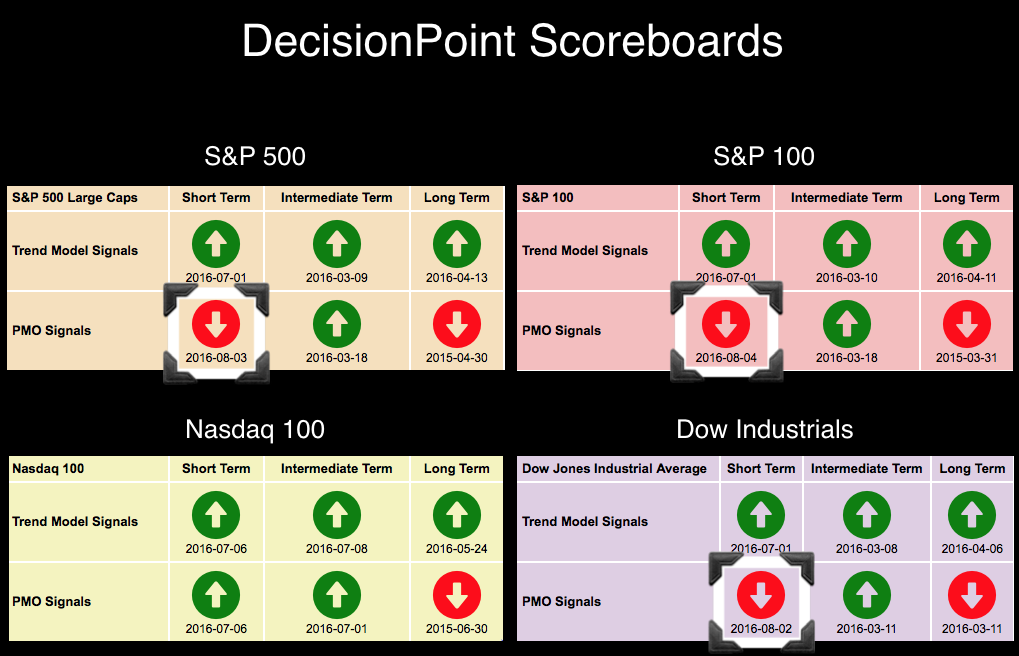
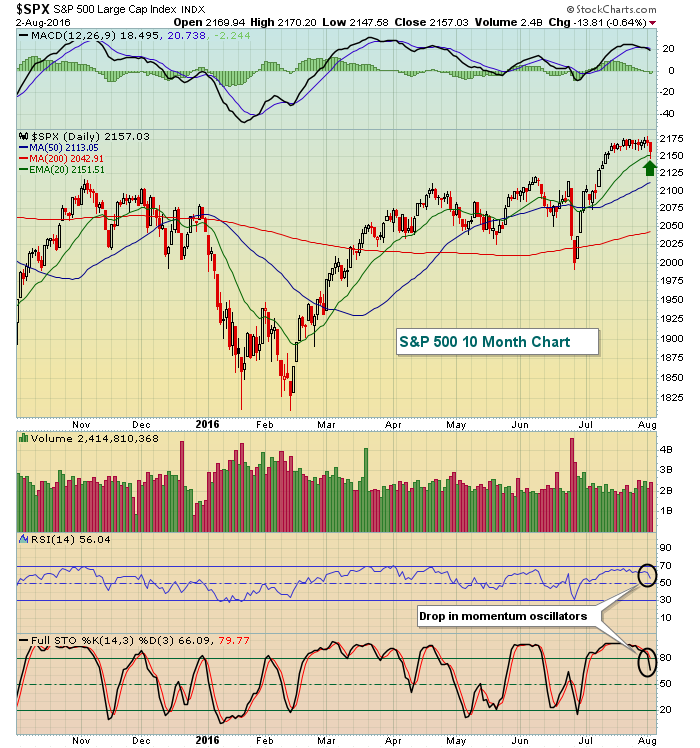
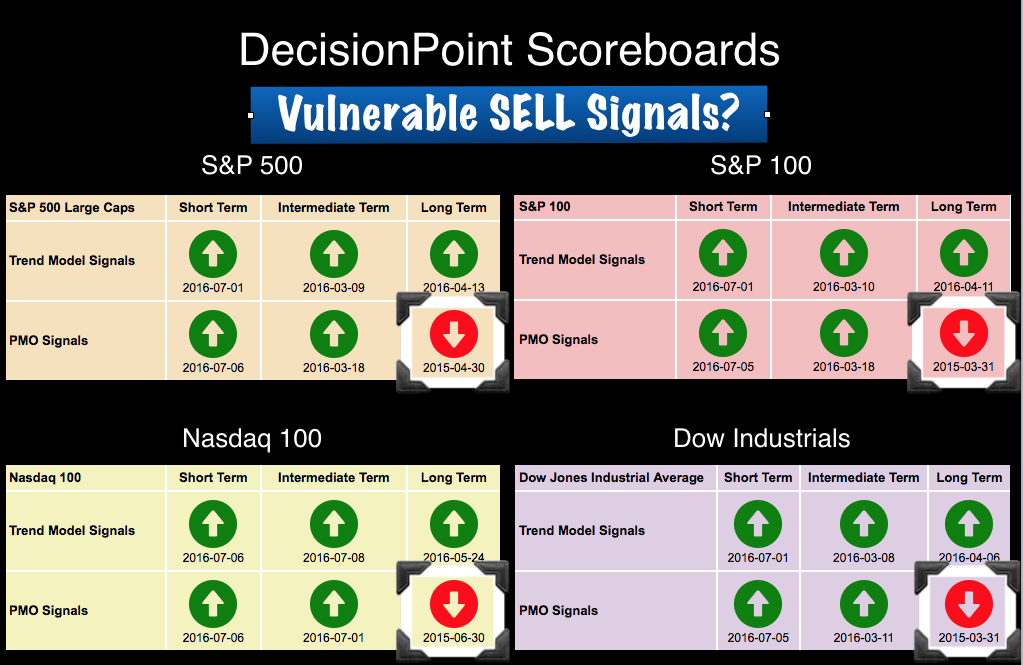
Three New DP Scoreboard PMO SELL Signals

by Erin Swenlin,
Vice President, DecisionPoint.com
As you can see on the DP Scoreboards, this week has brought three new Price Momentum Oscillator (PMO) SELL signals to the Dow, SPX and today, OEX. The question is whether this spells DOOM for all.
"Doom" is likely too strong an adjective to describe what is being...
READ MORE
MEMBERS ONLY
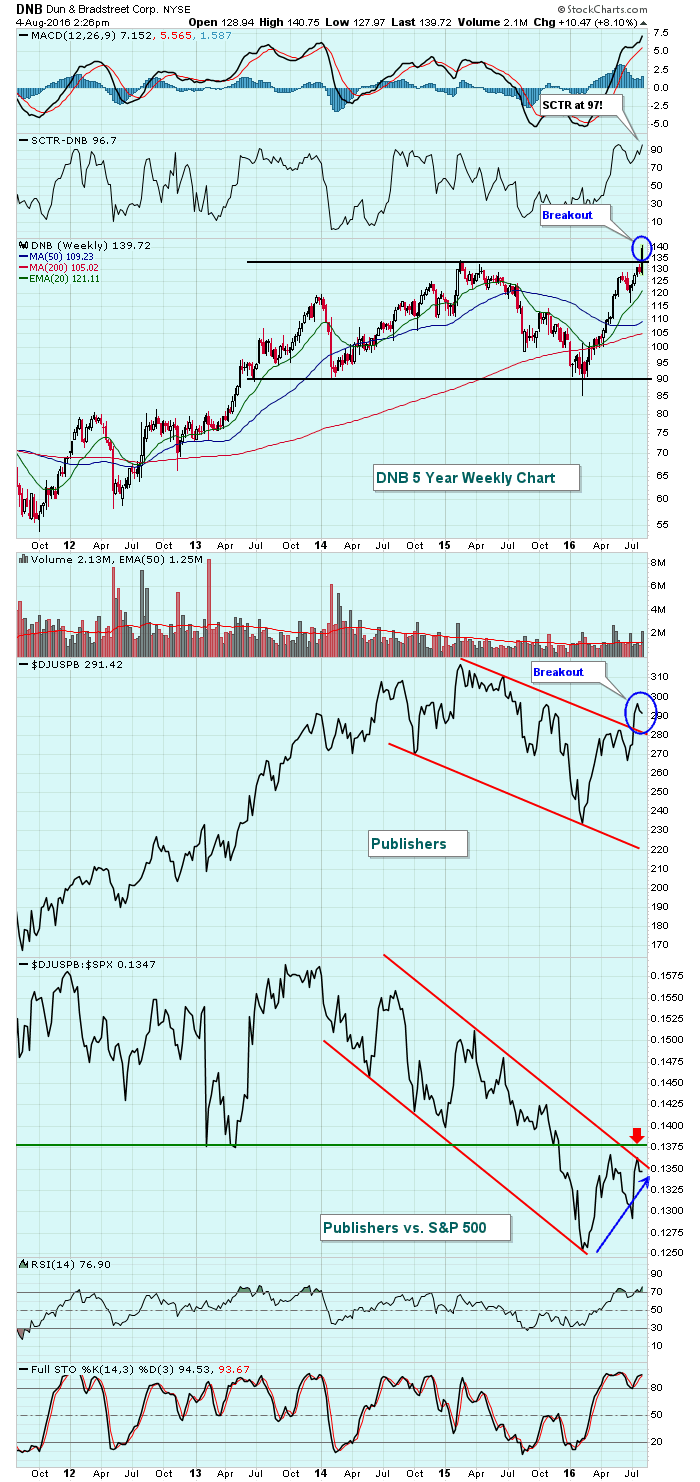
Dun & Bradstreet Breaks Out of Consolidation To Lead Publishers
by Tom Bowley,
Chief Market Strategist, EarningsBeats.com
The Dow Jones U.S. Publishers Index ($DJUSPB) has broken a downtrend on its weekly chart and Dun & Bradstreet (DNB) is one of the best looking companies within this index. DNB posted revenues and EPS that bested Wall Street consensus estimates on Monday after the bell, then proceeded to...
READ MORE
MEMBERS ONLY
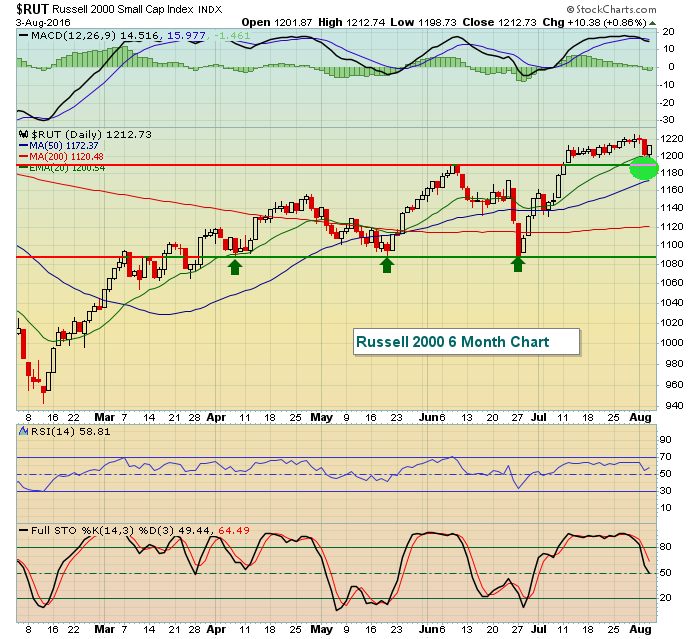
Small Caps, Energy And Financials Lead Rally
by Tom Bowley,
Chief Market Strategist, EarningsBeats.com
Market Recap for Wednesday, August 3, 2016
Strength returned in most areas of U.S. equities on Wednesday, but the gains were more pronounced in the Russell 2000, which rose 0.86%. Among the six sectors in positive territory, none was stronger than energy (XLE, +1.93%) where rebounding crude...
READ MORE
MEMBERS ONLY
Trends Versus Seasonal Patterns - IWM and SPY Hold Short-Term Support - Correlations with the 10-yr Yield (banks, gold, utilities)

by Arthur Hill,
Chief Technical Strategist, TrendInvestorPro.com
Trend > Seasonality // QQQ and IWM Hold Support // EW Finance ETF Nears 52-week High // Measuring Correlations with the 10-yr Yield ///// .....
Trend > Seasonality
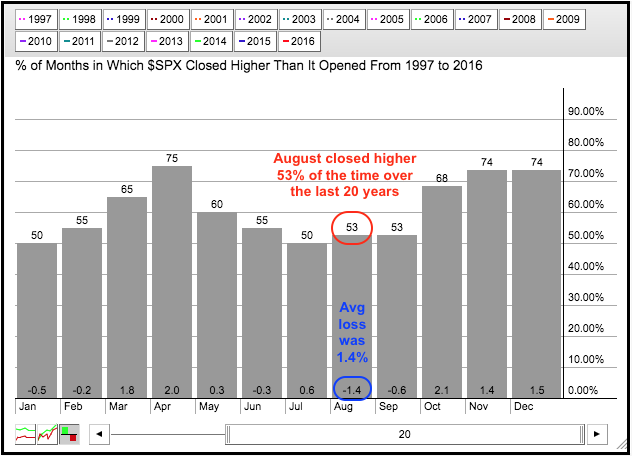
.... I pointed out the negative seasonal pattern for August over the last 20 years, but this does not guarantee a correction or pullback in the stock market....
READ MORE
MEMBERS ONLY

JUMP IN 10-YEAR JAPANESE BOND YIELD MAY BE HINTING AT TREASURY YIELD BOTTOM -- BOND PRICES ARE STARTING TO WEAKEN -- SO ARE BOND PROXIES -- BANKS AND FINANCIALS STRENGTHEN

by John Murphy,
Chief Technical Analyst, StockCharts.com
10-YEAR JAPANESE YIELD SURGES TO FOUR MONTH HIGH... Chart 1 show the 10-Year Japanese Bond yield surging over the last week to the highest level since March. That's the biggest weekly jump in recent memory. Last Friday's disappointing BOJ bond buying program followed by yesterday'...
READ MORE
MEMBERS ONLY
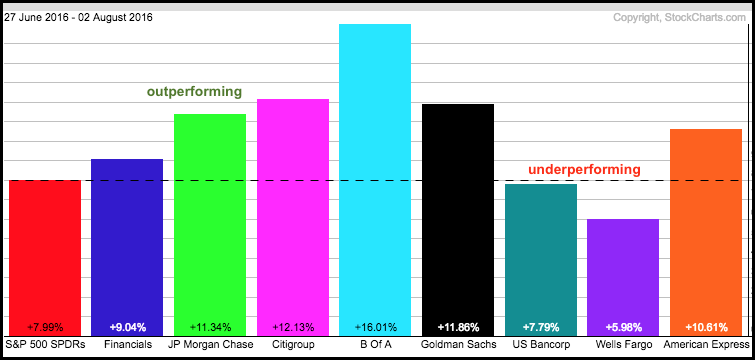
Finance Sector Perks Up as JP Morgan Forms a Flag
by Arthur Hill,
Chief Technical Strategist, TrendInvestorPro.com
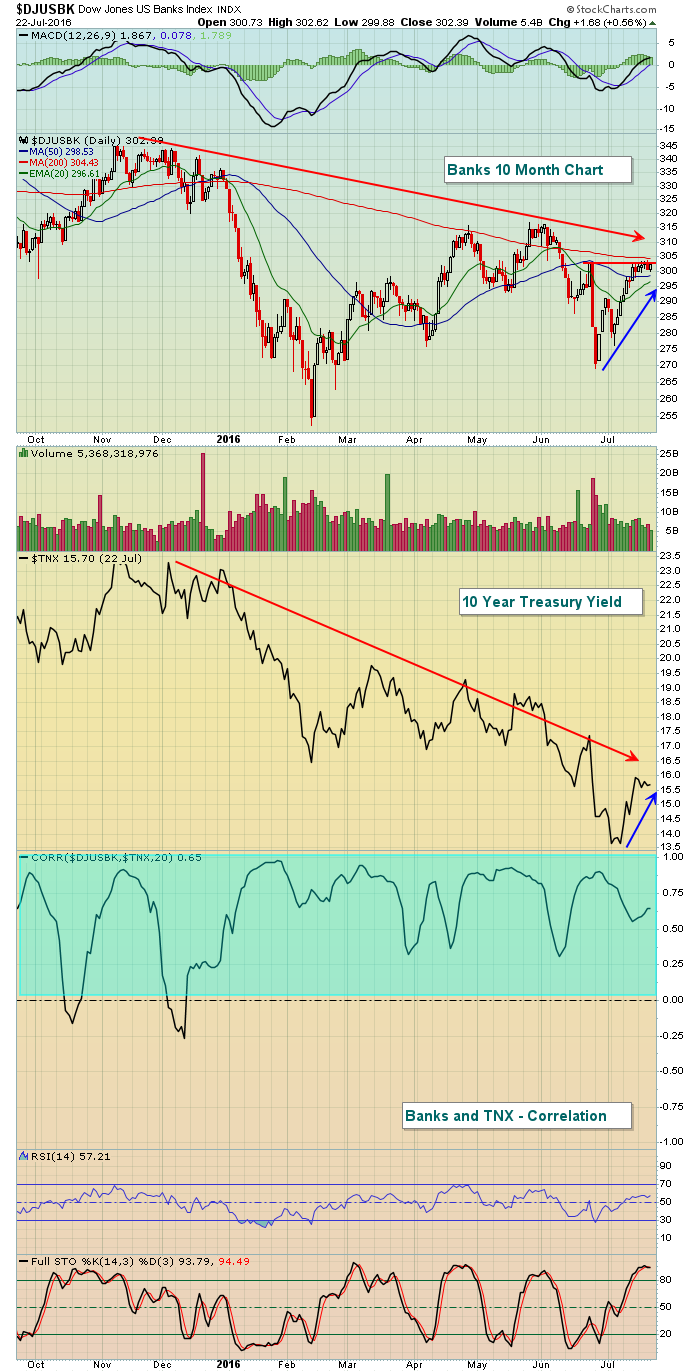
One would not think it from the price charts, but the Finance SPDR (XLF) and several banking stocks are outperforming the S&P 500 SPDR (SPY) since late June. XLF, KRE and many banking stocks are trading below their spring highs and SPY is trading near a 52-week high....
READ MORE
MEMBERS ONLY
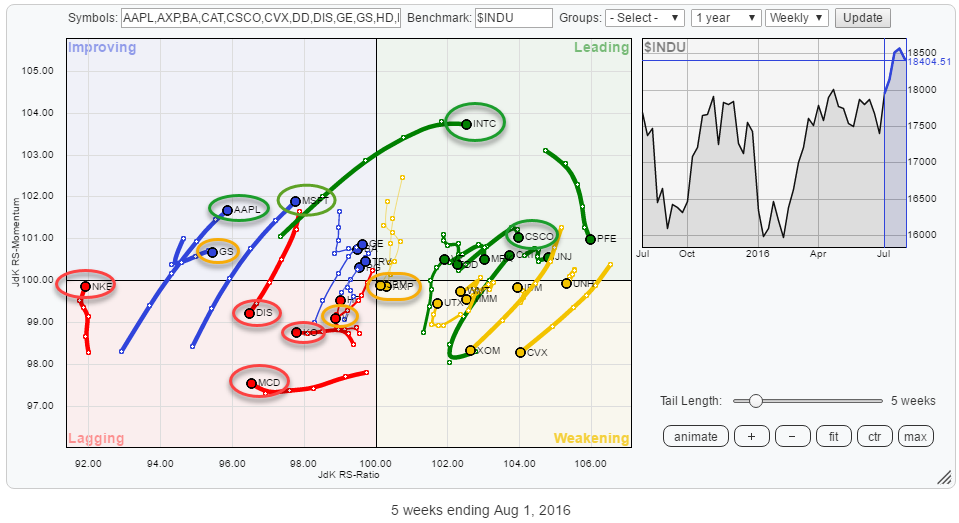
Tech stocks starting to look cool again, Financials not so much... yet!

by Julius de Kempenaer,
Senior Technical Analyst, StockCharts.com
Over the past few weeks, I have argued in some my posts that the state of sector rotation would not back a strong rise for the general market. The "defensive" sectors were simply too strong compared to the, more, cyclical sectors which are usually needed to push a...
READ MORE
MEMBERS ONLY
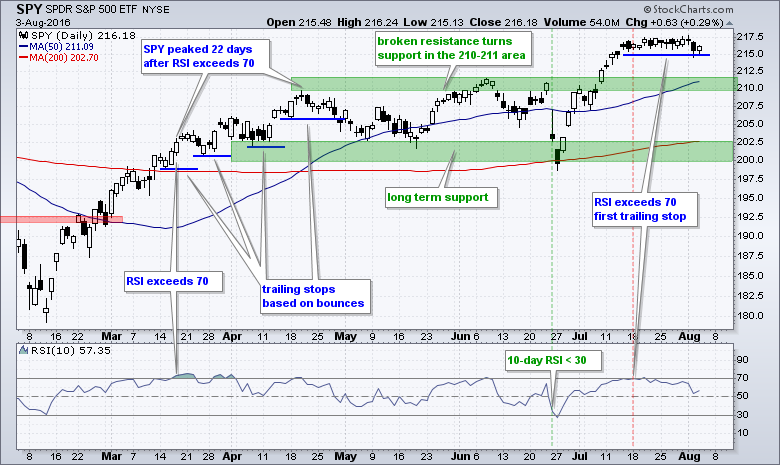
S&P 500 Bounces Off First Key Short-Term Support
by Tom Bowley,
Chief Market Strategist, EarningsBeats.com
Market Recap for Tuesday, August 2, 2016
There was no bifurcated action on Tuesday. There were no major indices threatening breakouts and eight of the nine sectors fell. Finally, the NASDAQ and Russell 2000 saw some much-needed profit taking after a long steady advance off their late-June lows. The S&...
READ MORE
MEMBERS ONLY
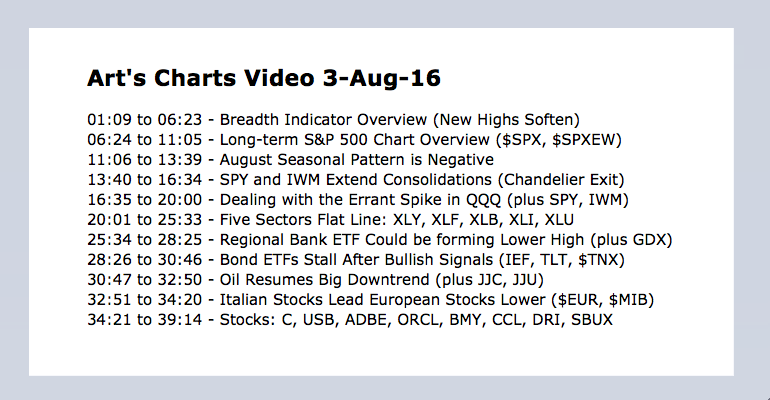
Video - Breadth Overview - Seasonal Patterns - 5 SPDRs Consolidating - GLD and GDX Extend Signals - 8 Stocks
by Arthur Hill,
Chief Technical Strategist, TrendInvestorPro.com
Tuesday's webinar for Art's Charts was cancelled due to technical difficulties. Most of the webinar is based on the charts from Tuesday's commentary, which are posted again below. In addition to these charts, I am also covering the nine sector SPDRs, T-Bond ETFs, Gold,...
READ MORE
MEMBERS ONLY
SPY is Ripe for Pullback as Seasonals Turn - New Highs Soften - Dealing with the QQQ Spike
by Arthur Hill,
Chief Technical Strategist, TrendInvestorPro.com
Breadth Indicator Review // New Highs Soften in late July // %Above 200-day Remains Strong // Marking First Support for S&P 500 // Dealing with the Spike in QQQ // SPY Extends Trading Range //// .....
The stock market environment remains bullish, but the major index ETFs are extended after big gains the last five...
READ MORE
MEMBERS ONLY
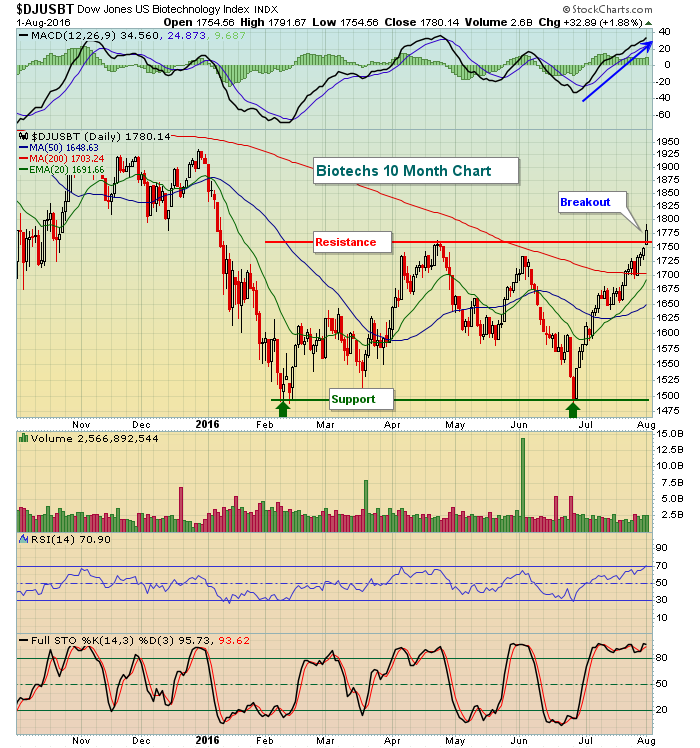
Biotechs Surge Through Resistance To Lead NASDAQ
by Tom Bowley,
Chief Market Strategist, EarningsBeats.com
Market Recap for Monday, August 1, 2016
Monday marked another day of mixed action. The NASDAQ continues to power forward, leading the action. Since July 14th, the NASDAQ has advanced more than 150 points or roughly 3%. During that same time frame, the S&P 500 has barely budged,...
READ MORE
MEMBERS ONLY

WHY the Gap Between Analysis and Action?

by Greg Morris,
Veteran Technical Analyst, Investor, and Author
When I started getting interested in technical analysis, there was no internet, no Amazon, only bookstores. The investing section was usually quite small and the technical analysis sub-section only had a few books. Fast forward today and things have changed considerably. Fewer bookstores and most available online. Amazon seems to...
READ MORE
MEMBERS ONLY
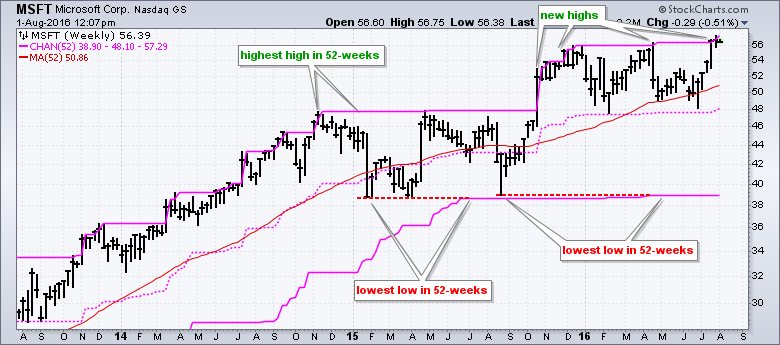
Plotting 52-week Highs on the Microsoft Price Chart
by Arthur Hill,
Chief Technical Strategist, TrendInvestorPro.com
Chartists can plot 52-week highs right on the price chart by using the Price Channels overlay. The upper line of a 52-week Price Channel marks the high of the last 52-weeks, the lower line marks the low and the middle line is the average of the two. By plotting this...
READ MORE
MEMBERS ONLY
Bull Market Escapes July With Barely A Scratch
by Tom Bowley,
Chief Market Strategist, EarningsBeats.com
Market Recap for Friday, July 29, 2016
Friday's end of month action was bifurcated with the Dow Jones lagging and posting a 0.13% decline. The other three major indices did manage to finish in positive territory with sectors finishing in that same bifurcated fashion. Energy (XLE, +1....
READ MORE
MEMBERS ONLY
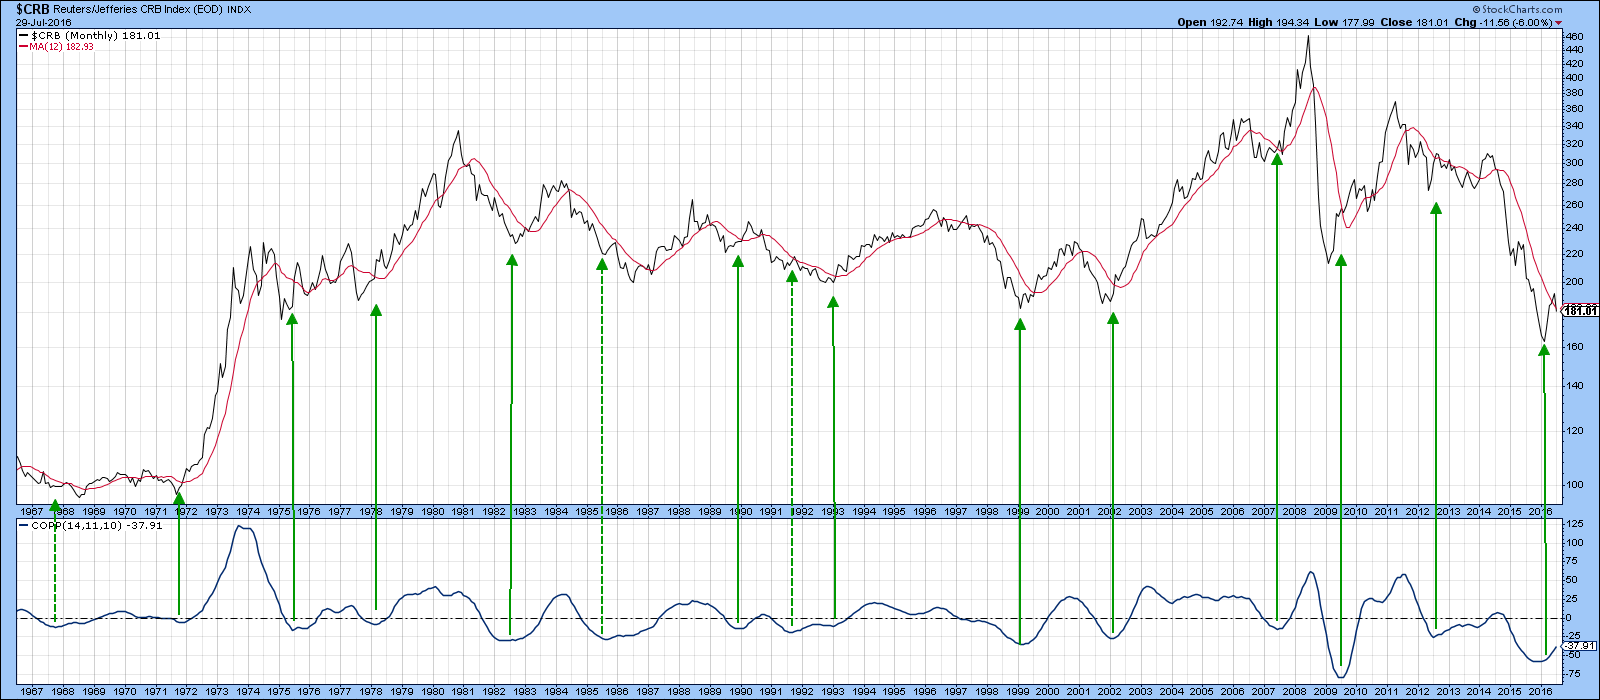
Are Commodities About To Take Off?

by Martin Pring,
President, Pring Research
* The long-term trend
* Shorter-term aspects
* The stock market’s view
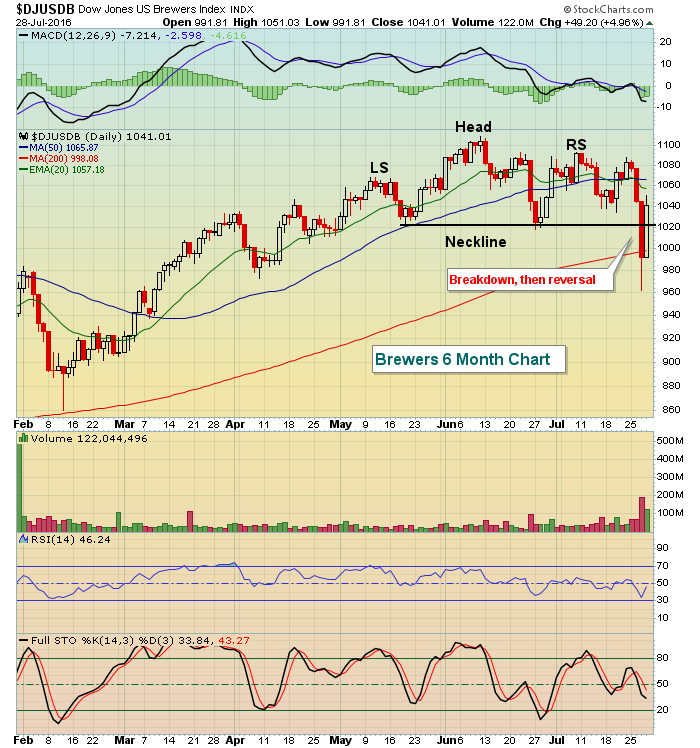
Several weeks ago I suggested that commodity prices were likely to experience a correction of some kind. I also felt that any digestive process might well take the form of the right shoulder of an inverse head and shoulders pattern...
READ MORE
MEMBERS ONLY
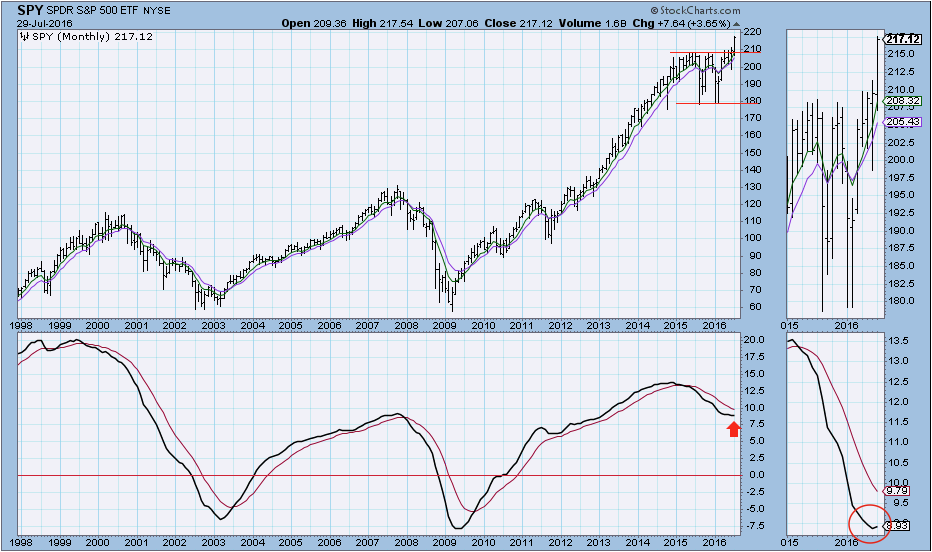
More Bull Market Evidence

by Carl Swenlin,
President and Founder, DecisionPoint.com
I tend to give monthly PMO direction changes heavier weight in my analysis because they often foreshadow long-term changes in the price trend. About two weeks ago the monthly PMO turned up, but monthly readings are not final until the end of the month, so I have been breathlessly watching...
READ MORE
MEMBERS ONLY
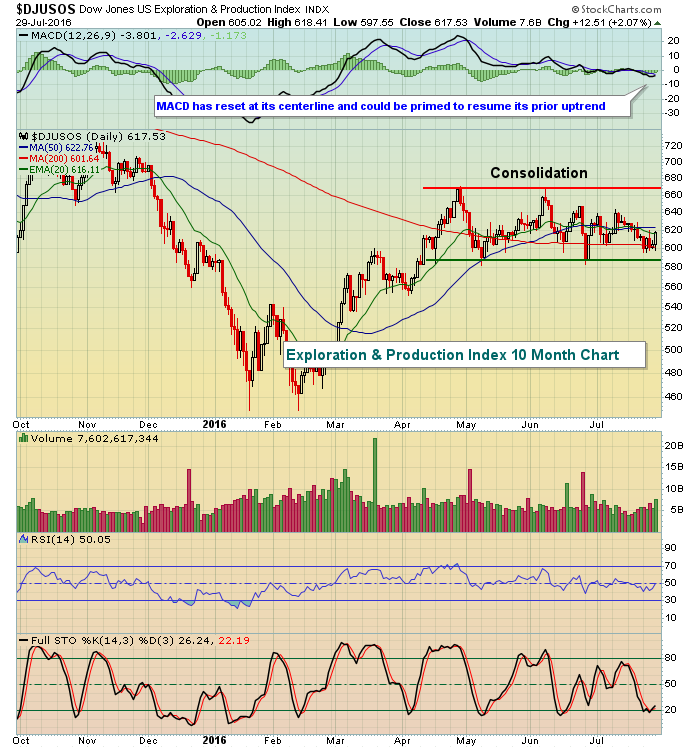
Monthly PMO SELL Signals Vulnerable?
by Erin Swenlin,
Vice President, DecisionPoint.com
The DecisionPoint Scoreboards stopped changing on July 8th as the final BUY signal was added to the Nasdaq 100's Scoreboard. The question is how much longer before the other four SELL signals are erased? The Long-Term Price Momentum Oscillator (PMO) Signal is generated on the monthly charts which...
READ MORE
MEMBERS ONLY

Beach Reads

by Bruce Fraser,
Industry-leading "Wyckoffian"
During the long hot summer, it is a wise idea for Wyckoffians to go to the beach (or the pool) and relax, recharge, and do some light reading. My favorite summer reads are…. Charts!! What could possibly be more relaxing and enjoyable. So get your tablet (or laptop), find a...
READ MORE
MEMBERS ONLY

Flopping in Sports Can Make One Millions / Flopping in Investing Can Cost You Millions

by Gatis Roze,
Author, "Tensile Trading"
As an investor, there is only one day a year that you are unable to do anything about the stock market’s behavior, and that is yesterday. Any other day, your action or inaction will determine your bottom line. As a trader, the two things I must do each day...
READ MORE
MEMBERS ONLY

DOLLAR DROPS ON WEAK GDP REPORT -- YEN SURGES ON BOJ DISAPPOINTMENT -- BLOOMBERG COMMODITY INDEX BOUNCES OFF TRENDLINE -- EMERGING MARKETS ISHARES HIT 12-MONTH HIGH -- EAFE ISHARES NEAR TEST OF SPRING HIGHS -- QQQ TOUCHES NEW RECORD
by John Murphy,
Chief Technical Analyst, StockCharts.com
DOLLAR DROPS AS YEN SURGES... A combination of factors are pushing the U.S. Dollar sharply lower. One is today's report of GDP growing only 1.2% in the second quarter. That pushed Treasury yields lower and bond prices higher and weakened the dollar. Chart 1 shows the...
READ MORE
MEMBERS ONLY
Q2 GDP Is Out And Falls Waaaay Short
by Tom Bowley,
Chief Market Strategist, EarningsBeats.com
Market Recap for Thursday, July 28, 2016
The action on Thursday was different than what we've seen recently as investor focus seemed to turn to safety ahead of the GDP report and after the FOMC announcement on Wednesday. Consumer staples (XLP, +0.44%) and utilities (XLU, +0.39%...
READ MORE
MEMBERS ONLY

Topping or Pausing?
by Erin Swenlin,
Vice President, DecisionPoint.com
One look at the DecisionPoint Scoreboards and a review of the DP Market/Sector Summary and you'll see the plethora of BUY signals and green paint. Yet the market is traveling sideways and has been for 12 days. Should we expect an upside break or downside break? Read...
READ MORE
MEMBERS ONLY

Better Days Lie Ahead
by Martin Pring,
President, Pring Research
* More long-term US Equity indicators turning bullish
* The case for a spirited rally
* Testing the theory
At my webinar last week I pointed out a couple of observations on the US equity market. First, that more and more indicators are signaling a bull market. Second, there are some characteristics that...
READ MORE
MEMBERS ONLY
This Inverse Head & Shoulders Pattern Is Breaking Out On Earnings
by Tom Bowley,
Chief Market Strategist, EarningsBeats.com
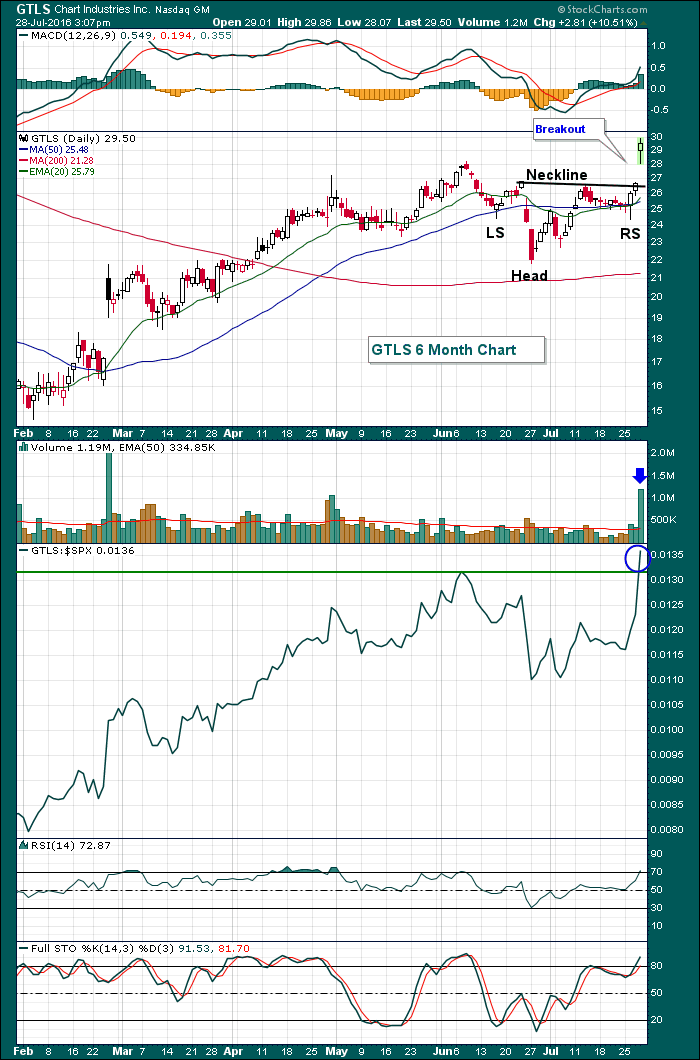
Chart Industries (GTLS) was mired in a downtrend for two years, shedding 90% of its market value, but things have changed and the upward momentum is quickly building for this equipment maker for the energy sector. They blew top and bottom line estimates out of the water and shareholders are...
READ MORE
MEMBERS ONLY
Facebook Delivers On Earnings But Futures Sour
by Tom Bowley,
Chief Market Strategist, EarningsBeats.com
Market Recap for Wednesday, July 27, 2016
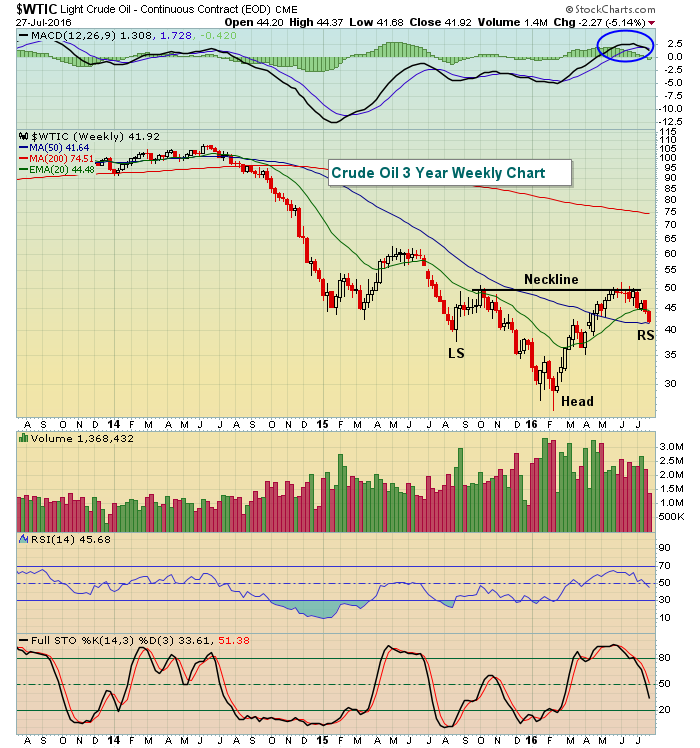
Crude oil ($WTIC) continues to remain under pressure with its fifth consecutive drop on Wednesday. Crude oil has now fallen nearly 20% since topping at $51.53 per barrel on June 8th. From a technical perspective, it shouldn't really be all...
READ MORE
MEMBERS ONLY
A Flag Break for IWM - Looking at August Seasonal Patterns - Adding Parabolic SAR to Gold and Bond Signals
by Arthur Hill,
Chief Technical Strategist, TrendInvestorPro.com
Waning Momentum is Not Always Negative // Selling Pressure Remains Muted // IWM Breaks Out of Flag // Here Comes August // Positive Correlation between Bonds and Gold // Adding Parabolic SAR to IEF Signal // Gold Follows Through on Bullish Signal // Scanning the S&P 1500 for RSI-StochRSI Signals // Scan Code //// .....
Waning Momentum is...
READ MORE
MEMBERS ONLY

NASDAQ GETS BOOST FROM APPLE AND BIOTECHS -- APPLE SURGES 7% HIGHER ON STRONG VOLUME -- TECH SPDR HITS NEW HIGH -- BIOTECH SPDR RISES TO SIX-MONTH HIGH AS AMGEN BUILDS ON BULLISH BREAKOUT -- PHARMACEUTAL ETF ALSO COMPLETES BASE
by John Murphy,
Chief Technical Analyst, StockCharts.com
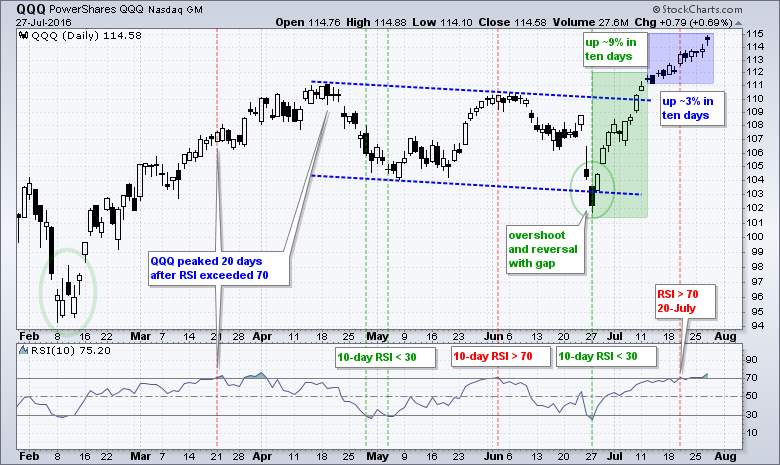
POWERSHARES QQQ NEARS OLD HIGH... Chart 1 shows the PowerShares QQQ climbing again today and in the process of testing its early December high at 114.75. The QQQ achieved a bullish breakout earlier this month and has shown market leadership since then. That can be seen by the rising...
READ MORE
MEMBERS ONLY
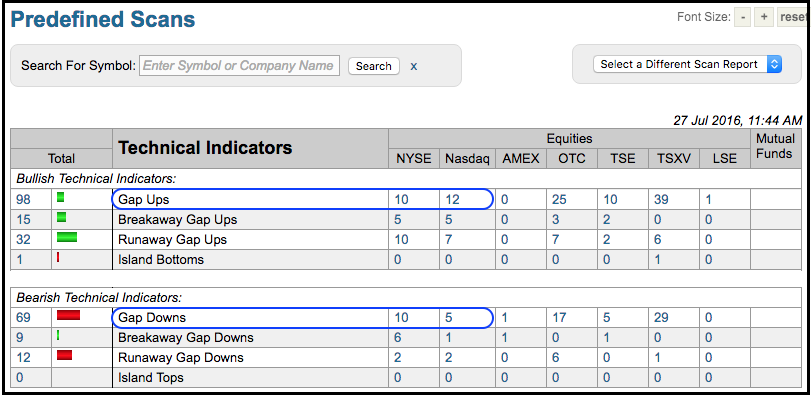
Counting the Gaps for Clues on Earnings Season
by Arthur Hill,
Chief Technical Strategist, TrendInvestorPro.com
There were dozens of gaps today with most coming to the upside. Down gaps in Akamai (AKAM) and Lumber Liquidators (LL) were countered with up gaps in Apple (AAPL) and Buffalo Wild Wings (BWLD). At midday on Wednesday, the Predefined Scan results showed 22 up gaps on the NYSE-Nasdaq, and...
READ MORE
MEMBERS ONLY
Industrials Led By A Breakout In This Industry Group
by Tom Bowley,
Chief Market Strategist, EarningsBeats.com
Market Recap for Tuesday, July 26, 2016
Commercial vehicles & trucks ($DJUSHR) surged 3.34% on Tuesday, leading a rally in industrials (XLI, +0.83%) that once again sustained the advance in the benchmark S&P 500 despite weakness during the first couple hours of the trading session. The...
READ MORE
MEMBERS ONLY

Nasdaq 100 Catching Up to All-Time Highs - What Could This Mean for Market?
by Erin Swenlin,
Vice President, DecisionPoint.com
The Nasdaq 100 has been running toward its all-time highs while the S&P 500 already surpassed its all-time high a few weeks ago. The SPX has been consolidating sideways and rounding ever since the breakout; whereas, the NDX continued to stretch upward. It's visible more clearly...
READ MORE
MEMBERS ONLY
Here Are Key Support And Resistance Prior To AAPL's Earnings
by Tom Bowley,
Chief Market Strategist, EarningsBeats.com
Market Recap for Monday, July 25, 2016
It was a quiet session for most areas of the market. Consumer discretionary (XLY, +0.16%) was the only sector to finish in positive territory, but most of the other sectors lost fractional amounts and it did little to change their technical pictures...
READ MORE
MEMBERS ONLY

WHY Are So Many Esoteric Things Attached to Technical Analysis?
by Greg Morris,
Veteran Technical Analyst, Investor, and Author
I am not sure why there are so many vague and totally subjective analysis techniques that have become part of technical analysis. Probably because the main stream Wall Street and their marketing department, academic finance, does not follow technical analysis like they do the accepted rubbish from the ivory towers....
READ MORE
MEMBERS ONLY
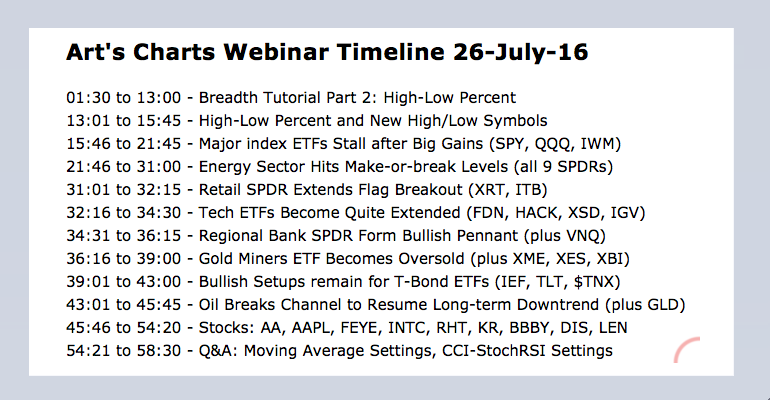
Major Index ETFs Hold Gains - Energy Sector Hits Make-of-Break Level - Oil Resumes Big Downtrend - Webinar Video
by Arthur Hill,
Chief Technical Strategist, TrendInvestorPro.com
SPY Stalls and Gains Hold // Marking First Support for QQQ // IWM Forms High and Tight Flag // Energy Sector Nears Make-or-break Level // XES Breaks Channel Trend Line // Oil Resumes Long-term Downtrend // Webinar Preview //// .....
Click here for Webinar Video
SPY Stalls and Gains Hold
There is no real change in SPY, QQQ...
READ MORE
MEMBERS ONLY
SystemTrader - Difference between SMA and EMA - Using Stocks Above 200-day EMA to Measure Trend Participation
by Arthur Hill,
Chief Technical Strategist, TrendInvestorPro.com
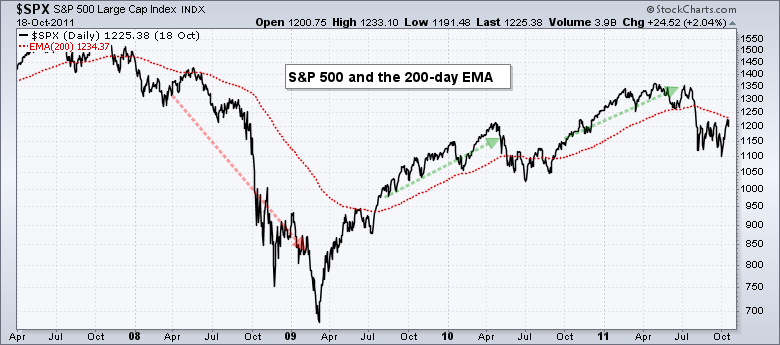
SystemTrader // Introduction - Measuring Trend Participation // 200-day EMA versus 200-day SMA // Backtesting the Moving Averages // Percent above 200-day Breadth Indicator // Smoothing and Reducing Whipsaws // Capturing Broad Market Participation // Conclusions on Trend Participation // Stocks Above EMA Symbols at StockCharts //// . . . . .
Introduction - Measuring Trend Participation
The humble moving average remains on...
READ MORE
MEMBERS ONLY
Tesla Gets a Relative Strength Surge ahead of Earnings
by Arthur Hill,
Chief Technical Strategist, TrendInvestorPro.com
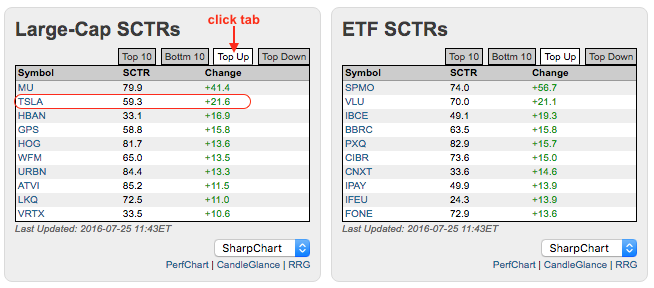
Tesla (TSLA) caught my eye on Monday because its StockCharts Technical Rank (SCTR) surged over 20 points. The image below shows the SCTR tables for large-cap stocks and ETFs. Notice that I clicked the Top Up tabs to view those with the biggest SCTR gains. Micron (MU) is the top...
READ MORE
MEMBERS ONLY
Look Out, Earnings Season Is In Full Swing
by Tom Bowley,
Chief Market Strategist, EarningsBeats.com
Market Recap for Friday, July 22, 2016
Utilities (XLU, +1.33%) surged on Friday to lead all nine sectors higher. All of our major indices also finished higher with most of the gains generated in the afternoon session as traders went home happy for the weekend. Many of the same...
READ MORE
MEMBERS ONLY
Real Estate shines, Stocks are still good, US stocks are even better.
by Julius de Kempenaer,
Senior Technical Analyst, StockCharts.com
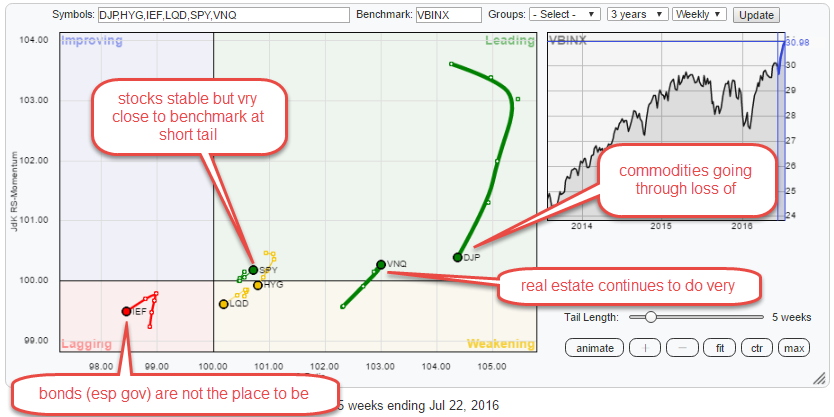
The Relative Rotation Graph below shows the rotation for various asset classes (through ETFs) against the Vanguard Balanced Index fund (VBINX) on a weekly basis.
The picture is pretty conclusive for some asset classes but less so for others. Zooming in on the daily time-frame, usually, helps to add a...
READ MORE
MEMBERS ONLY
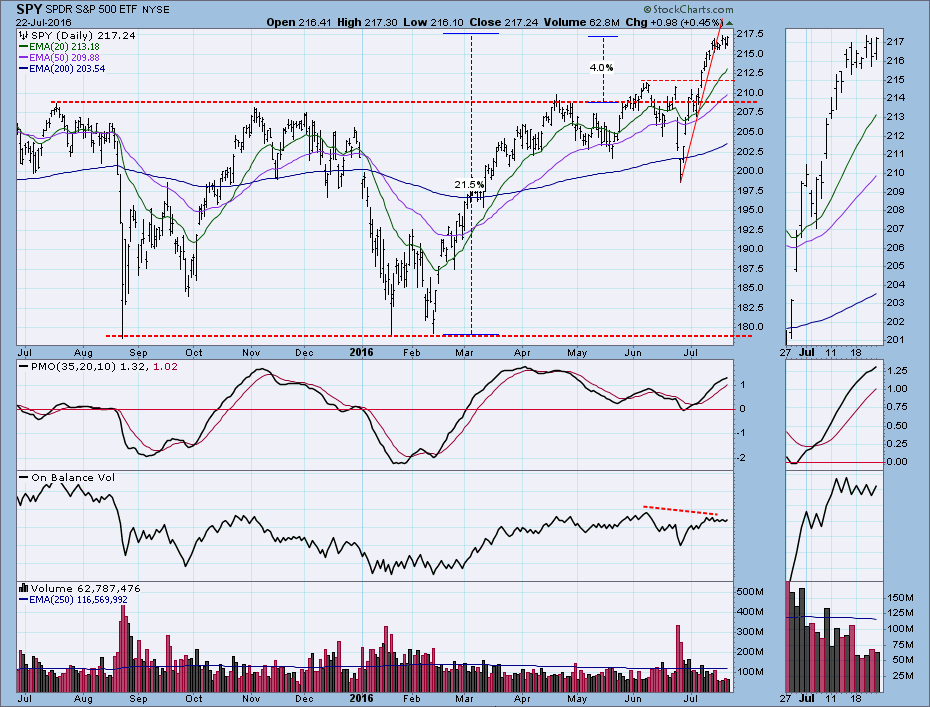
Bull Market: How Old Is It?
by Carl Swenlin,
President and Founder, DecisionPoint.com
The stock market (SPY) has: (1) advanced over +20% from its February low, (2) after breakout, advanced +4% above the top its one-year continuation pattern (consolidation), and (3) generated a DecisionPoint IT Trend Model BUY signal on March 7, 2016. By my reckoning, the bull market is at least five...
READ MORE
MEMBERS ONLY
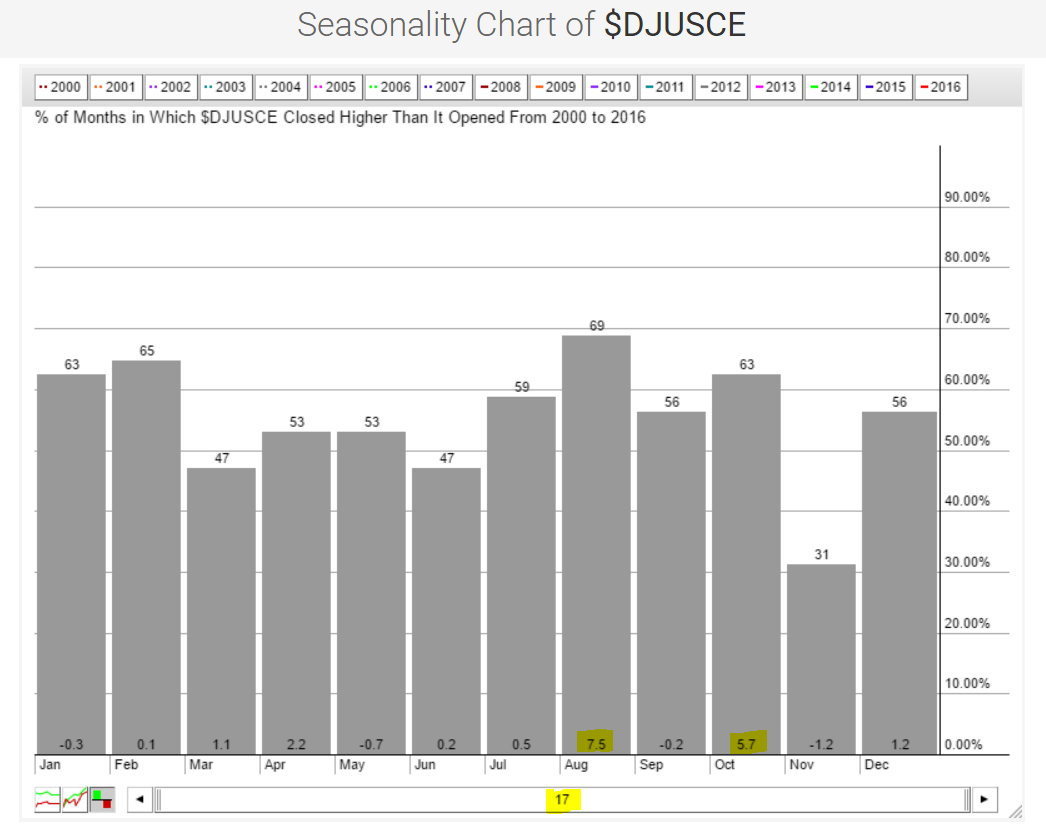
Here Are The Two Best Performing Industry Groups In August
by Tom Bowley,
Chief Market Strategist, EarningsBeats.com
The summer months can be very difficult for U.S. equities, as history has proven over time. But there's always a bull market somewhere and the consumer electronics space seems to find a sweet spot in August. There are only two industry groups that average more than 5%...
READ MORE