MEMBERS ONLY
Here Are The Two Best Performing Industry Groups In August

by Tom Bowley,
Chief Market Strategist, EarningsBeats.com
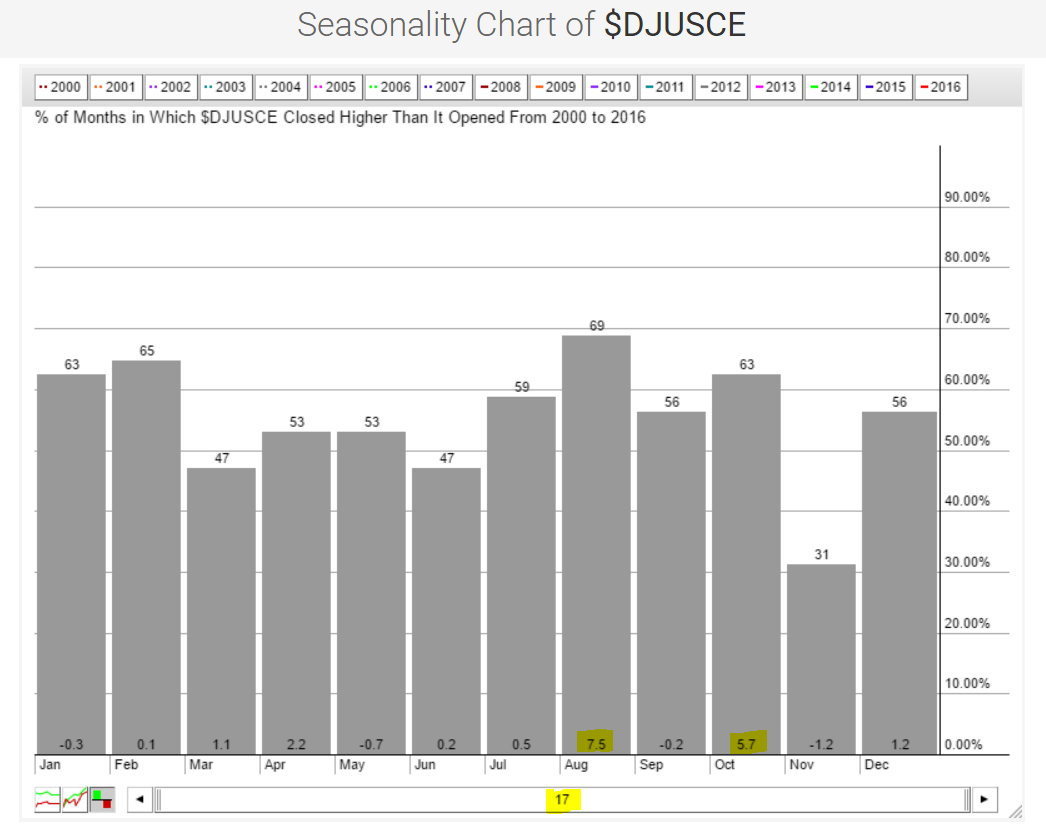
The summer months can be very difficult for U.S. equities, as history has proven over time. But there's always a bull market somewhere and the consumer electronics space seems to find a sweet spot in August. There are only two industry groups that average more than 5%...
READ MORE
MEMBERS ONLY

TECHNOLOGY SHOWS NEW MARKET LEADERSHIP -- EBAY, MICROSOFT, AND QUALCOMM GAP HIGHER -- CISCO ACHIEVES BULLISH BREAKOUTS -- NASDAQ NEARS OLD HIGHS -- BIOGEN AND AMGEN LEAD BIOTECHS HIGHER -- HEALTHCARE PROVIDERS HAVE STRONG WEEK

by John Murphy,
Chief Technical Analyst, StockCharts.com
TECHNOLOGY SPDR SHOWS NEW LEADERSHIP... Stocks had another good week with the Dow and S&P 500 ending Friday at new records. One of the other positive developments was new upside leadership by technology which was the week's strongest sector. Chart 1 shows the Technology Sector SPDR...
READ MORE
MEMBERS ONLY
SystemTrader - Testing and Improving the 5-day RSI Mean Reversion System with the Sector SPDRs

by Arthur Hill,
Chief Technical Strategist, TrendInvestorPro.com
SystemTrader // System Rules and Conditions // Why 5-day RSI? // Testing with S&P 500 Trend Condition // Surviving Some Bad Signals // Sensitivity Testing // Reducing the MDD with Another Trend Condition // Testing Each SPDR Individually // The Power of the Portfolio // Further Study //// ........
Today's Trading Strategy article will test different trading...
READ MORE
MEMBERS ONLY

Point and Figure Pie in the Sky?

by Bruce Fraser,
Industry-leading "Wyckoffian"
During the bear market that ended in 2009, the broad market indexes traced out a large base. Using the horizontal Point and Figure counting methodology, a Wyckoffian could generate a very large price objective. The countline was at the 8,100 level on the Dow Jones Industrial Average, with a...
READ MORE
MEMBERS ONLY

ChartPack Quarterly Updates & Insights 200 New Enhancements (Version 8.25)

by Gatis Roze,
Author, "Tensile Trading"
The last three months since Wiley published our book, Tensile Trading, has given us a unique opportunity to talk with many investors. In doing so, we’ve been able to discuss with them the big picture challenges of managing one’s assets, as well as hear unique testimonials extolling the...
READ MORE
MEMBERS ONLY
Can Tires Rebound To Make It A Good Year?
by Tom Bowley,
Chief Market Strategist, EarningsBeats.com
Market Recap for Thursday, July 21, 2016
Aggressive sectors took a break on Thursday, as did the overall market. The S&P 500 saw its most intraday weakness since breaking out above 2131 to all-time highs more than a week ago. Technically, however, there was little damage done. In...
READ MORE
MEMBERS ONLY

Halfway to Bond Timer of the Year

by Erin Swenlin,
Vice President, DecisionPoint.com
DecisionPoint timing models are tracked by Timer Digest, a professional journal for technical analysis timing. Per their website, "Timer Digest monitors over 100 of the nations leading market timing models, ranking the top stock, bond, and gold timers according to the performance of their recommendations over the previous 52...
READ MORE
MEMBERS ONLY
Encana Breaks Downtrend On Strength Of Earnings
by Tom Bowley,
Chief Market Strategist, EarningsBeats.com
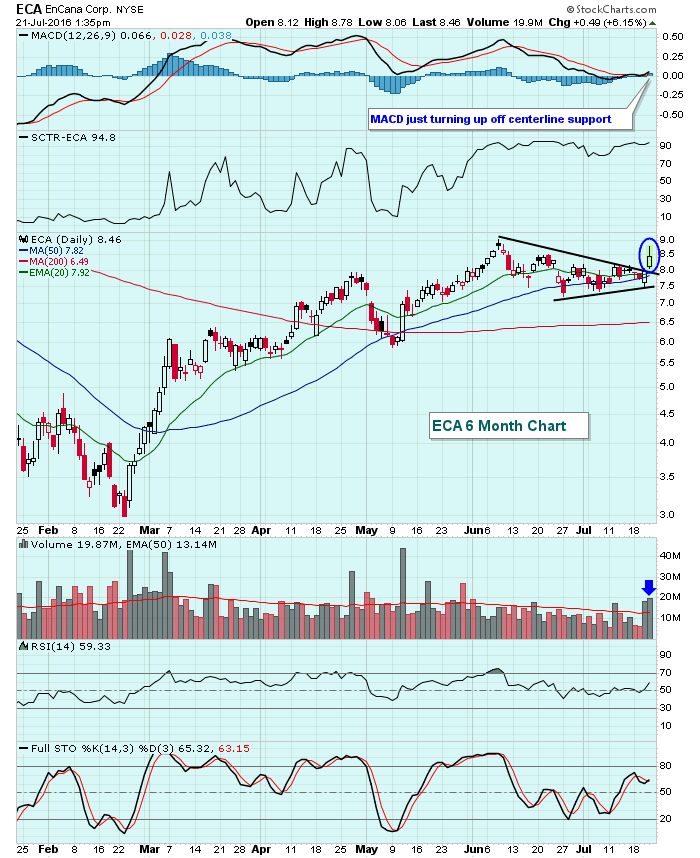
Actually, Encana (ECA) has broken two downtrends - a short-term trend and a long-term trend. ECA hit its all-time high of roughly 42.50 just before this bull market began. Shareholders of ECA haven't seen much bullish action since this seven year bull market began, but technically things...
READ MORE
MEMBERS ONLY
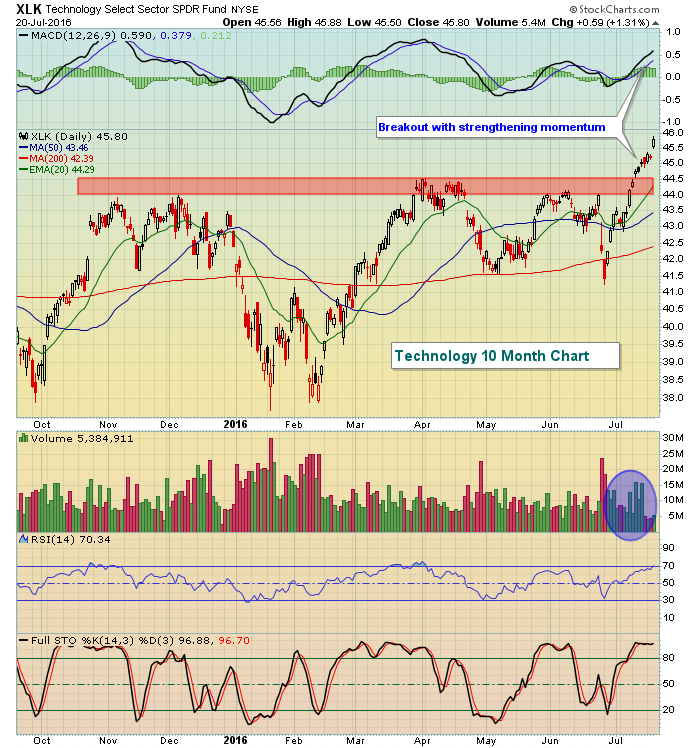
Electronics And Software Lead Technology Rally
by Tom Bowley,
Chief Market Strategist, EarningsBeats.com
Market Recap for Wednesday, July 20, 2016
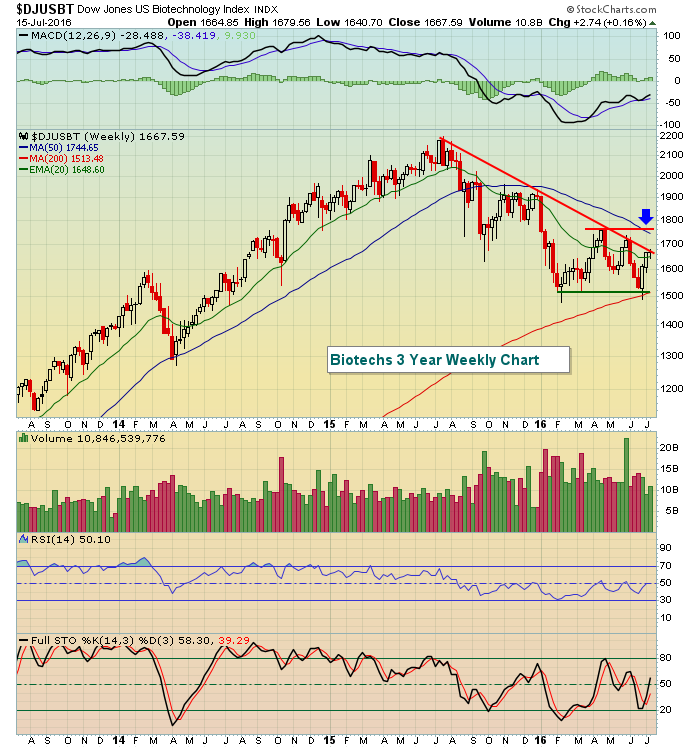
Technology (XLK, +1.31%) had another huge day on Wednesday as consumer electronics ($DJUSCE) and software ($DJUSSW) paced the advance. It didn't hurt that biotechs ($DJUSBT) were up more than 1.50%, leading healthcare to outsized gains as well. But let&...
READ MORE
MEMBERS ONLY
Using Raff Channel for Steep Trends - Apply Chandelier Exit to IWM - Scan Code for RSI-StochRSI Strategy - EEM Breakout
by Arthur Hill,
Chief Technical Strategist, TrendInvestorPro.com
Nothing to Do but Trail a Stop // Reviving the Raff Regression Channel for QQQ // Chandelier Exit for IWM // Retail Continues to Impress // Applying the 5-day RSI-StochRSI Strategy to IEF and TLT // USO, BNO and XES Stutter after Bullish Signals // Scan Code for RSI-StochRSI Strategy // Emerging and Latin American Markets Turn...
READ MORE
MEMBERS ONLY

What's Up/Down With The Dollar?

by Martin Pring,
President, Pring Research
* The Dollar Index-too heavily weighted in favor of the Euro
* A closer look at the long-term cross Dollar relationships
* What are the Dollar sympathy indicators saying?
* Short-term technicals
The Dollar Index - Too heavily weighted in favor of the Euro
A few months ago I declared the Dollar Index to...
READ MORE
MEMBERS ONLY

HOMEBUILDERS LEAD ITB HIGHER -- LENNAR MAY BE NEXT HOMEBUILDER TO BREAK OUT -- THE XHB OFFERS BROADER EXPOSURE TO HOUSING-RELATED STOCKS -- OWENS CORNING IN STRONG UPTREND WHILE USG IS BREAKING OUT -- MOHAWK NEARS UPSIDE BREAKOUT AS WHIRLPOOL RALLIES
by John Murphy,
Chief Technical Analyst, StockCharts.com
US HOME CONSTRUCTION ISHARES TURN UP ... Several of my recent messages have written about the upturn in homebuilding shares. A lot of that has been due to the drop in bond yields and mortgage rates. Improvement in the housing area is also an encouraging sign for the economy. Chart 1...
READ MORE
MEMBERS ONLY
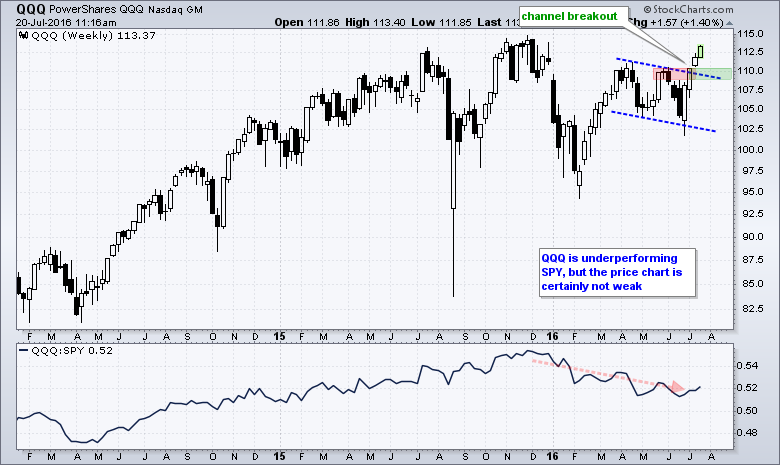
QQQ Sets Sights on All Time High with Channel Breakout
by Arthur Hill,
Chief Technical Strategist, TrendInvestorPro.com
The surge in stocks entered its fourth week with QQQ extending its channel breakout. The chart below shows the ETF surging earlier this year and then embarking on a correction with a falling channel into June. This correction clearly ended with the breakout near 110 and this zone now becomes...
READ MORE
MEMBERS ONLY
Dow Jones Sets Another Record High
by Tom Bowley,
Chief Market Strategist, EarningsBeats.com
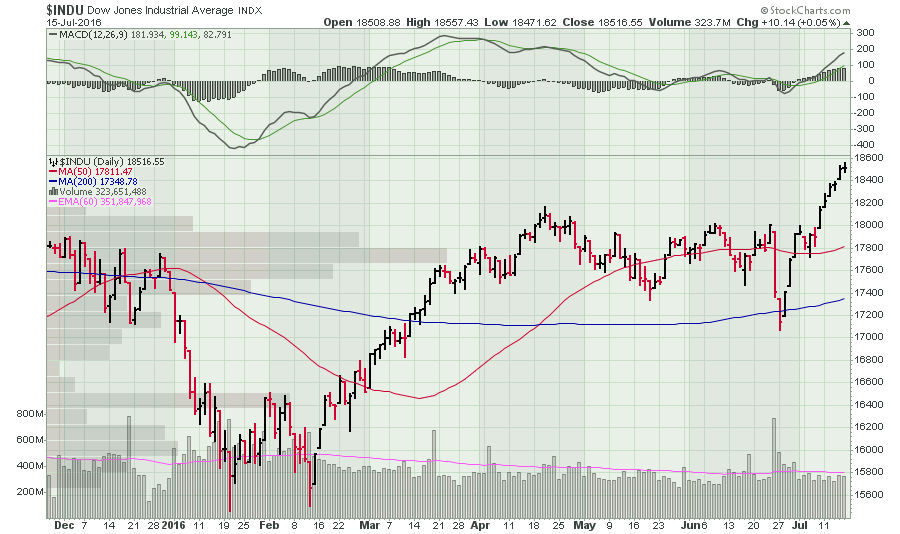
Market Recap for Tuesday, July 19, 2016
The Dow Jones managed to close at another all-time high on Tuesday despite seven of nine sectors falling. Most of the weakness, however, was confined to materials (XLB, -0.59%) and energy (XLE, -0.56%). None of the other sectors fell more than...
READ MORE
MEMBERS ONLY
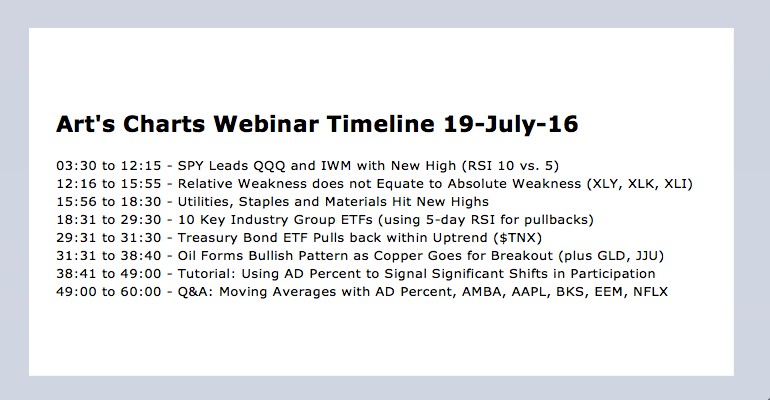
SPY Leads Big 3 - Sector SPDRs Reflect Broad Market Strength - Webinar Video
by Arthur Hill,
Chief Technical Strategist, TrendInvestorPro.com
Webinar Video
SPY Continues to Lead the Big Three // RSI Nears 70 for IWM // Sector SPDRs Reflect Broad Market Strength // Webinar Preview - Using Breadth Indicators // Submit a Webinar Question //// .....
SPY Continues to Lead the Big Three
Stocks are up sharply over the last three weeks with small-caps leading the...
READ MORE
MEMBERS ONLY
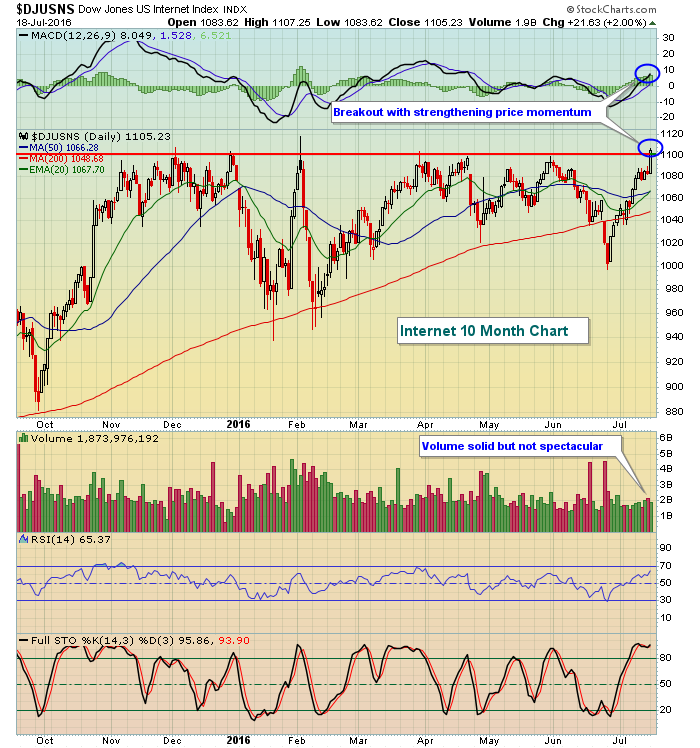
After 30 Failed Attempts, This Breakout Was Finally Made
by Tom Bowley,
Chief Market Strategist, EarningsBeats.com
Market Recap for Monday, July 18, 2016
The action on Monday was led by the NASDAQ's 0.52% gain with technology (XLK, +0.67%) pacing the advance. One bullish piece of technical news within the technology space was the breakout of internet stocks ($DJUSNS), which gained 2.0%...
READ MORE
MEMBERS ONLY
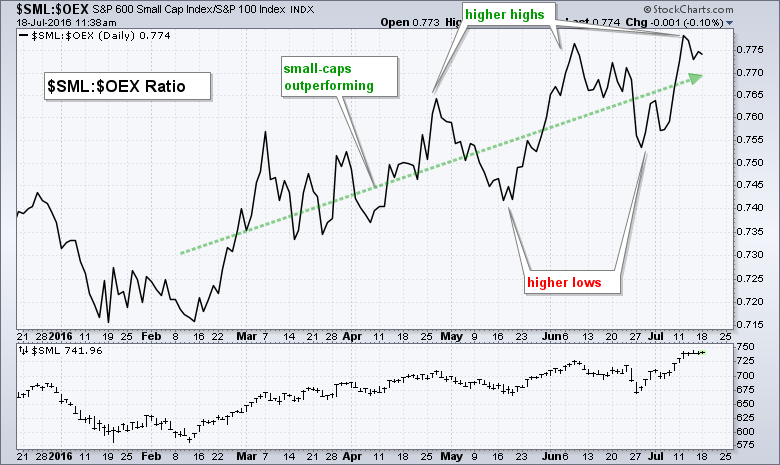
Small-caps Continue to Outperform Large-caps
by Arthur Hill,
Chief Technical Strategist, TrendInvestorPro.com
The S&P Small-Cap 600 has been leading the S&P 500 since mid February as a key ratio chart hit a multi-month high last week. The main window in the chart below shows the $SML:$OEX ratio, which plots the performance of the S&P Small-Cap...
READ MORE
MEMBERS ONLY
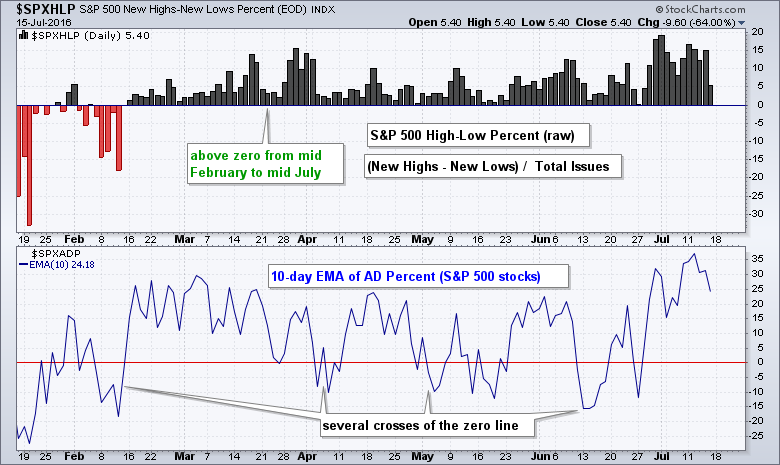
SystemTrader - Using High-Low Indicators to Determine the Broad Market Trend
by Arthur Hill,
Chief Technical Strategist, TrendInvestorPro.com
SystemTrader // Introduction - the Bias is Obvious // High-Low Percent Calculation // Massaging the Data with Different Indicators // Setting Bullish and Bearish Thresholds // Breaking Down the S&P 1500 for more Clues // Conclusions on this Trend Following Indicator // High-Low Percent Symbols at StockCharts //// . . . . .
Introduction - the Bias is Obvious
52-week highs...
READ MORE
MEMBERS ONLY
VIX Approaching Bull Market Lows
by Tom Bowley,
Chief Market Strategist, EarningsBeats.com
Market Recap for Friday, July 15, 2016
It was another day of bifurcation on Friday as the Dow Jones and Russell 2000 were able to eke out gains while both the S&P 500 and NASDAQ finished in negative territory. Similar bifurcation was found among sectors with materials (XLB,...
READ MORE
MEMBERS ONLY
Wilshire 5000 Composite Index Nears Old High, Transports Play Catchup
by John Murphy,
Chief Technical Analyst, StockCharts.com
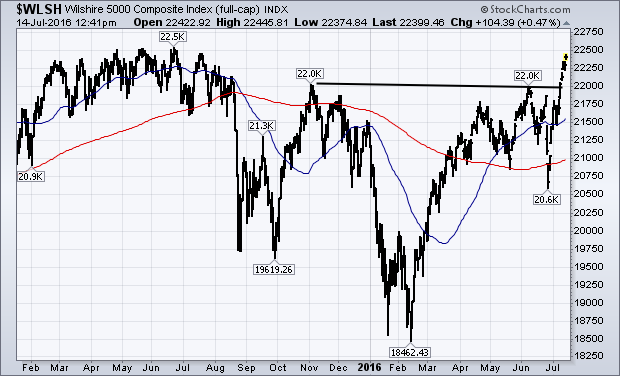
The Dow Industrials and S&P 500 continue to hit record highs. I've been showing upside breakouts in other parts of the market that include small caps and the NYSE Composite Index. Here's another one. Chart 3 shows the Wilshire 5000 Composite Index ($WLSH) having...
READ MORE
MEMBERS ONLY
Earnings Season Shifts into High Gear

by John Hopkins,
President and Co-founder, EarningsBeats.com
The "official" start to earnings season began when Alcoa reported its numbers after the bell last Monday. The market liked what it saw and heard with AA up close to 10% by the time the week ended. We also saw some major banks report their numbers with mixed...
READ MORE
MEMBERS ONLY
Are You A Chart Watcher?
Hello Fellow ChartWatchers!
Are you a watcher of charts? By that I mean how much do you trust what you see on price charts? Do you trust the charts more than the commentary/opinion of others? Do you trust stories in the financial press more than what you see on...
READ MORE
MEMBERS ONLY
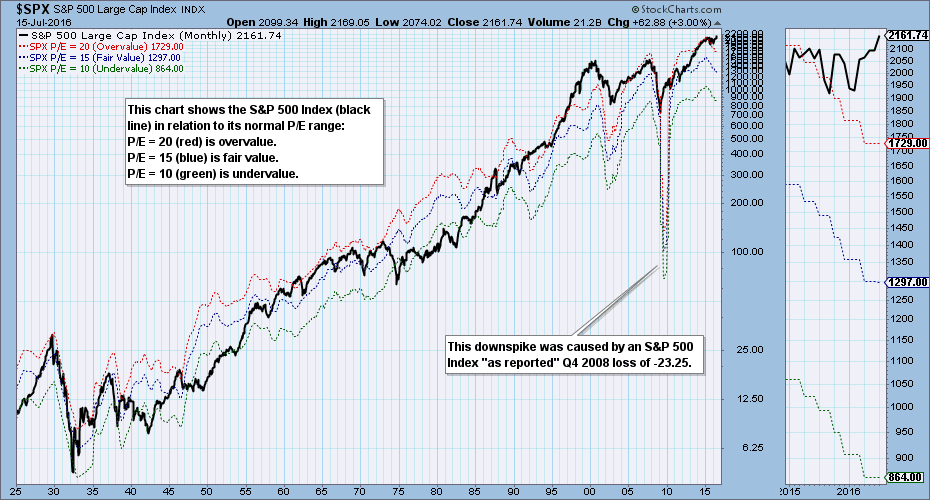
S&P 500 2016 Q1 Earnings Results: "Irrational Exuberance" Again?

by Carl Swenlin,
President and Founder, DecisionPoint.com
The S&P 500 Index 2016 first quarter earnings results are in, and it is time once again to take our quarterly look at our earnings chart, which shows the S&P 500 in relation to its normal value range. (Note: The chart is a static graphic, not...
READ MORE
MEMBERS ONLY

Getting on the Gas
by Bruce Fraser,
Industry-leading "Wyckoffian"
Since 2008 natural gas has been in a downtrend and has generally under-performed crude oil, common stocks and other commodities. Recent price strength for natural gas could be indicating change is in the air. Is this a sign of better days ahead or just a tease before prices sag and...
READ MORE
MEMBERS ONLY
Long-Term Cycle Chart Suggests Higher Prices
by Erin Swenlin,
Vice President, DecisionPoint.com
Let me first profess that I am not an avid follower of cycle charts. They generally take too much tinkering for my taste as they never quite fit over the long haul. However, as I was flipping through some of my longer-term charts, I ran into a chart I created...
READ MORE
MEMBERS ONLY

Equity Markets Start To Broaden Their Appeal
by Martin Pring,
President, Pring Research
* Whipsaw leads to sharp rally
* Global equity markets starting to heat up
* Broad sector participation
* What’s going on with the yield curve?
Whipsaw leads to sharp rally
Chart 1 compares the Dow ETF (DIA) with my Dow Diffusion Indicator, an oscillator that monitors a basket of Dow Stocks above...
READ MORE
MEMBERS ONLY

GLOBAL STOCKS RESUME UPTREND -- ALL WORLD STOCK INDEX EXTENDS BULLISH BREAKOUT -- ASIAN EX JAPAN ISHARES TURN UP -- WILSHIRE 5000 INDEX NEARS RECORD -- TRANSPORTS NEAR TEST OF APRIL HIGH -- RAILS COMPLETE BASING PATTERN
by John Murphy,
Chief Technical Analyst, StockCharts.com
MSCI ALL COUNTRY WORLD INDEX ISHARES BUILDS ON BULLISH BREAKOUT... Global stocks resumed their uptrend today in a replay of Tuesday's shift toward riskier assets. Chart 1 shows the MSCI All Country World Stock Index iShares (ACWI) building on its bullish breakout that took place on Tuesday when...
READ MORE
MEMBERS ONLY
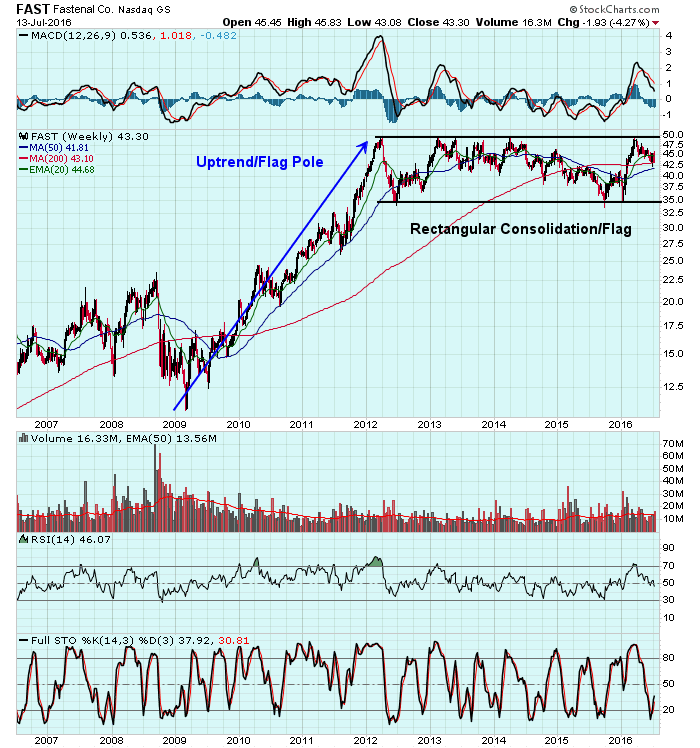
Prime Example Of An Untradable Stock
by Tom Bowley,
Chief Market Strategist, EarningsBeats.com
Prior to the opening bell on Tuesday, Fastenal (FAST) confessed to below consensus revenues and EPS, normally a big problem for a stock. Sure enough, FAST fell approximately 4% on the open Tuesday, providing short sellers a quick profit. The problem, however, is that FAST is trading within a multi-year...
READ MORE
MEMBERS ONLY
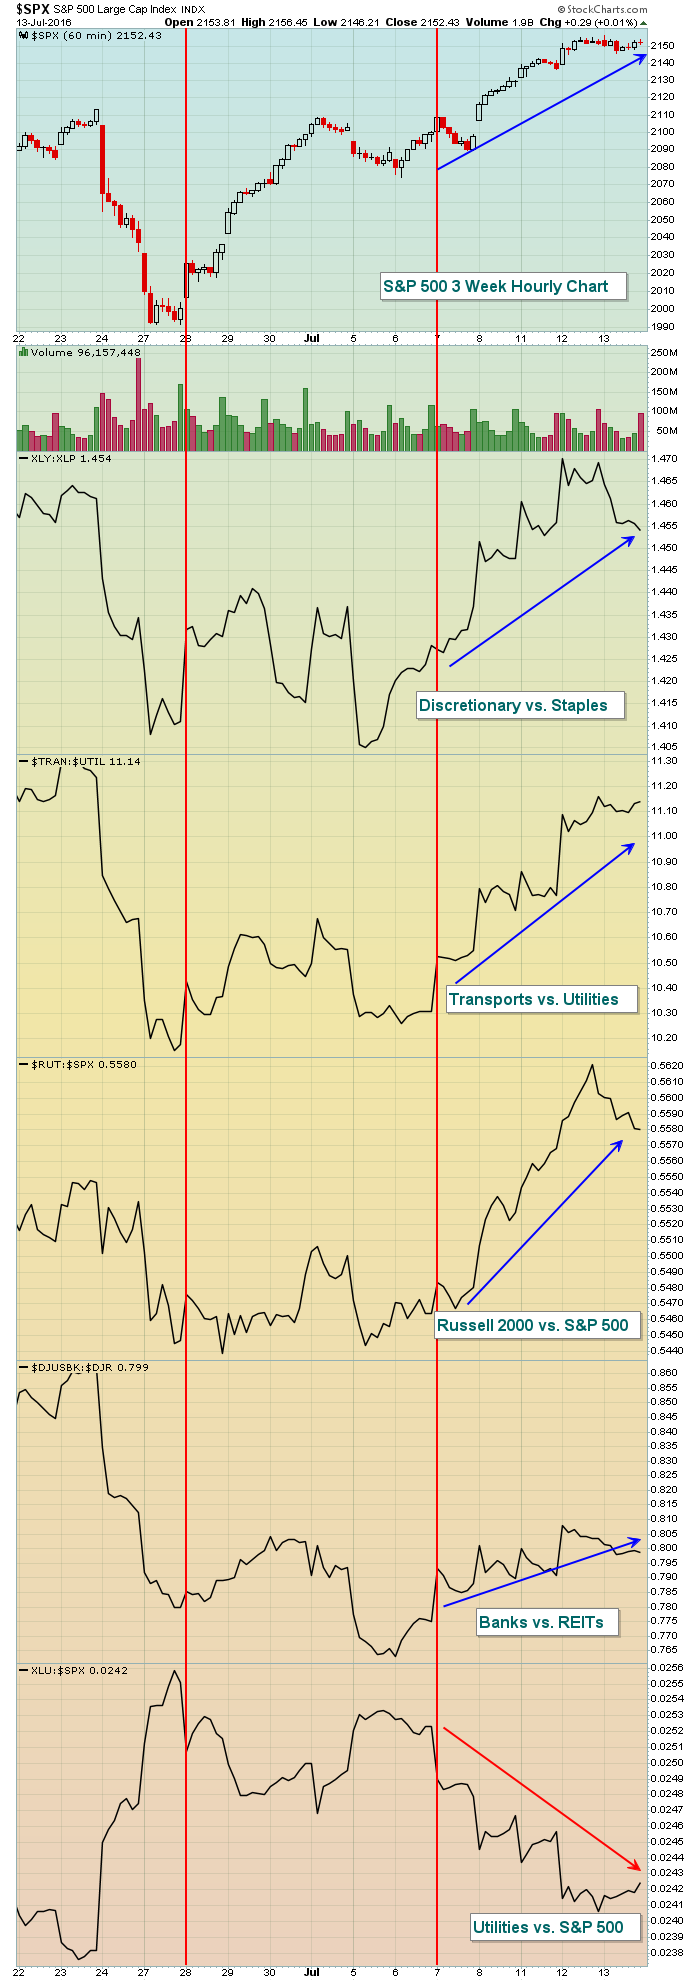
Seasonal Period Aiding Bulls Near-Term
by Tom Bowley,
Chief Market Strategist, EarningsBeats.com
Note:
I will be traveling this weekend and unable to post here in my Trading Places blog on Friday. I hope everyone has a great weekend! Back on Monday!
Market Recap for Wednesday, July 13, 2016
The bullish run that began on June 28th continues despite Wednesday's pause....
READ MORE
MEMBERS ONLY
S&P 500 Extends Gains; Energy Leads
by Tom Bowley,
Chief Market Strategist, EarningsBeats.com
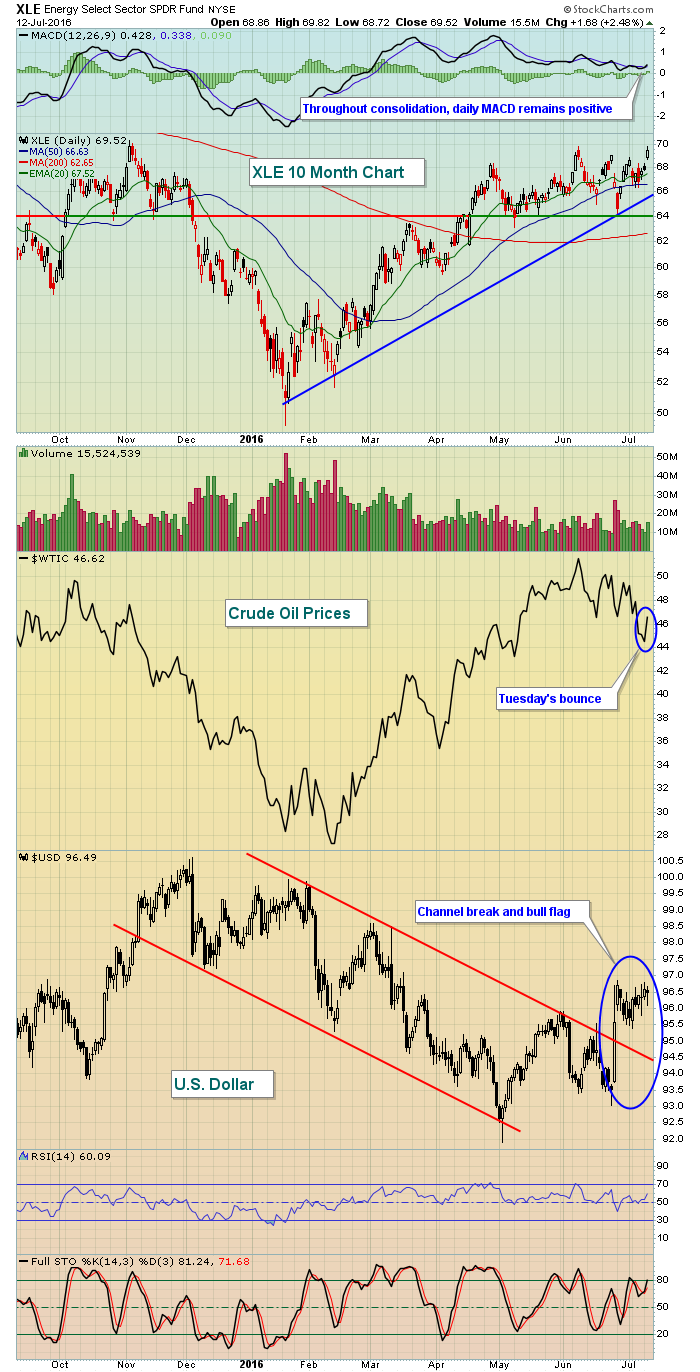
Market Recap for Tuesday, July 12, 2016
Energy (XLE, +2.48%) resumed its leadership role in a big way on Tuesday as rising crude oil prices ($WTIC) and a bullish pattern on the U.S. dollar provided energy bulls all they needed to send the XLE to its highest close...
READ MORE
MEMBERS ONLY
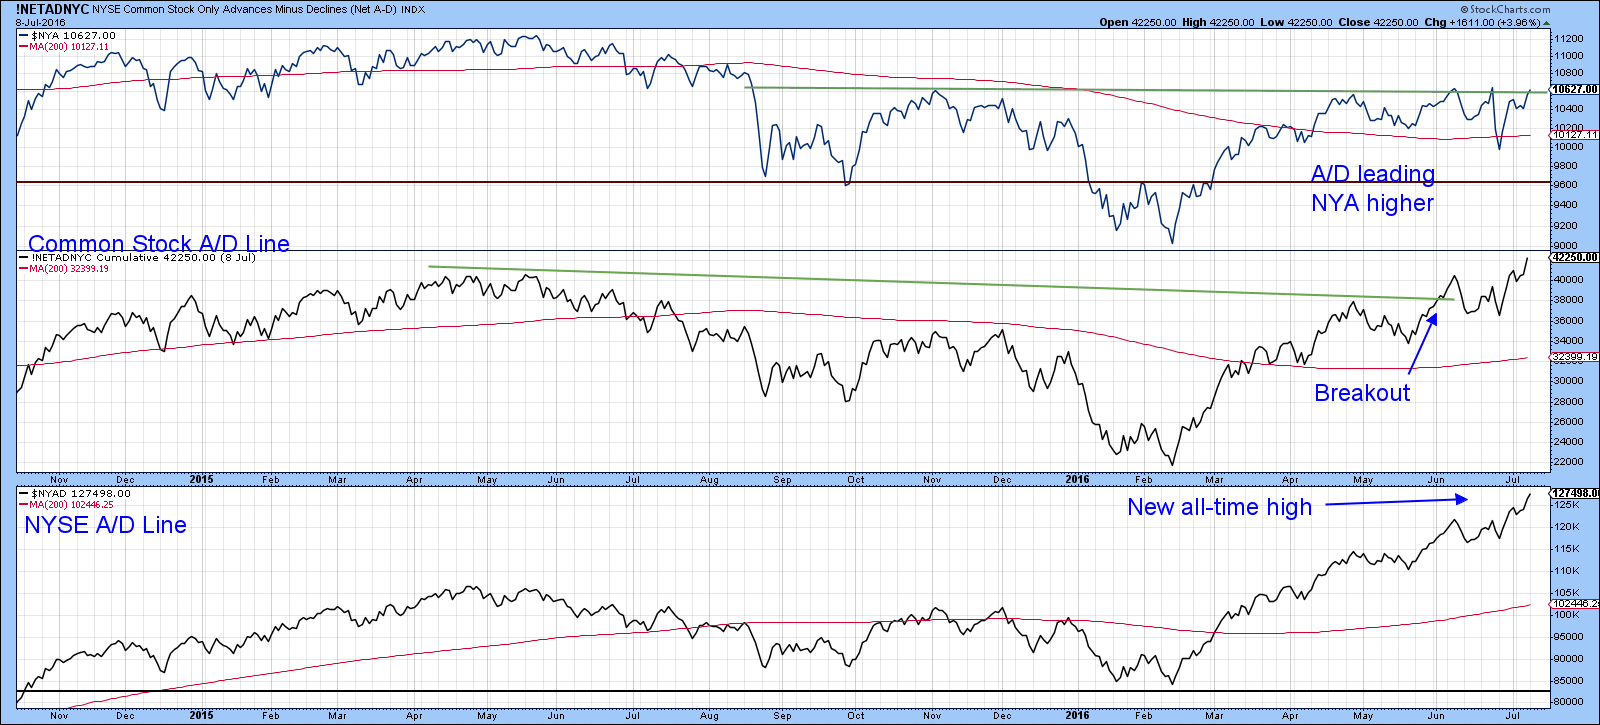
SystemTrader - Using Advance-Decline Percent to Measure Significant Shifts in Broad Market Breadth
by Arthur Hill,
Chief Technical Strategist, TrendInvestorPro.com
SystemTrader // Introduction // Picking the Market Benchmark // Advance-Decline Percent // Massaging the AD Data // Measuring Significant Shifts // Dividing, Conquering and Affirming // Conclusions AD Percent Indicators at StockCharts //// . . . . .
Introduction
This is the first in a multi-part series on the key breadth indicators I use to determine the broad market environment. Most readers are...
READ MORE
MEMBERS ONLY

REBOUND IN GLOBAL BOND YIELDS AND BRITISH POUND ACCELERATE RISK ON TRADE AS GOLD AND YEN SELL OFF -- EMERGING MARKETS ACHIEVE BULLISH BREAKOUT -- SO DO ALL COUNTRY WORLD INDEX ISHARES
by John Murphy,
Chief Technical Analyst, StockCharts.com
TREASURY YIELDS REBOUND ALONG WITH STERLING... A surge in global bond yields is contributing to a rotation out of safe havens and into riskier assets. Chart 1 shows the 10-Year Treasury Yield gapping 9 basis points higher to 1.52%. That puts the TNX back above its July 2012 closing...
READ MORE
MEMBERS ONLY
Top Three Reasons Why This Rally Won't Last
by Tom Bowley,
Chief Market Strategist, EarningsBeats.com
Market Recap for Monday, July 11, 2016
Despite all the reasons for being cautious at this stage of the current seven year bull market rally, nothing is more important than simple price action and yesterday the S&P 500 did what it had never done before - it closed...
READ MORE
MEMBERS ONLY
S&P 500 Breadth Confirms - Small-Cap New Highs Surge - Webinar Recording
by Arthur Hill,
Chief Technical Strategist, TrendInvestorPro.com
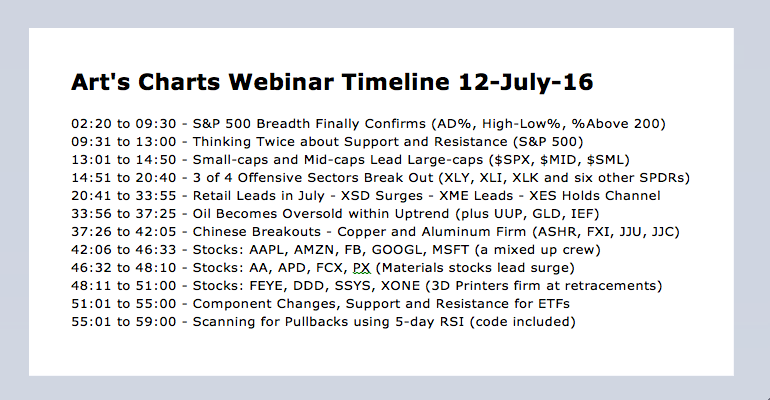
Webinar Video for Tuesday, July 12th
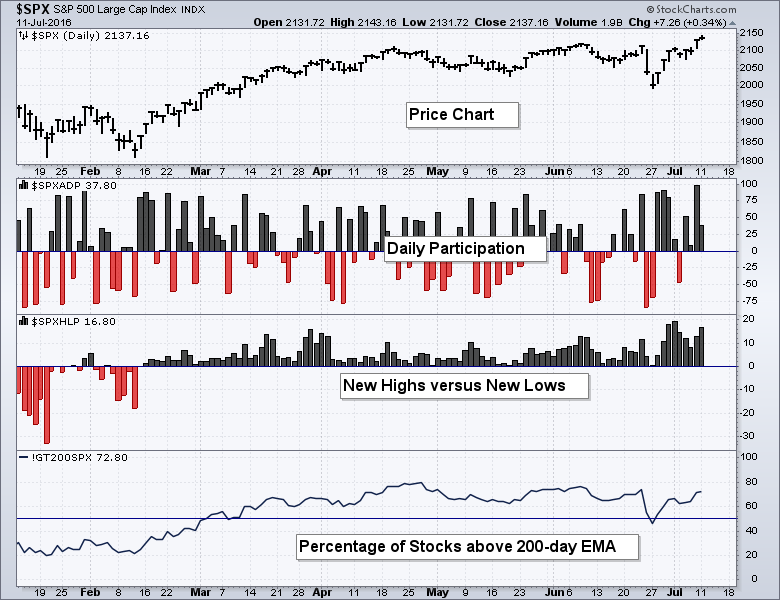
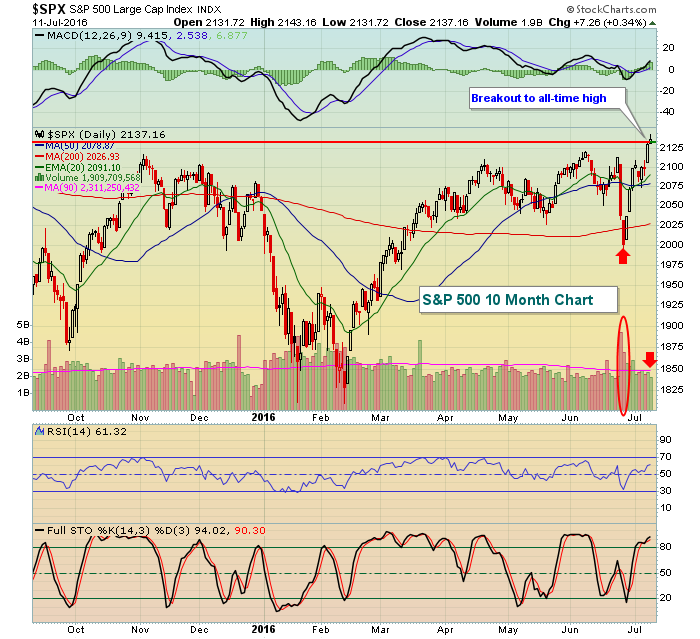
S&P 500 Reaches Uncharted Territory // Support and Resistance for Indexes and ETFs // Small-caps and Mid-caps Outperforming // S&P 500 Breadth Finally Confirms // Small-cap New Highs Surge // Percent above 200-day Stays Bullish // Webinar Preview //// .....
S&P 500 Reaches Uncharted Territory
The...
READ MORE
MEMBERS ONLY
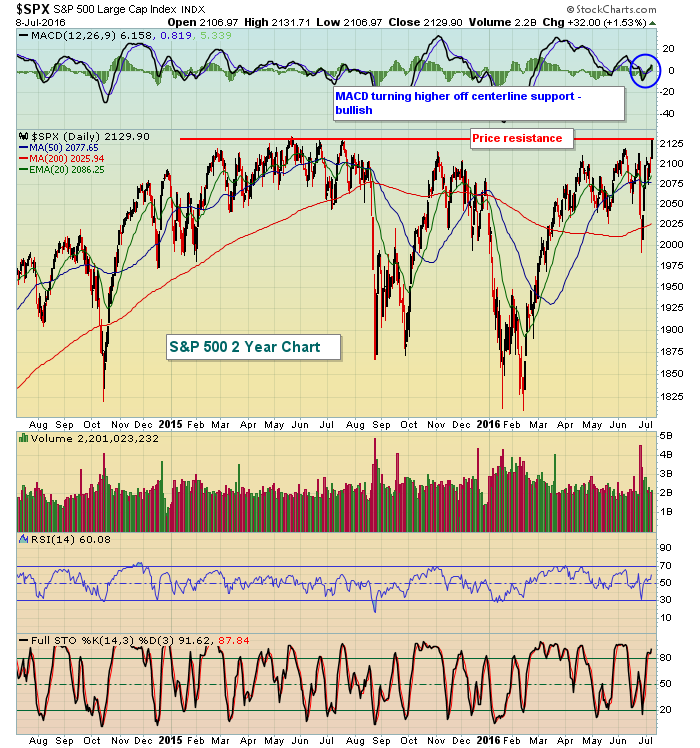
Breakout Or Fakeout
by Martin Pring,
President, Pring Research
* Take a deep 'breadth'
* Broadening formations
* Long-term indicators support an upside breakout
The recent breakout by the S&P and Dow to new high ground has caught the attention of market observers. Some say that the market is overvalued and that prices are unlikely to move higher....
READ MORE
MEMBERS ONLY
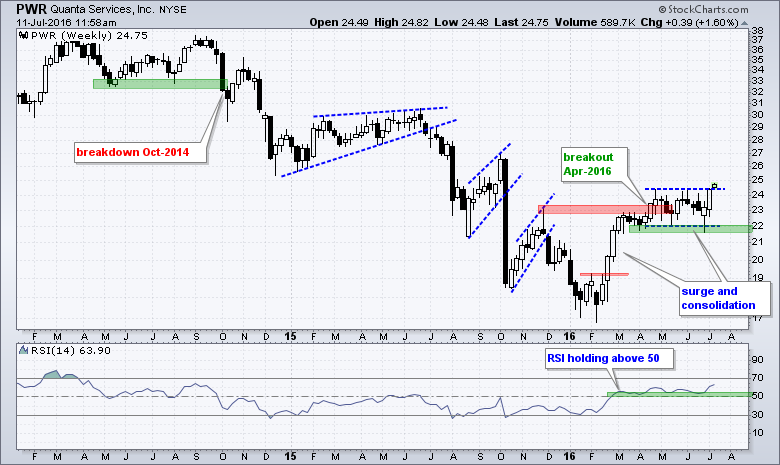
Quanta Services Breaks out of Consolidation
by Arthur Hill,
Chief Technical Strategist, TrendInvestorPro.com
Quanta Services (PWR) is showing signs of a long-term trend reversal with its third resistance break this year. The weekly chart shows PWR breaking down in October 2014 and trending lower until early 2016. This downtrend showed its first sign of reversing with the February surge and breakout near 19....
READ MORE
MEMBERS ONLY
Up Next: Second Quarter Earnings Season
by Tom Bowley,
Chief Market Strategist, EarningsBeats.com
Special Notes
Beginning today, I will be providing a "Monday setups" section every Monday, offering up potential trading candidates and technical reasons for possible entry. Please do your own due diligence - both technically and fundamentally - before you decide to trade any of these candidates. They will...
READ MORE
MEMBERS ONLY
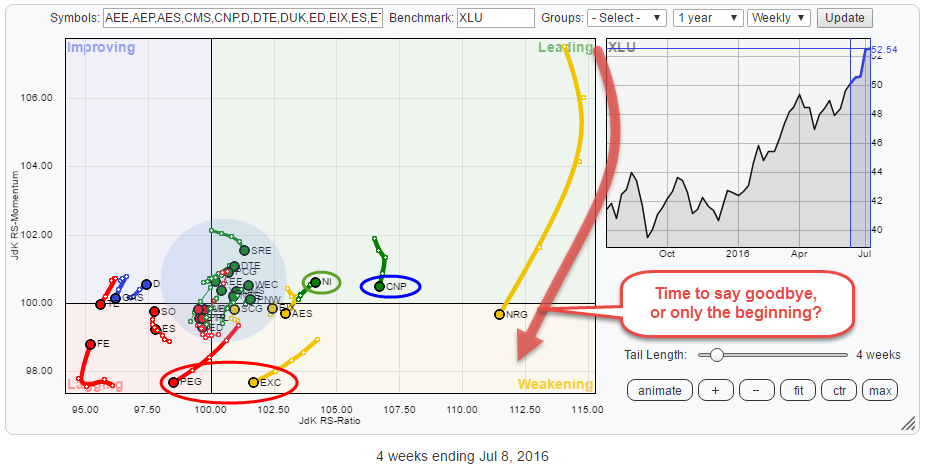
Utility stocks are boring .... really?

by Julius de Kempenaer,
Senior Technical Analyst, StockCharts.com
On the Relative Rotation Graph of the S&P economic sectors (GICS I), Utilities is one of the leading sectors as measured by the JdK RS-Ratio.
As described in my last RRG blog on US sectors, the fact that Utility stocks and Staples are leading the current sector rotation,...
READ MORE
MEMBERS ONLY
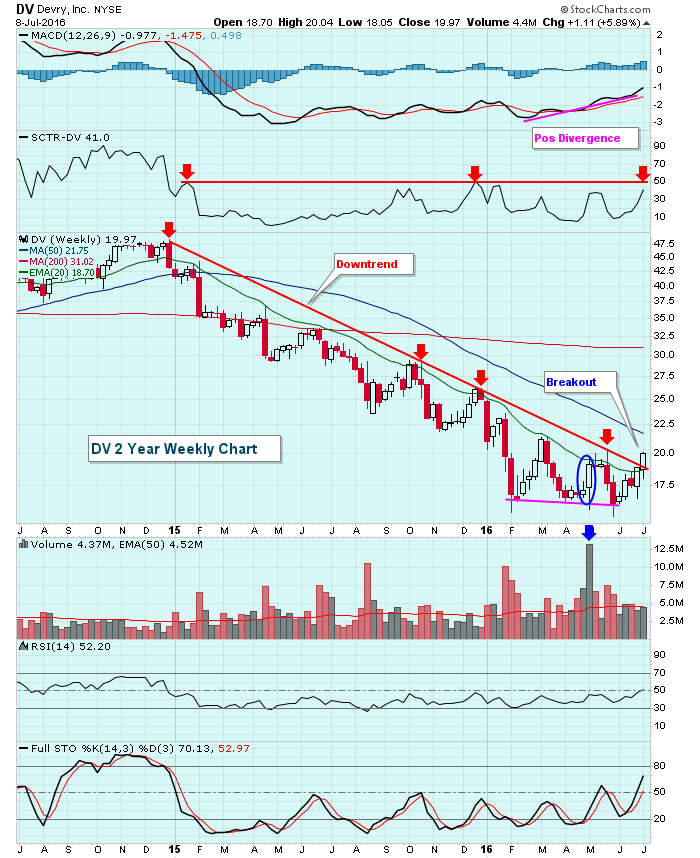
Devry Breaks 18 Month Downtrend
by Tom Bowley,
Chief Market Strategist, EarningsBeats.com
Devry, Inc. (DV) topped at close to 50.00 during the fourth quarter of 2014 and it has spent the last 18 months declining steadily until reaching what now appears to be a bottom just above 15.00. A positive divergence has emerged on its weekly MACD and volume trends...
READ MORE
MEMBERS ONLY
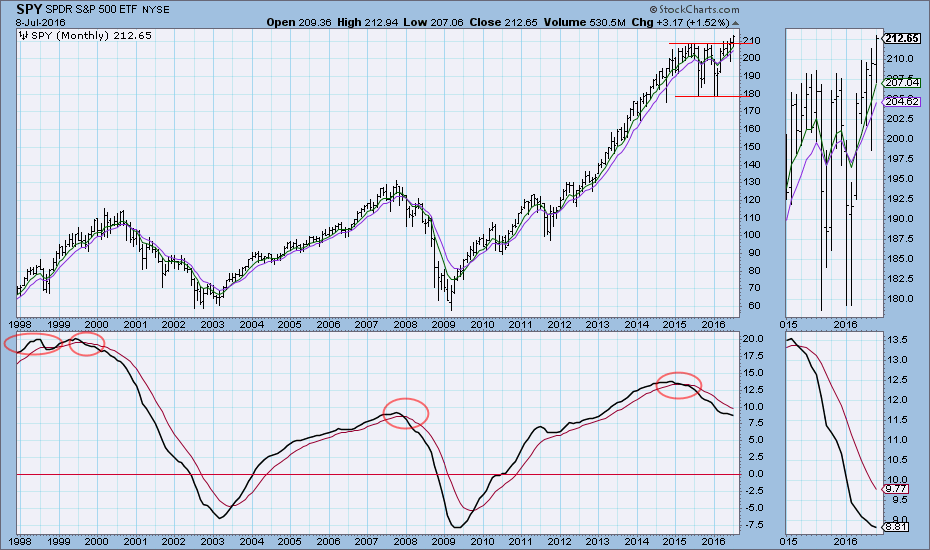
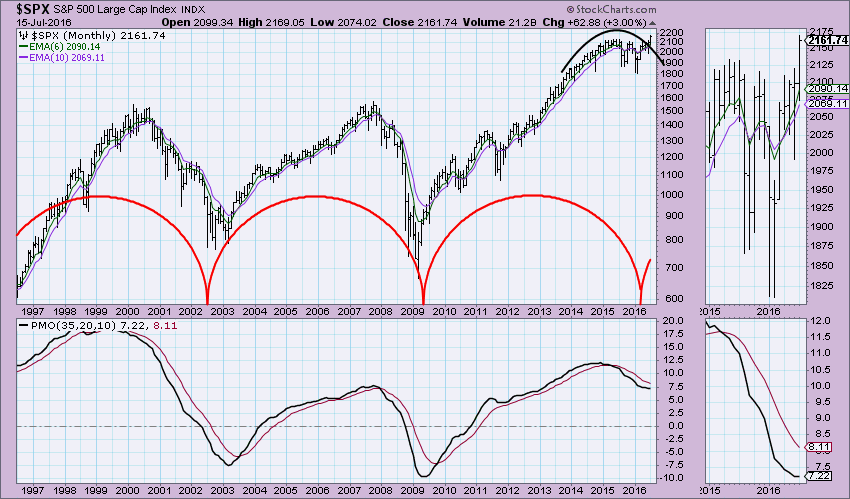
Wait! Was That a Bear Market?
by Carl Swenlin,
President and Founder, DecisionPoint.com
Since the monthly PMO topped in December 2014, then crossed down through its signal line in early 2015, I have been looking for a bear market to begin. There were two promising price tops in 2015, but the subsequent declines petered out at about -14% and established the lower limit...
READ MORE
