MEMBERS ONLY
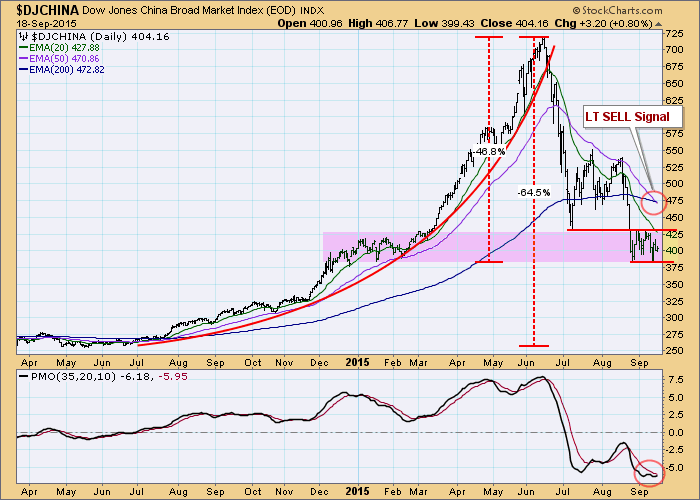
China Long-Term SELL Signal--Kinda Late

by Carl Swenlin,
President and Founder, DecisionPoint.com
This week the DecisionPoint Long-Term Trend Model generated a long-term SELL signal for $DJCHINA, but it was a tad late, considering how far that index has fallen. This chart provides us with a good example of when mechanical signals need to be ignored.
In this particular case, $DJCHINA experienced a...
READ MORE
MEMBERS ONLY

Just Another Phase

by Bruce Fraser,
Industry-leading "Wyckoffian"
Let’s continue our discussion of Phases from the prior blog post by getting right into chart analysis. Please review ‘Context is King’ (click here for link) for more on Phases.
A classic BCLX is followed by an AR which sets up the Distribution trading range for AKAM. Note how...
READ MORE
MEMBERS ONLY

Why the NFL, MLB and NHL Should Hire Me (Or Another CMT - Technical Analyst)

by Gatis Roze,
Author, "Tensile Trading"
I liken old school General Managers of professional sports teams to fundamental investors. The GMs that have not yet embraced the trend of data mining and statistical analysis – under the umbrella that’s now being labeled as “Sports Analytics” – are being left behind, sliding down the leader board or being...
READ MORE
MEMBERS ONLY

SHORT-TERM STOCK BOUNCE HAS PROBABLY ENDED -- A RETEST OF SUMMER LOW NOW APPEARS LIKELY -- VIX BOUNCES OFF 20 SUPPORT LEVEL

by John Murphy,
Chief Technical Analyst, StockCharts.com
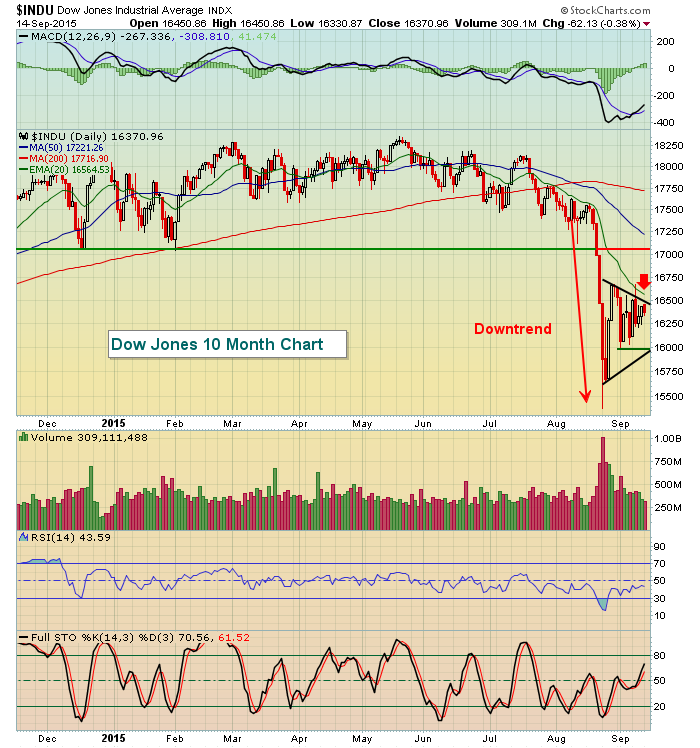
RETEST OF AUGUST LOWS LIKELY... The short-term bounce that started nearly a month ago appears to have run its course. That suggests that a retest of the August low is more likely. I recently applied Fibonacci retracement lines over the Dow Industrials to show where new selling might appear. Chart...
READ MORE
MEMBERS ONLY
Market Loses Confidence in the Fed

by Martin Pring,
President, Pring Research
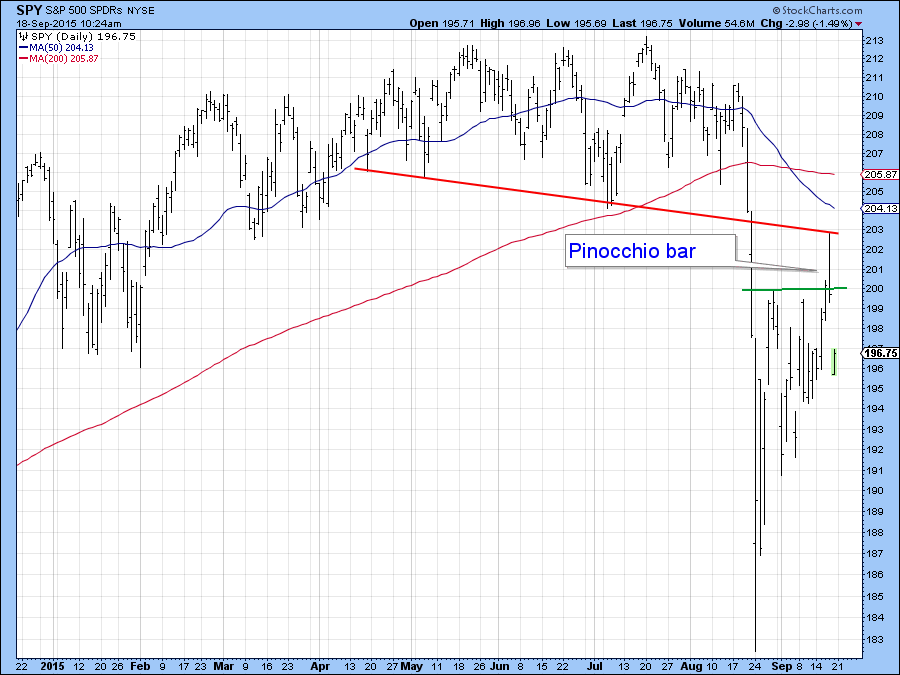
* Thursday’s action represents a bearish Pinocchio bar.
* Long-term indicators remain bearish.
* Will Friday’s trading have a silver lining?
Thursday’s Pinocchio bar
In last week’s article I pointed out that several market averages had experienced bearish engulfing patterns and that a test of the lows was likely....
READ MORE
MEMBERS ONLY
Weighing of the Evidence -- Triangle Evolves into Wedge -- ST Breadth Overbought -- Gold, Silver, Euro and Yen

by Arthur Hill,
Chief Technical Strategist, TrendInvestorPro.com
Medium-term Evidence Remains Bearish
Video will be posted around 11AM ET. The bulk of the medium-term evidence remains bearish for the stock market as a whole. I noted that a bullish breadth thrust occurred on Thursday. This thrust, however, was not confirmed by other breadth indicators - namely High-Low Percent....
READ MORE
MEMBERS ONLY
Fed Decision "No Change".....Now Quad Witching Day

by Tom Bowley,
Chief Market Strategist, EarningsBeats.com
Market Recap for Thursday, September 17, 2015
Much ado about nothing. That's my summation of the Fed policy statement. Fed Chair Yellen decided to do nothing as apparently Fed policy is now contingent upon....just about everything. Isn't the Federal Reserve THE central bank? In stock...
READ MORE
MEMBERS ONLY
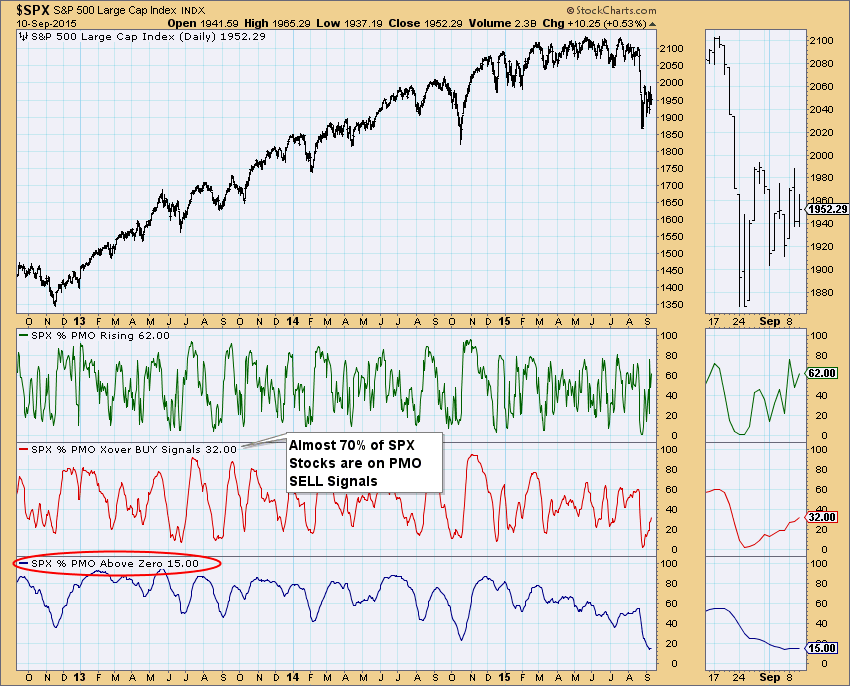
Short-Term Indicators Worrisome

by Erin Swenlin,
Vice President, DecisionPoint.com
The SPY in the last three days has been trending higher, so expectation would be that short-term indicators would reflect that strength. They are currently deteriorating or pointing to internal weakness. In today's DecisionPoint Alert blog, I reviewed the short-term charts below (as well as intermediate-term charts not...
READ MORE
MEMBERS ONLY
Fed Holds Steady; Treasury Bulls Send Stocks Bad Signal
by Tom Bowley,
Chief Market Strategist, EarningsBeats.com
Well, the Fed meeting and announcement has come and gone. All the drama is over. At the end of the day, Fed Chair Janet Yellen decided to leave interest rates unchanged for now, citing weakness abroad as one of the reasons for such delay. It's not often that...
READ MORE
MEMBERS ONLY

FED LEAVES RATE UNCHANGED -- BONDS RALLY ON FALLING YIELDS -- DOLLAR WEAKNESS BOOSTS GOLD -- STOCKS SUFFER DOWNSIDE REVERSAL
by John Murphy,
Chief Technical Analyst, StockCharts.com
INITIAL REACTIONS... The Fed left short-term rates unchanged today. The two main reasons given were lower inflation and weakness in foreign markets. Ms. Yellen, however, stressed in her press conference that the U.S. economy still looked solid and that a rate hike by yearend was still possible. Not surprisingly,...
READ MORE
MEMBERS ONLY

Risk is More than a Four Letter Word

by Greg Morris,
Veteran Technical Analyst, Investor, and Author
Dictionary.com says: The exposure to the chance of injury or loss; a hazard or dangerous chance. American Heritage Dictionary says: The possibility of suffering harm or loss; danger. These are just two of the many entries and these were just for the noun. Risk in the world of investments...
READ MORE
MEMBERS ONLY
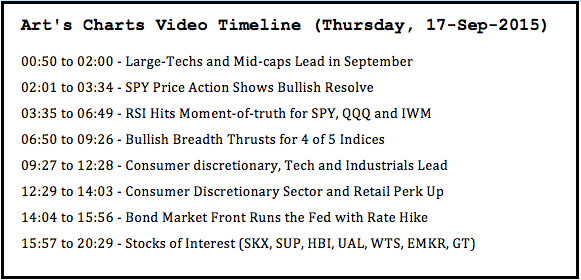
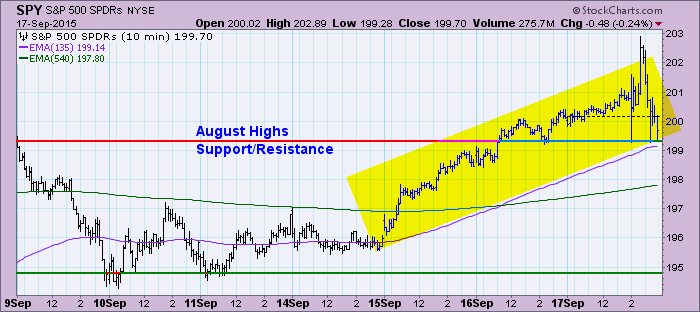
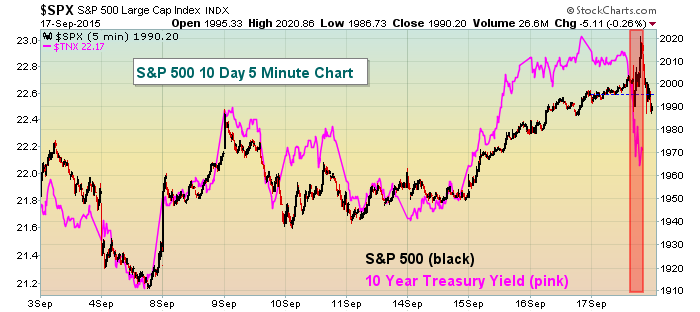
RSI Hits Moment of Truth, Retail Perks Up and Bond Market Front Runs the Fed
by Arthur Hill,
Chief Technical Strategist, TrendInvestorPro.com
Large-Techs and Mid-caps Lead in September
The September bounce is shaping up rather nicely with the Nasdaq 100 and the S&P MidCap 400 leading the major indices. The PerfChart below shows the month-to-date performance for eight stock indices. The Nasdaq 100 is the clear leader with a 2....
READ MORE
MEMBERS ONLY
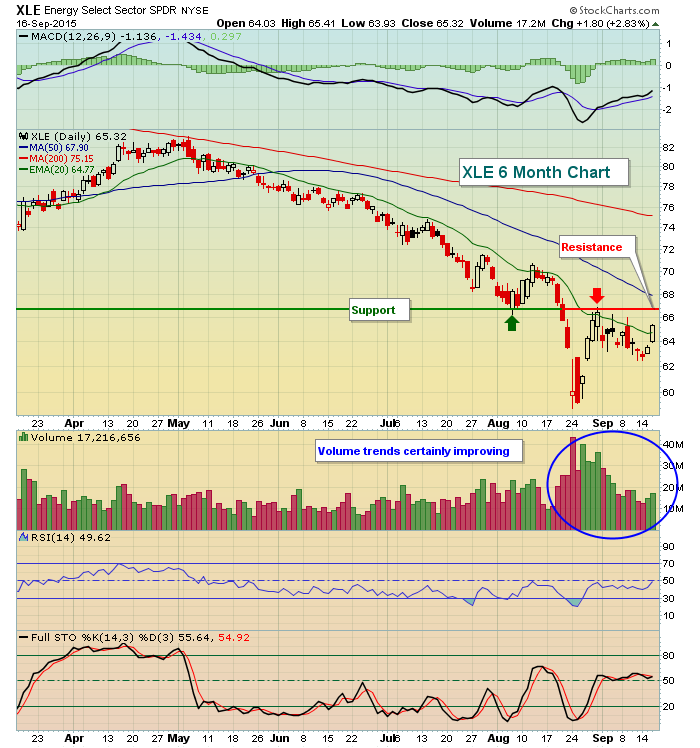
It's Federal Reserve Day - What To Look For
by Tom Bowley,
Chief Market Strategist, EarningsBeats.com
Market Recap for Wednesday, September 16, 2015
The bulls continued to piece back together technical conditions on Wednesday ahead of the Fed announcement later today. All sectors finished higher, although it was the outsized gain in energy (XLE) that clearly "fueled" the rally. Coal ($DJUSCL) gained 6% and...
READ MORE
MEMBERS ONLY

CHINA BOUNCE BOOSTS ASIAN ETFS -- ENERGY STOCKS SHOW NEW LEADERSHIP AS CRUDE OIL CLEARS 50-DAY AVERAGE -- OIL STABILITY ALSO BOOSTS EMERGING MARKETS IN MEXICO AND RUSSIA -- TESLA AND FORD LEAD AUTOS -- VIX NEARS TEST OF 20 SUPPORT
by John Murphy,
Chief Technical Analyst, StockCharts.com
CHINESE STOCKS REBOUND ... Emerging markets are getting some relief from a rebound in China. Hong Kong stocks are up 511 points (2.3%) while Shanghai gained 147 points (4.9%). Chinese ETFs are also bouncing off important support levels while in a deeply oversold condition. Chart 1 shows HongKong iShares...
READ MORE
MEMBERS ONLY
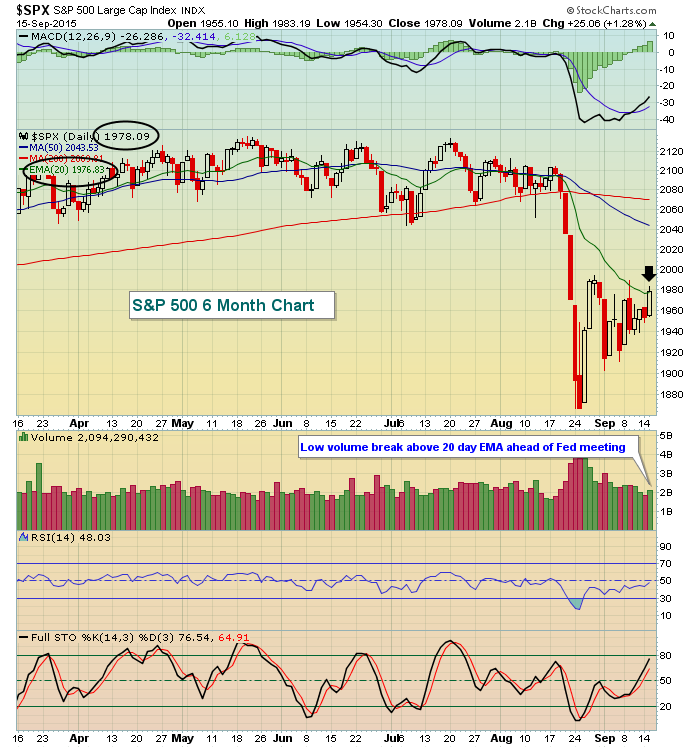
Gravitating Towards Major Resistance Pre-Fed?
by Tom Bowley,
Chief Market Strategist, EarningsBeats.com
Market Recap for Tuesday, September 15, 2015
Fairly light volume continued on Tuesday, but the bulls were in charge throughout the day with the Dow Jones, S&P 500 and Russell 2000 all joining the NASDAQ back above falling 20 day EMAs. At least that part of the damaged...
READ MORE
MEMBERS ONLY
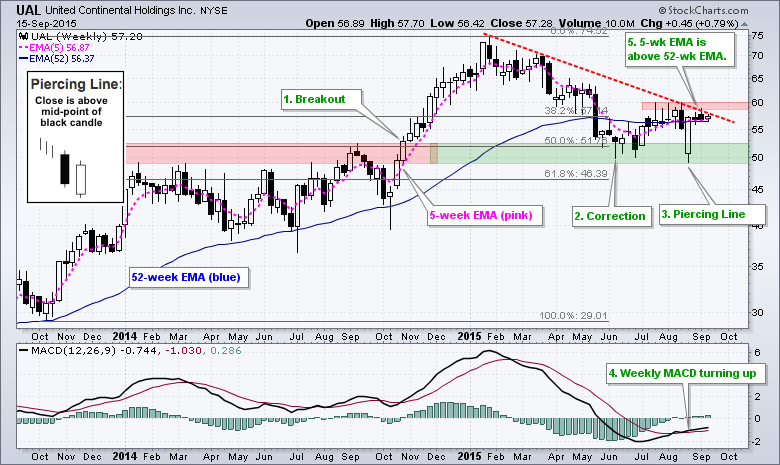
Is UAL Ready to Fly?
by Arthur Hill,
Chief Technical Strategist, TrendInvestorPro.com
The weekly chart for United Airlines (UAL) is looking bullish as the stock firms in a key retracement zone and weekly MACD turns up. The green text on the chart marks five technical features over the last 15 months. First, the stock broke out to new highs in October 2014....
READ MORE
MEMBERS ONLY

Beware of Bull Traps
by Erin Swenlin,
Vice President, DecisionPoint.com
According to the glossary in ChartSchool, the definition of a Bull Trap: A situation that occurs when prices break above a significant level and generate a buy signal, but suddenly reverse course and negate the buy signal, thus “trapping” the bulls that acted on the signal with losses. I'...
READ MORE
MEMBERS ONLY

BOND YIELDS RISE AS MONEY LEAVES BONDS FOR STOCKS -- BANK SPDR IS BACK ABOVE ITS 200-DAY LINE -- ETRADE IS A FINANCIAL LEADER -- UPS HELPS PULL TRANSPORTS ABOVE 50-DAY AVERAGE -- S&P 500 CLEARS 20-DAY LINE AS MARKET BOUNCES
by John Murphy,
Chief Technical Analyst, StockCharts.com
BOND YIELDS SURGE ON CONSUMER SPENDING... Today's jump in bond yields is being attributed to gains in consumer spending. Chart 1 shows the 10-Year Treasury Note Yield ($TNX) climbing above its 50-day average to the highest level in a month. When yields rise, bond prices fall. Chart 2...
READ MORE
MEMBERS ONLY
Six Reasons Why the Fed Will Not Raise Rates; One Bad Reason Why it Will
by Martin Pring,
President, Pring Research
* Consumer sentiment flags a sell signal
* Short rates rise before commodity prices do. That's not supposed to happen.
* TIPS break key support
The biggest question in financial markets this week is "will she or won't she?". The ”she” in this case is Janet Yellen...
READ MORE
MEMBERS ONLY
Gaps and Wedges Do Battle with August Support Breaks
by Arthur Hill,
Chief Technical Strategist, TrendInvestorPro.com
The major index ETFs remain in medium-term downtrends and short-term uptrends. Well, the short-term uptrend in SPY is up for debate because a triangle is taking shape. Nevertheless, SPY, QQQ and IWM gapped up last Tuesday and these gaps held for five days. We saw an intraday reversal on Wednesday...
READ MORE
MEMBERS ONLY
Quiet Monday Session As Traders Await Fed
by Tom Bowley,
Chief Market Strategist, EarningsBeats.com
Market Recap for Monday, September 14, 2015
It's hard to take too much away from Monday's action. Volume was extremely light with the NASDAQ volume at 1.45 billion shares. It was one of the lightest volume days of the year and the lightest since June...
READ MORE
MEMBERS ONLY
Hasbro: The Force is Strong on This One
by Arthur Hill,
Chief Technical Strategist, TrendInvestorPro.com
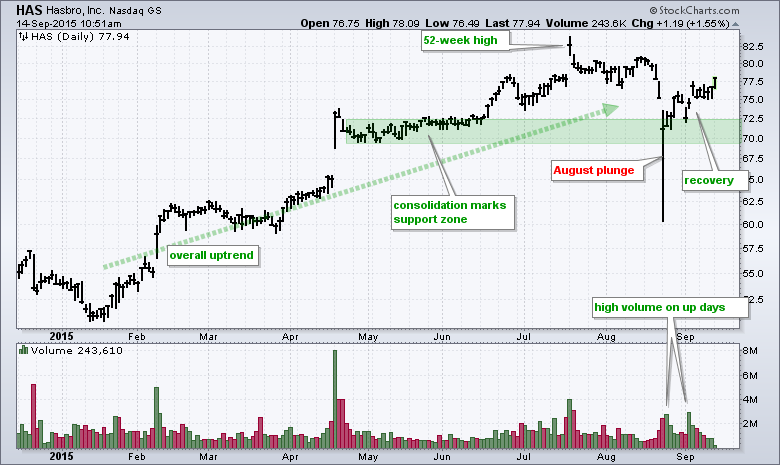
Star Wars fans may remember that quote from Darth Vader in Star Wars Episode IV (A New Hope). In any case, it came to mind when looking at the chart for Hasbro, which holds the merchandising rights for Star Wars toys. I see three reasons to be bullish on the...
READ MORE
MEMBERS ONLY
What Will The Fed Do?
by Tom Bowley,
Chief Market Strategist, EarningsBeats.com
Market Recap for Friday, September 11, 2015
Utilities and consumer stocks led the market rally on Friday. All sectors finished fractionally higher, except energy and materials. Their weak performance has been the number one factor for the weakness we've seen in our major indices in 2015. Year-to-date, energy...
READ MORE
MEMBERS ONLY
Steady Staples in the leading quadrant

by Julius de Kempenaer,
Senior Technical Analyst, StockCharts.com
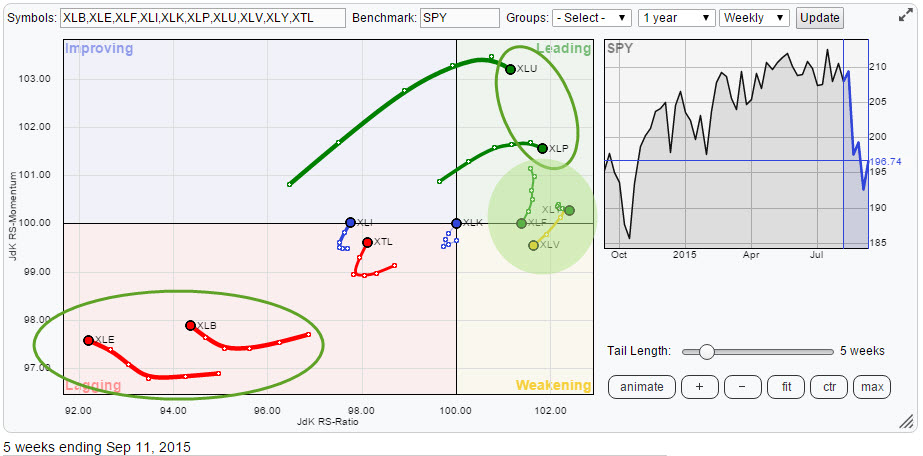
Despite wide swings in the US equity market the Relative Rotation Graph of sector ETFs will help you keep an eye on current sector rotation and point to favourable and less favourable sectors for the coming period.
Initial observations
A quick scan of the above Relative Rotation Graph immediately reveals...
READ MORE
MEMBERS ONLY
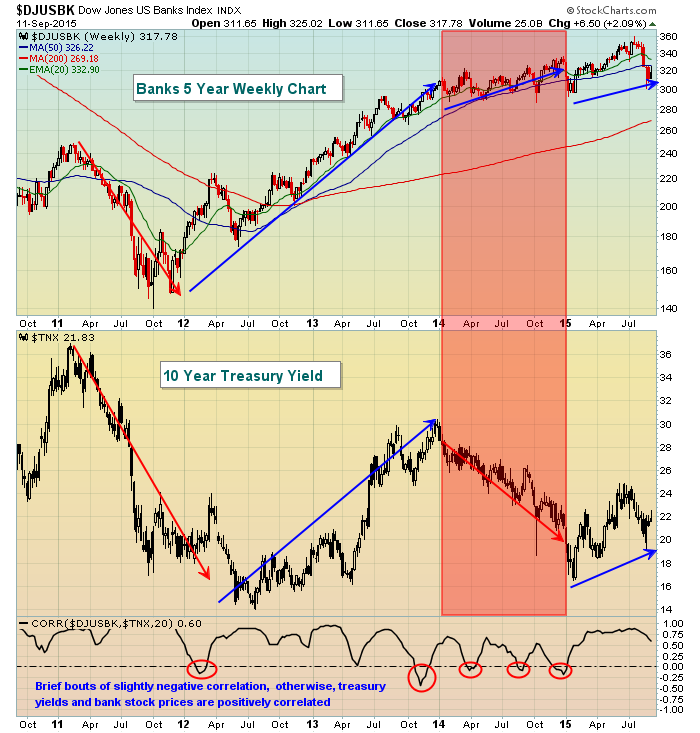
Correlation: Banks And Treasury Yields
by Tom Bowley,
Chief Market Strategist, EarningsBeats.com
As we await the Fed's interest rate decision this week, it's a good time to review a key area of the market that is heavily swayed by the direction of interest rates - banks ($DJUSBK). As the 10 year treasury yield ($TNX) rises and the yield...
READ MORE
MEMBERS ONLY
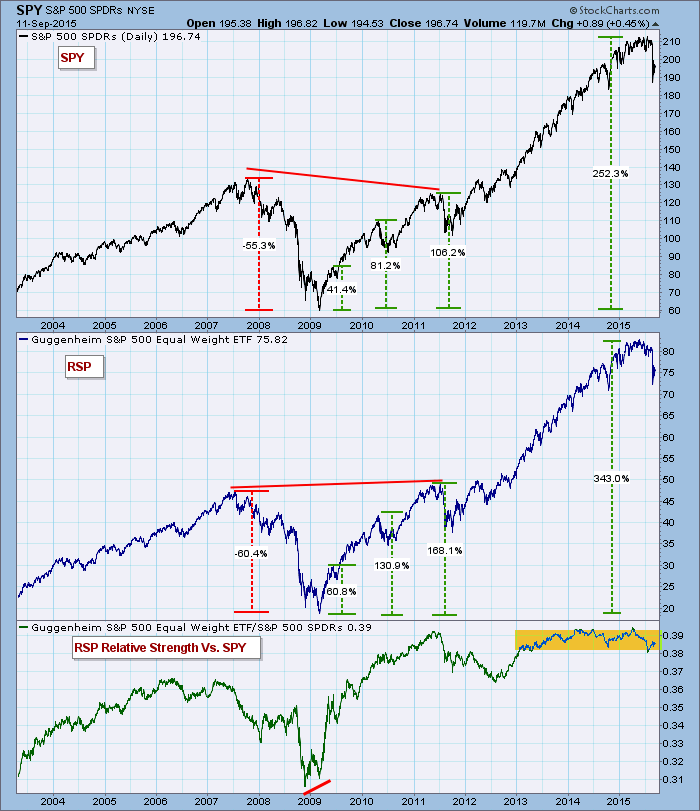
Relative Strength Anomaly
by Carl Swenlin,
President and Founder, DecisionPoint.com
Last week I highlighted CVI and Participation Index readings I had never seen before. This week I want to point out some useful relative strength behavior I just noticed for the first time. My focus is on the S&P 500 SPDR (SPY) and the S&P 500...
READ MORE
MEMBERS ONLY

HOUSING GROUP CONTINUES TO LEAD -- HOMEBUILDING LEADERS INCLUDE DR HORTON, NVR, AND LENNAR -- HOUSING RELATED STOCK LEADERS INCLUDE MOHAWK, MASCO, AND HOME DEPOT -- COMPARISON OF TWO HOUSING ETFS -- MARKET AWAITS FED DECISION
by John Murphy,
Chief Technical Analyst, StockCharts.com
HOMEBUILDERS CONTINUE TO GAIN ... This is the latest of several positive messages written herein on homebuilders and housing stocks in general. Homebuilders were one of the strongest stock groups on Friday. More importantly, they're also the strongest group over the last month and the last three month periods....
READ MORE
MEMBERS ONLY

Asset Allocation: The Most Important Truth About Correlations
by Gatis Roze,
Author, "Tensile Trading"
Far too many investors assume (wrongly) that if two equities – such as the S&P 500 (SPY) and the Vanguard Total Market ETF (VTI) – have a .99 correlation (as they do), then they are interchangeable investments. They expect their performance to be very similar as well. Wrong!
If you’...
READ MORE
MEMBERS ONLY
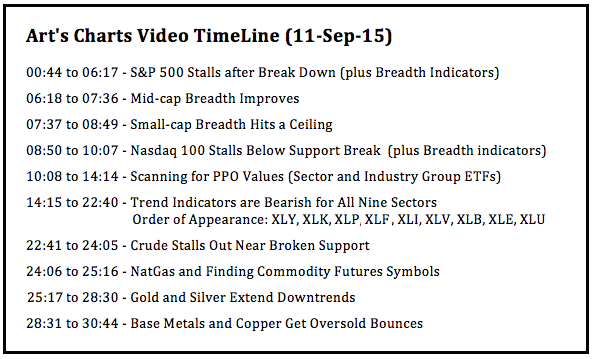
Breadth Indicator Overview, All 9 Sectors in Downtrends, Oil Hits Resistance, Gold and Silver Dull, Copper Leads Base Metals Bounce
by Arthur Hill,
Chief Technical Strategist, TrendInvestorPro.com
There is clearly a bearish headwind working against stocks right now. The major stock indices are in downtrends after their August support breaks, the key breadth indicators are bearish and all nine sectors are in downtrends. The image below shows the major indexes and their key breadth indicators. The boxes...
READ MORE
MEMBERS ONLY

Context is King
by Bruce Fraser,
Industry-leading "Wyckoffian"
Accumulation and Distribution Schematics are like road maps (click here for the Distribution schematics discussed in this article). They point toward where to go and how to get there. They are like road maps without the mileage to the next turn. Just to rev things up, each time a Wyckoffian...
READ MORE
MEMBERS ONLY
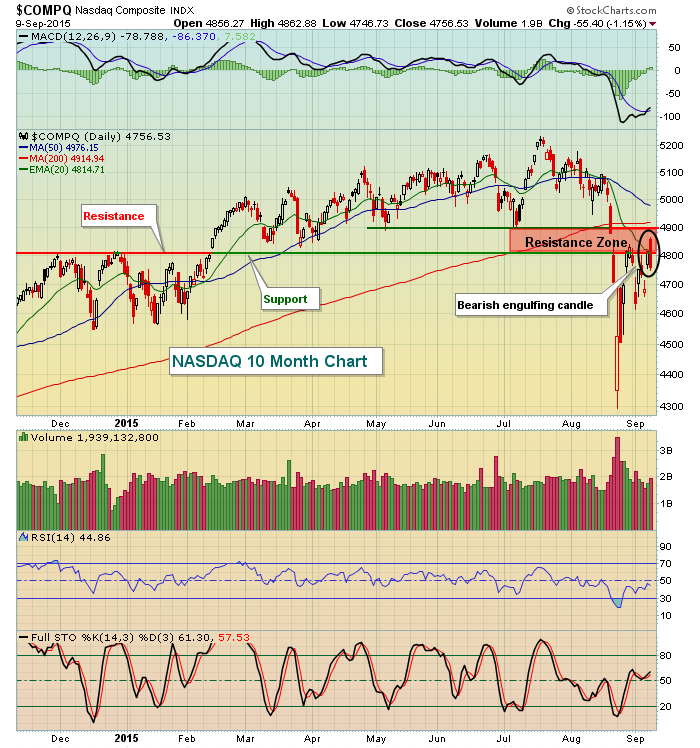
Confused? The Market Sure Is!
by Tom Bowley,
Chief Market Strategist, EarningsBeats.com
Market Recap for Thursday, September 10, 2015
I wouldn't view Thursday's action to be bullish as few technical resistance levels were cleared, but the fact there was no follow through to the downside after Wednesday's bearish candlesticks at major resistance was a moral victory...
READ MORE
MEMBERS ONLY
Scanning for Opportunities in a Bear Market
by Erin Swenlin,
Vice President, DecisionPoint.com
I think most are in agreement that we are now in a bear market. As far as DecisionPoint models are concerned, we definitely are. When the 50-EMA crosses below the 200-EMA, we consider that ETF/Stock/Index/MF to be in a "bear market". To be successful, we...
READ MORE
MEMBERS ONLY
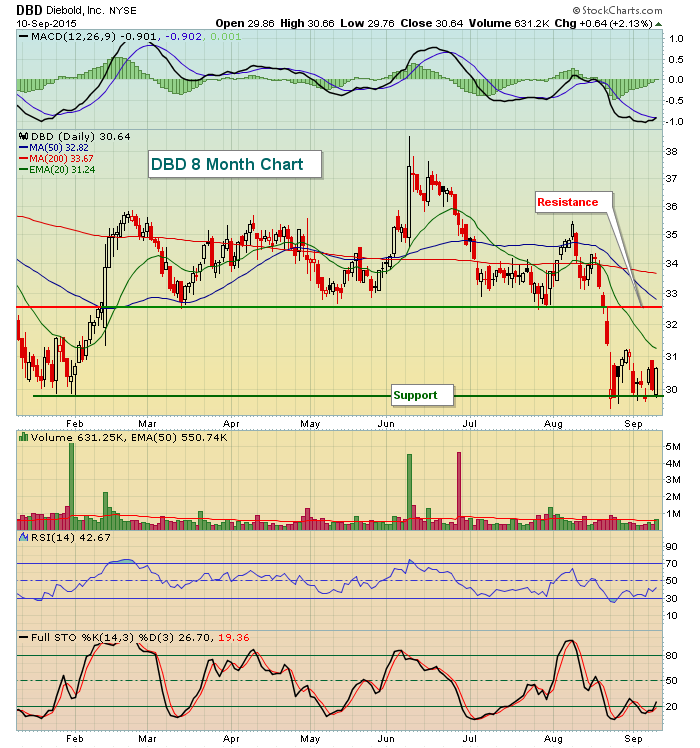
Diebold Bounces Off Support...Again
by Tom Bowley,
Chief Market Strategist, EarningsBeats.com
Computer hardware ($DJUSCR) led the technology sector to outsized gains on Thursday and Diebold (DBD) benefited by bouncing off price support. The 29.50-30.00 area has served as excellent support in 2015. Consider the trading range to be 29.50-32.50 in the near-term until either support or resistance...
READ MORE
MEMBERS ONLY

Evidence Points to Further Testing of the Lows
by Martin Pring,
President, Pring Research
* S&P engulfing pattern hints at downside pressure to come
* Guggenheim asset ratio continues to signal money outflow
* EEM give indications of a better short-term performance to come
* BOJ so far fails the inflation test
US Equities short-term
The recent wild swings in the market may look random in...
READ MORE
MEMBERS ONLY

INDIVIDUAL STOCK LEADERS SHOWING RELATIVE STRENGTH INCLUDE KLA TENCOR, FREEPORT MCMORAN, GILEAD SCIENCE, AND ASSURANT -- APPLE IS ALSO STARTING TO SHOW RELATIVE STRENGTH
by John Murphy,
Chief Technical Analyst, StockCharts.com
KLA TENCOR IS SPX LEADER... Relative strength in an individual stock during a downside correction is a positive sign. Today, I'm looking at some individual stock leaders who also happen to be in groups that are also showing relative strength. KLAC Tencor (KLAC) is the day's...
READ MORE
MEMBERS ONLY
Zahorchak Measure II
by Greg Morris,
Veteran Technical Analyst, Investor, and Author
In a previous article entitled, “Zahorchak Measure” I introduced a process that was one of the first I read about back in the 1970s that hooked me on technical analysis. The article generated a lot of interest so with this article I’m going to add more detail on the...
READ MORE
MEMBERS ONLY
Bears Regain Control, Look Out Below
by Tom Bowley,
Chief Market Strategist, EarningsBeats.com
Market Recap for Wednesday, September 9, 2015
Technical failure after technical failure. Bearish engulfing candles. Dark cloud cover candles. Opens above 20 day EMAs and closes beneath. You name the short-term failure and it probably occurred on a chart somewhere on Wednesday. After two weeks of torment, global markets rallied...
READ MORE
MEMBERS ONLY
Bullish Breadth Thrust Falls Short -- Wedges Evolve as August Breaks Hold -- 5 Large-Caps to Watch
by Arthur Hill,
Chief Technical Strategist, TrendInvestorPro.com
Bullish Breadth Thrust Falls Short
Stocks surged on Wednesday's open, but quickly gave up these gains and declined into the close. Selling pressure was quite broad as AD Percent for the S&P 500 exceeded -80%. Small-caps held up better as S&P 600 AD Percent...
READ MORE
MEMBERS ONLY

JAPANESE STOCKS HAVE BIGGEST JUMP IN SEVEN YEARS AS YEN DROPS -- RISING BOND YIELDS HELP BANKS AND INSURERS -- BUT HURT REITS AND UTILITIES -- OVERSOLD COPPER AND COPPER STOCKS ARE BOUNCING OFF MAJOR CHART SUPPORT AND MAY BE SCRAPING BOTTOM
by John Murphy,
Chief Technical Analyst, StockCharts.com
JAPANESE STOCKS BOUNCE OFF MAJOR SUPPORT LINE... Japan was the only country that didn't participate in yesterday's global stock rally. It's making up for that today in a big way. And at a good time. I've been showing a lot of global...
READ MORE
MEMBERS ONLY
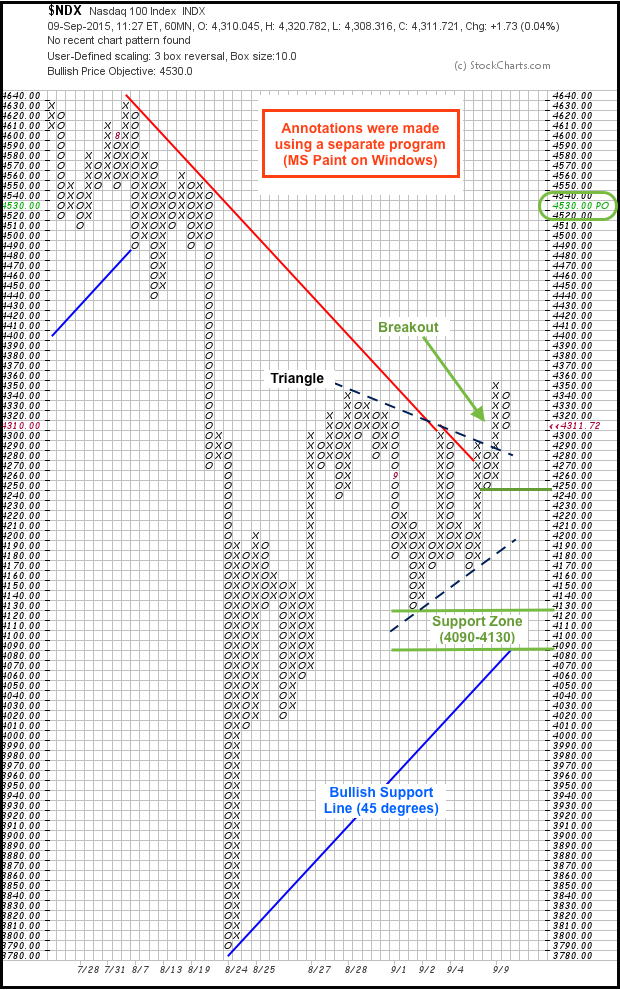
Plotting the Nasdaq 100 Breakout on an Intraday Point & Figure Chart
by Arthur Hill,
Chief Technical Strategist, TrendInvestorPro.com
StockCharts users can create intraday P&F charts to shorten their time horizon and identify key levels to watch. The chart below is a 60-minute P&F chart with 10 points per box and a classic 3-box reversal. After plunging to 3790 in mid August, the Nasdaq 100...
READ MORE