MEMBERS ONLY
Stock Market Today: Real Estate and Tech Lead, Energy Down

by Jayanthi Gopalakrishnan,
Director of Site Content, StockCharts.com
KEY TAKEAWAYS
* The real estate sector gains ground as interest rate cuts loom.
* Technology stocks are showing slight gains, but not enough to shift momentum.
* Energy prices slide lower on weakened demand.
The Real Estate sector took the lead in Tuesday's trading, probably because interest rate cuts are...
READ MORE
MEMBERS ONLY

Biotech's Big Comeback: Why Investors are Eyeing This Beaten-Down Sector

by Karl Montevirgen,
The StockCharts Insider
KEY TAKEAWAYS
* With Fed rate cuts now widely anticipated, investors are looking to the biotech industry for potential investment opportunities.
* Biotech, a highly-speculative industry, has declined sharply since 2020 as inflation, along with higher interest rates, set in.
* You can spot green shoots of capital flowing into biotech; watch the...
READ MORE
MEMBERS ONLY

DP Trading Room: AI Bubble Deflating

by Erin Swenlin,
Vice President, DecisionPoint.com
The recent decline last week revealed that the artificial intelligence bubble is deflating. Magnificent Seven stocks are unwinding in response to investors losing confidence in the AI trade in general. Carl gives us a complete picture of the Magnificent Seven in the short and intermediate terms. It doesn't...
READ MORE
MEMBERS ONLY

Equities Say "Go Fish"; How "Healthy" are the Markets?

by Alex Cole,
Co-founder, GoNoGo Charts®

by Tyler Wood,
Co-founder, GoNoGo Charts®
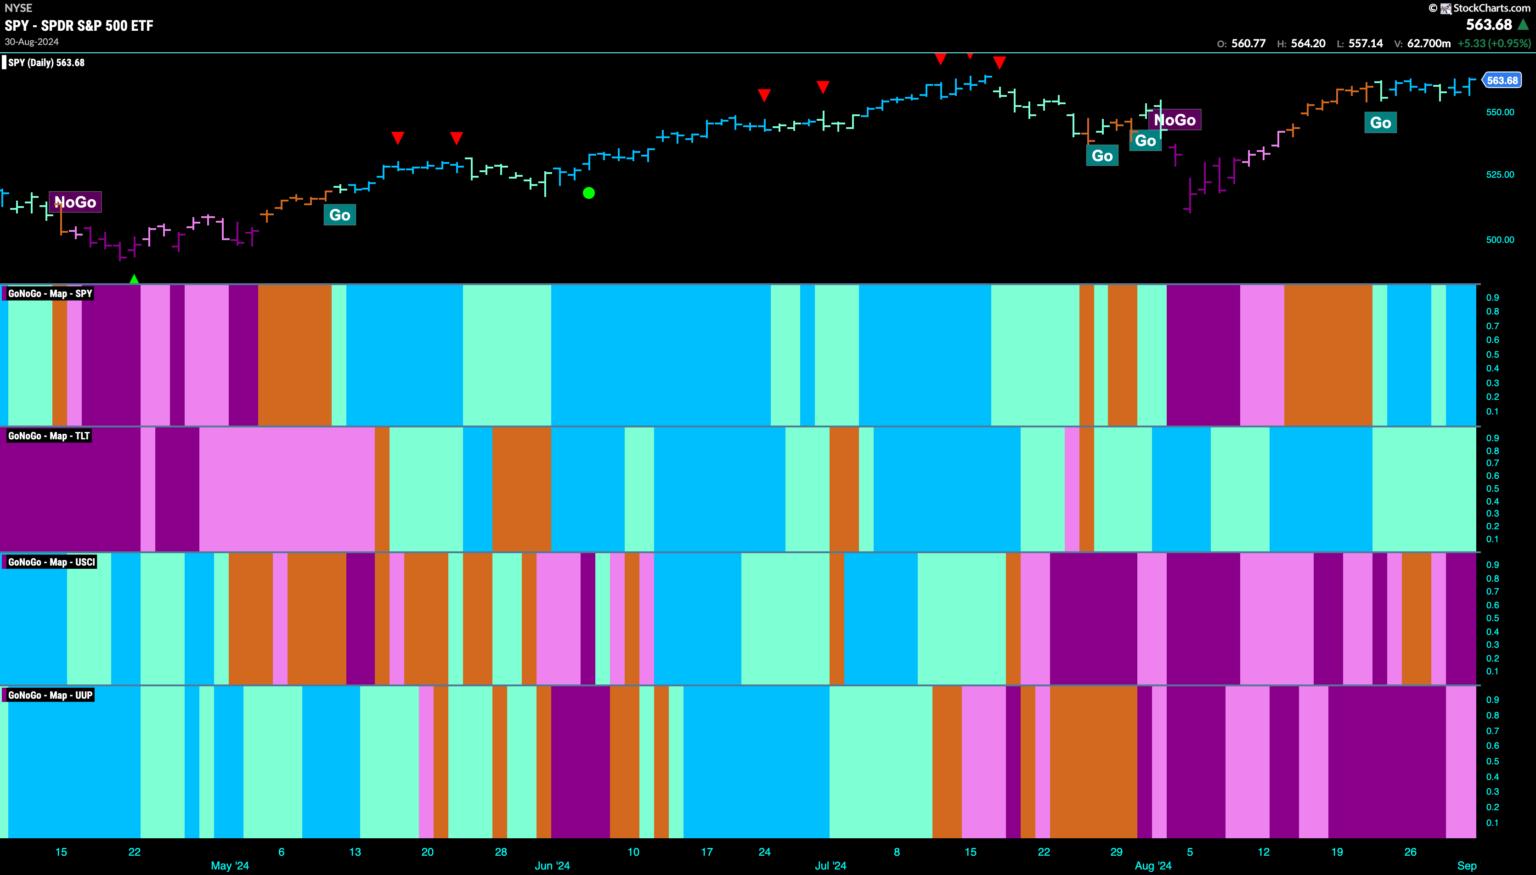
Good morning and welcome to this week's Flight Path. Equities flashed an uncertain "Go Fish" bar at the end of the week as the markets became even more unsettled. Treasury bond prices remained in a "Go" trend and saw that trend was strong for...
READ MORE
MEMBERS ONLY

Market Timing for a Rules-Based Strategy

by Arthur Hill,
Chief Technical Strategist, TrendInvestorPro.com
KEY TAKEAWAYS
* Chartists need a market timing mechanism to assess risk
* Risk is above average during bear markets (preserve capital)
* Risk levels are acceptable during bull markets (invest capital)
Any strategy that trades stocks needs some sort of market timing mechanism to identify bull and bear markets. Typically, stock strategies...
READ MORE
MEMBERS ONLY

September: Exit Light, Enter Night

by Tom Bowley,
Chief Market Strategist, EarningsBeats.com
Much like the southeastern portion of the U.S. frets over the potential of devastating hurricanes, stock traders and investors brace for their own financial hurricane this time of year. Last week, we saw the NASDAQ 100 ($NDX) tumble, dropping nearly 6% during a holiday-shortened trading week. This isn'...
READ MORE
MEMBERS ONLY

Four Intermarket Confidence Relationships that Aren't Confident

by Martin Pring,
President, Pring Research
Most of the primary trend indicators I follow are in a bullish mode and show few signs of flagging. That said, some intermarket relationships, which help to indicate whether the environment is risk-off or risk-on, have started to move in a risk-off direction. That's usually a bearish omen...
READ MORE
MEMBERS ONLY
Week Ahead: NIFTY Shows Early Signs of a Likely Disruption of Uptrend; Tread Cautiously

by Milan Vaishnav,
Founder and Technical Analyst, EquityResearch.asia and ChartWizard.ae
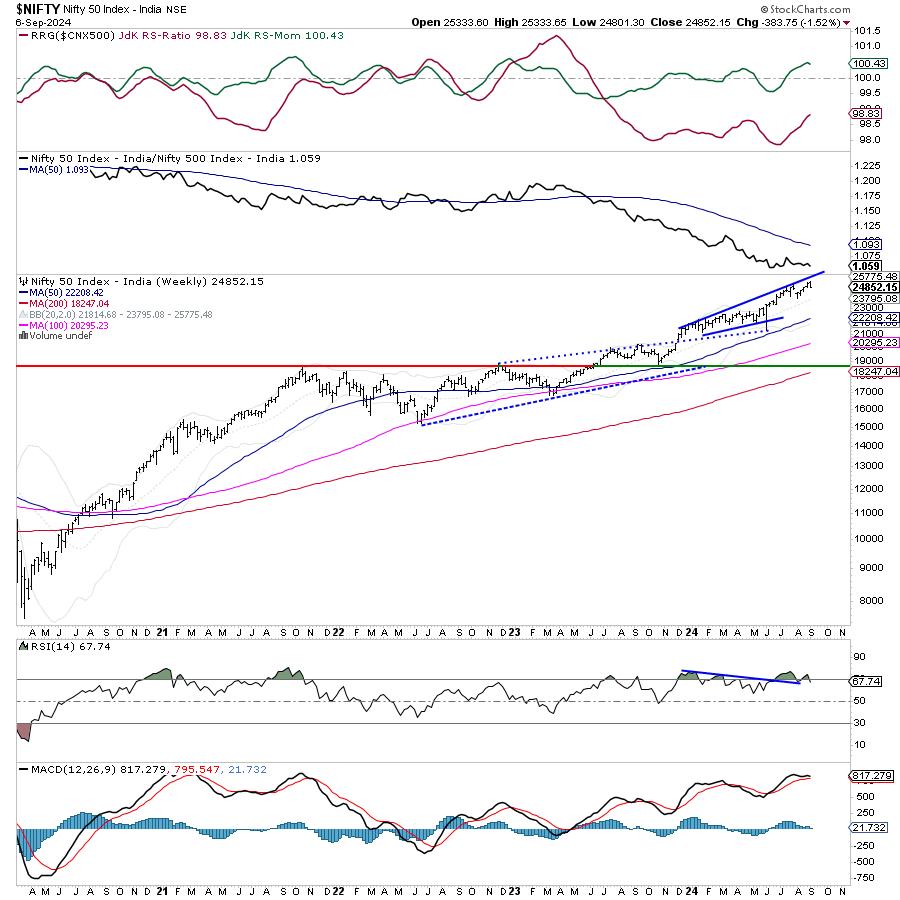
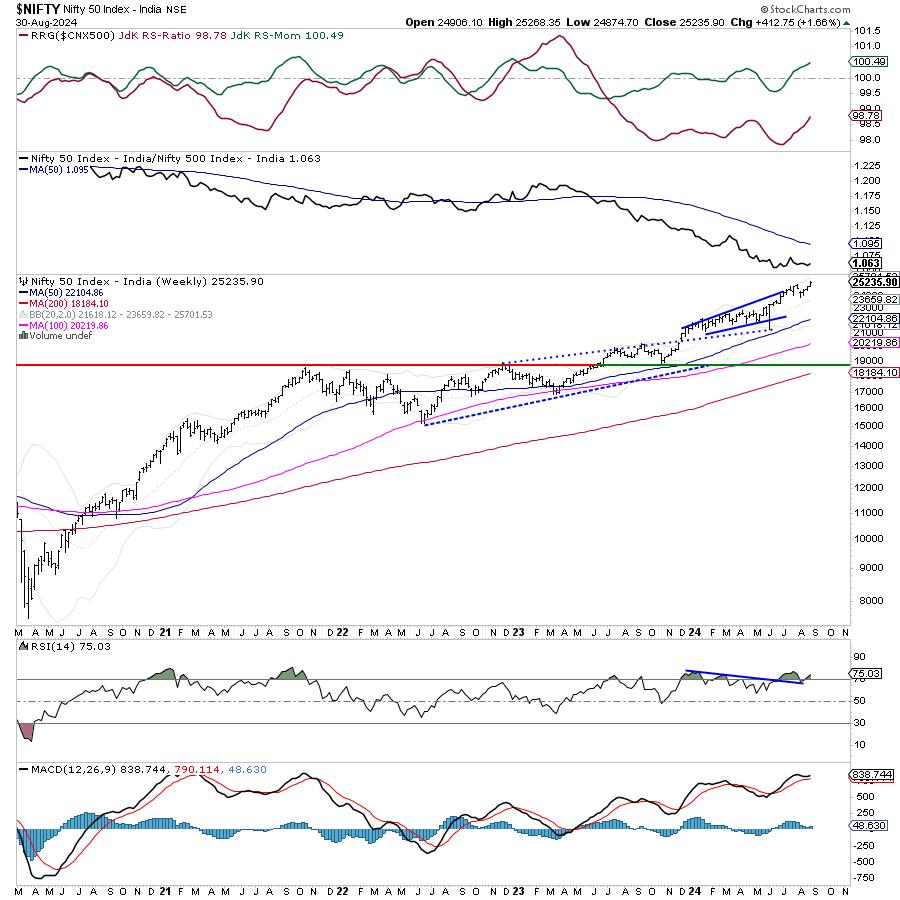
After initially forming a fresh incremental lifetime high, the markets succumbed to selling pressure from higher levels after spending some indecisive sessions during the week. The week that went by saw some early signs of the Nifty entering into broad corrective consolidation while ending near its low point of the...
READ MORE
MEMBERS ONLY
Three Charts Screaming Market Top

by David Keller,
President and Chief Strategist, Sierra Alpha Research
KEY TAKEAWAYS
* Weaker price momentum suggests an exhaustion of buyers.
* The VIX pushed back above 20 this week, indicating a higher likelihood of a price correction.
* The equal-weighted S&P 500 made a new all-time high in August, but that was not echoed with a new high from the...
READ MORE
MEMBERS ONLY
Markets Nosedive Amid Recession Fears

by Mary Ellen McGonagle,
President, MEM Investment Research
In this StockCharts TV video, Mary Ellen reviews the current downtrend taking place in the S&P 500 and Nasdaq, and highlights the "uninverting" yield curve. She finishes with a deep dive into Nvidia, sharing how to handle the stock depending on your investment horizon.
This video...
READ MORE
MEMBERS ONLY
Broad-Based Stock Market Selloff: How to Position Your Portfolio?
by Jayanthi Gopalakrishnan,
Director of Site Content, StockCharts.com
KEY TAKEAWAYS
* Broader stock market indexes sell off as investors fear rate cuts may be too late.
* Treasury yields fell to their lowest yearly levels.
* Big Tech stocks got hammered, with semiconductor stocks getting hit the hardest.
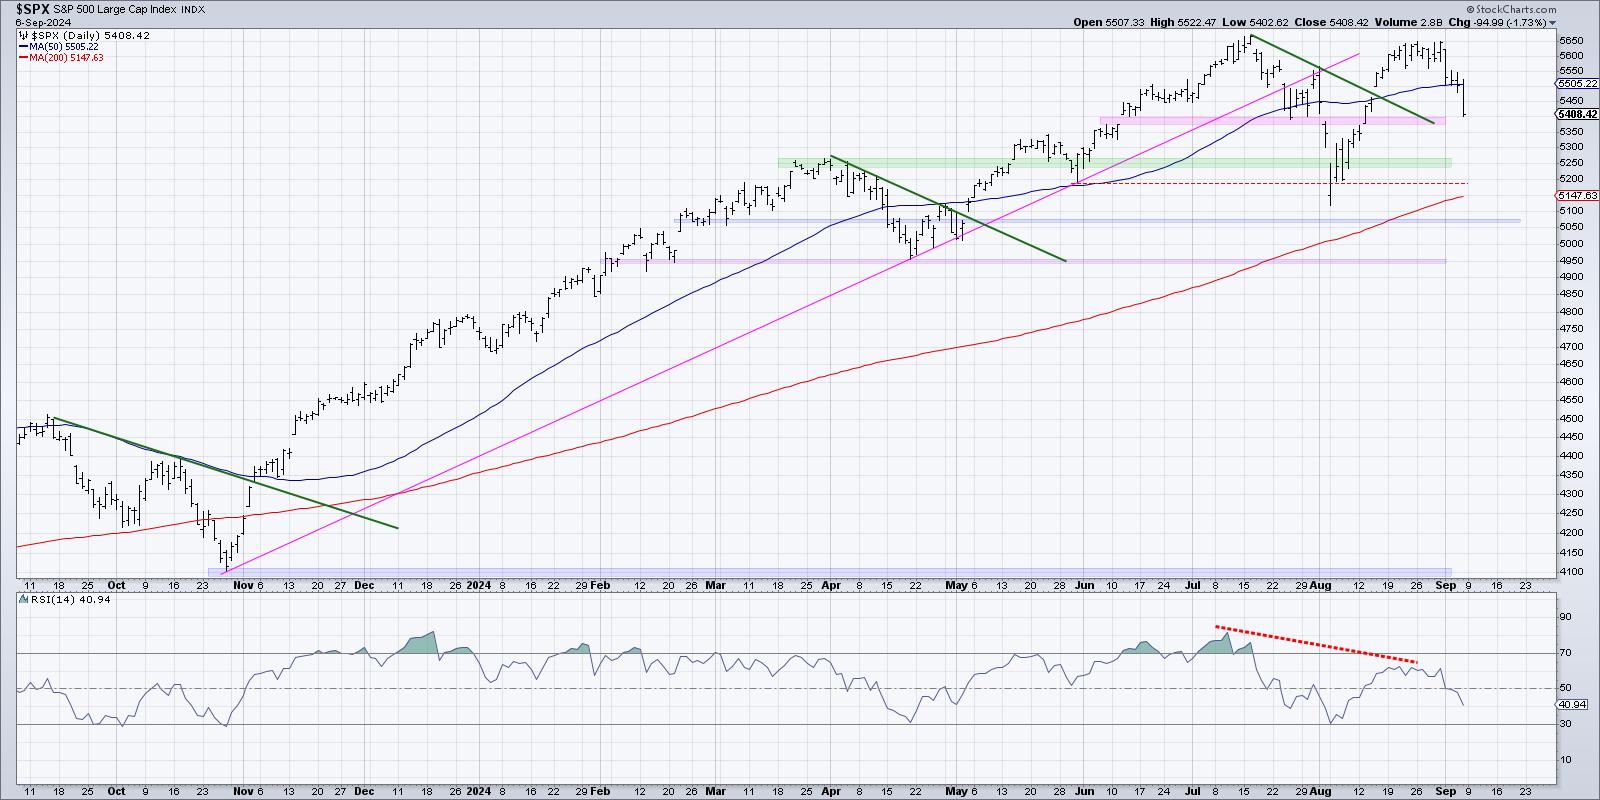
After a week of wavering action, the stock market made a directional move—...
READ MORE
MEMBERS ONLY
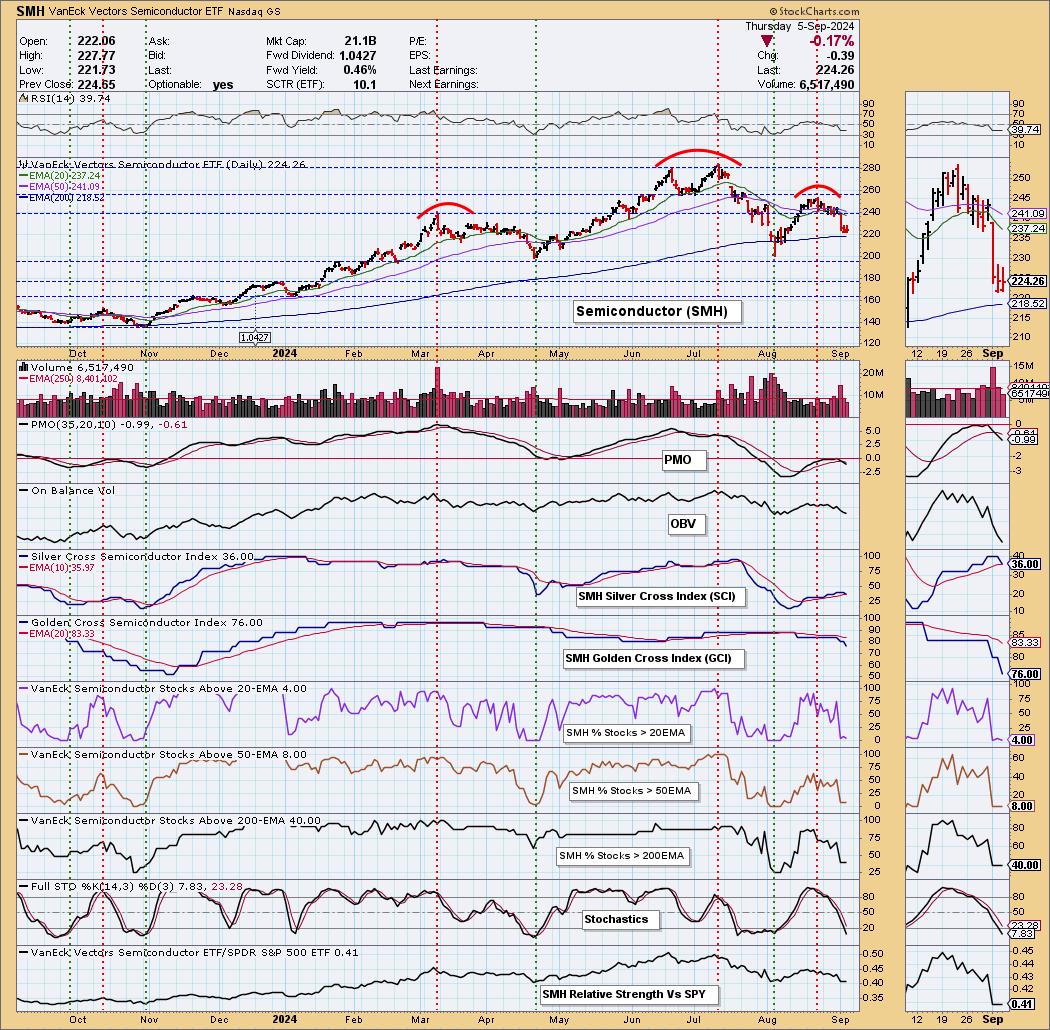
Intermediate-Term Bearish Head & Shoulders on Semiconductors (SMH)
by Erin Swenlin,
Vice President, DecisionPoint.com
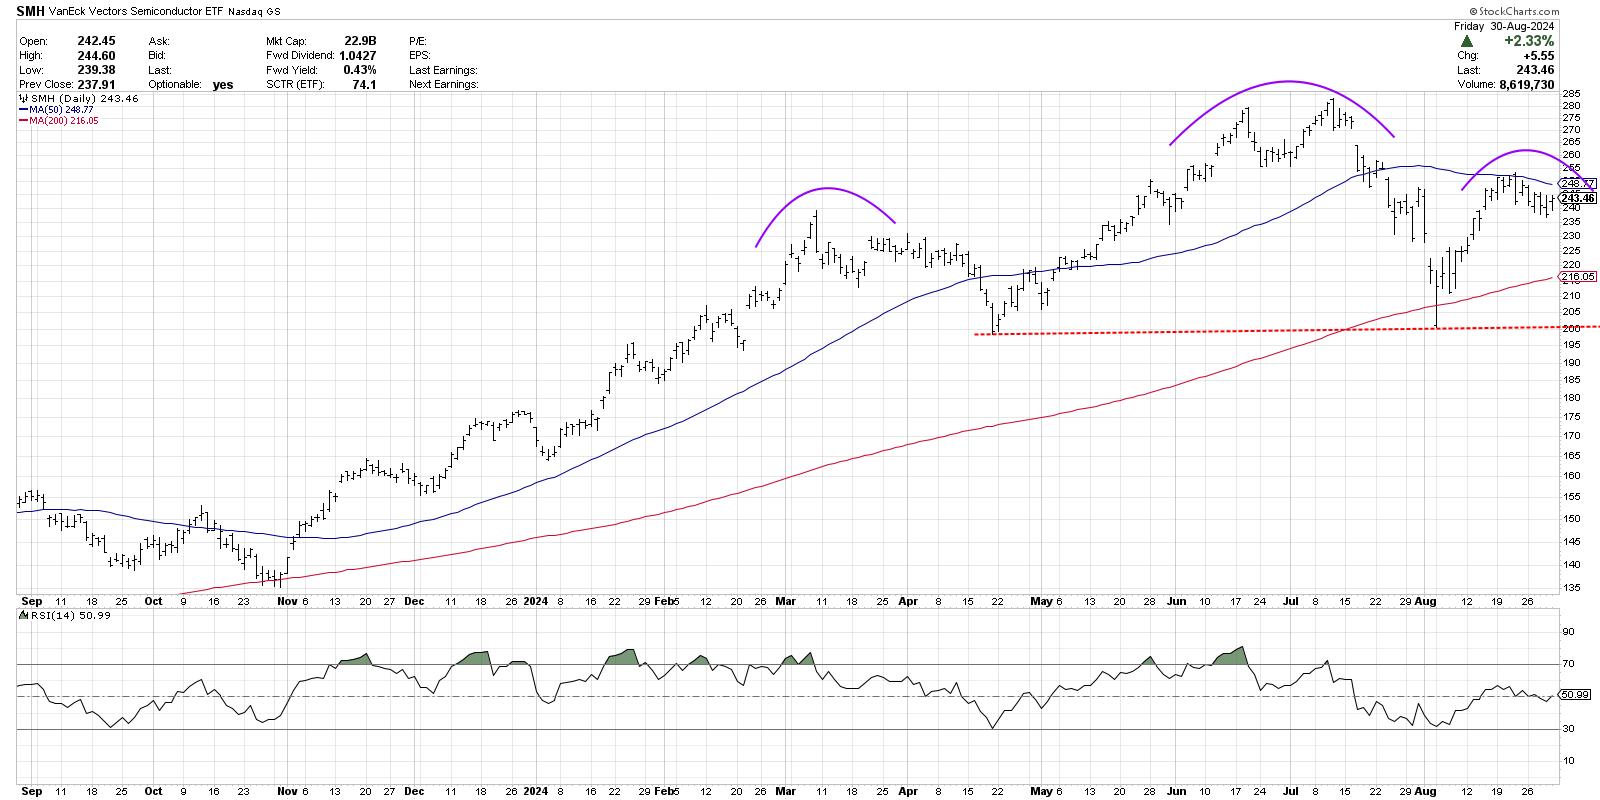
We are always on the lookout for chart patterns. Recently, we've found a bearish head-and-shoulders developing on Semiconductors (SMH).
Looking at the daily chart below, we can see the pattern developing. However, we do have to point out participation. Note the very low percentages on %Stocks > 20/...
READ MORE
MEMBERS ONLY
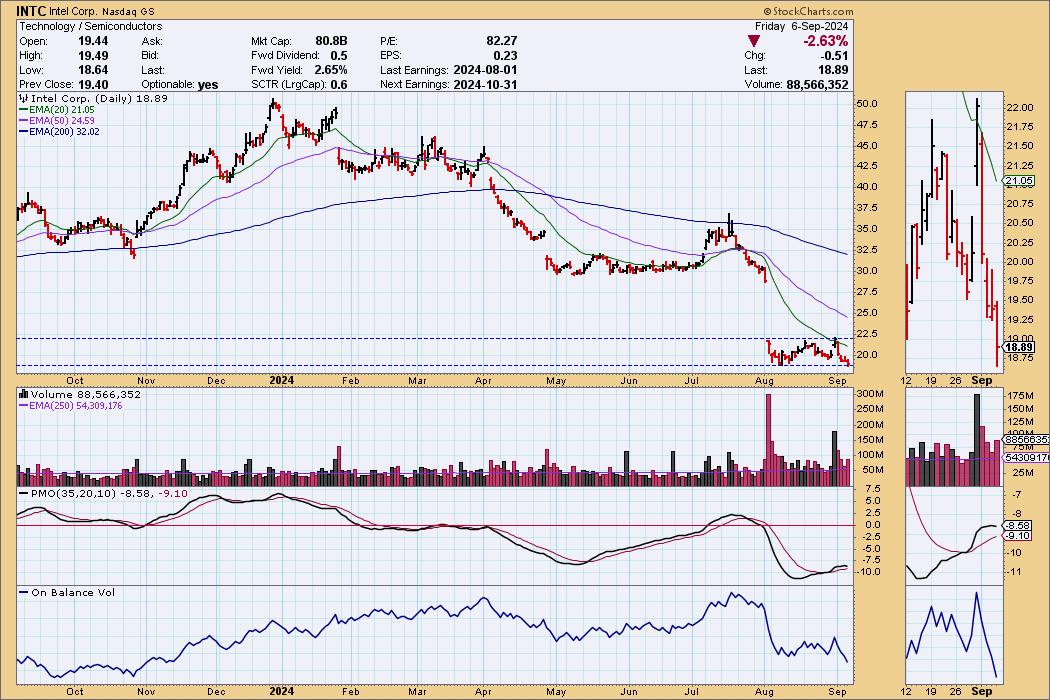
Is It Time to Buy Intel?

by Carl Swenlin,
President and Founder, DecisionPoint.com
I've been around long enough to remember when Intel (INTC) was the NVIDIA of the day. Now, INTC is under severe pressure, having suspended its dividend, and is currently being considered for removal from the Dow 30 Industrial Average. Oh, how the mighty have fallen!
With INTC having...
READ MORE
MEMBERS ONLY
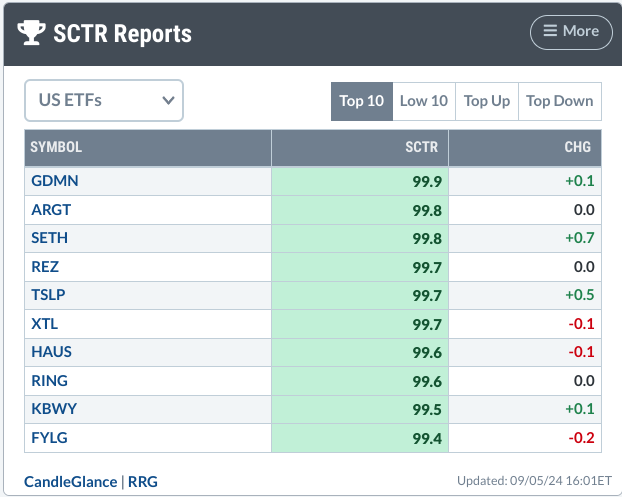
How to Spot a Golden Mining Opportunity Using SCTR Reports
by Karl Montevirgen,
The StockCharts Insider
KEY TAKEAWAYS
* The SCTR Report highlighted two gold miner ETFs, indicating that the industry is seeing positive movement.
* A deeper dive into gold miner ETFs uncovers problems and opportunities.
* The ZigZag line applied to the chart of GDX helps identify entry and exit levels.
On Thursday afternoon, I dove into...
READ MORE
MEMBERS ONLY

The SCTR Report: Why TSLA Stock Sees Tremendous Strength
by Jayanthi Gopalakrishnan,
Director of Site Content, StockCharts.com
KEY TAKEAWAYS
* Tesla's stock price has been gaining technical strength, evident from its daily and weekly price charts.
* An analysis of Tesla's stock price shows a potential intermediate-term trading opportunity.
* Before entering a buy position, be sure to identify your entry and exit positions.
When the...
READ MORE
MEMBERS ONLY
The Best Reversal Patterns (Trading Strategy Explained)

by Joe Rabil,
President, Rabil Stock Research
In this exclusive StockCharts TV video, Joe shares how he identifies and trades a reversal pattern. Highlighting what causes him to focus in on a stock, he shares the 1-2-3 reversal pattern, along with the keys in MACD and ADX that allow you to improve the risk/reward equation in...
READ MORE
MEMBERS ONLY

S&P 500 Tempest in a Teapot

by Bruce Fraser,
Industry-leading "Wyckoffian"
As we have discussed many times, financial markets are fractal. Different timeframes produce similar price structures. This is a very valuable phenomena for the study and practice of trading. When tracking the intraday time frame; Wyckoff structures of Accumulation, Markup, Distribution and Markdown repeat over and over. This creates a...
READ MORE
MEMBERS ONLY

How to Spot a Hedge Fund Trap: MicroStrategy's Dramatic Plunge
by Karl Montevirgen,
The StockCharts Insider
KEY TAKEAWAYS
* In March 2024, certain hedge funds began heavily shorting MicroStrategy stock.
* Microstrategy was a meme stock that surged 300% from February to March.
* While many investors got burned when Microstrategy's price tanked, there were clues that short sellers were taking over the stock.
In early 2024,...
READ MORE
MEMBERS ONLY
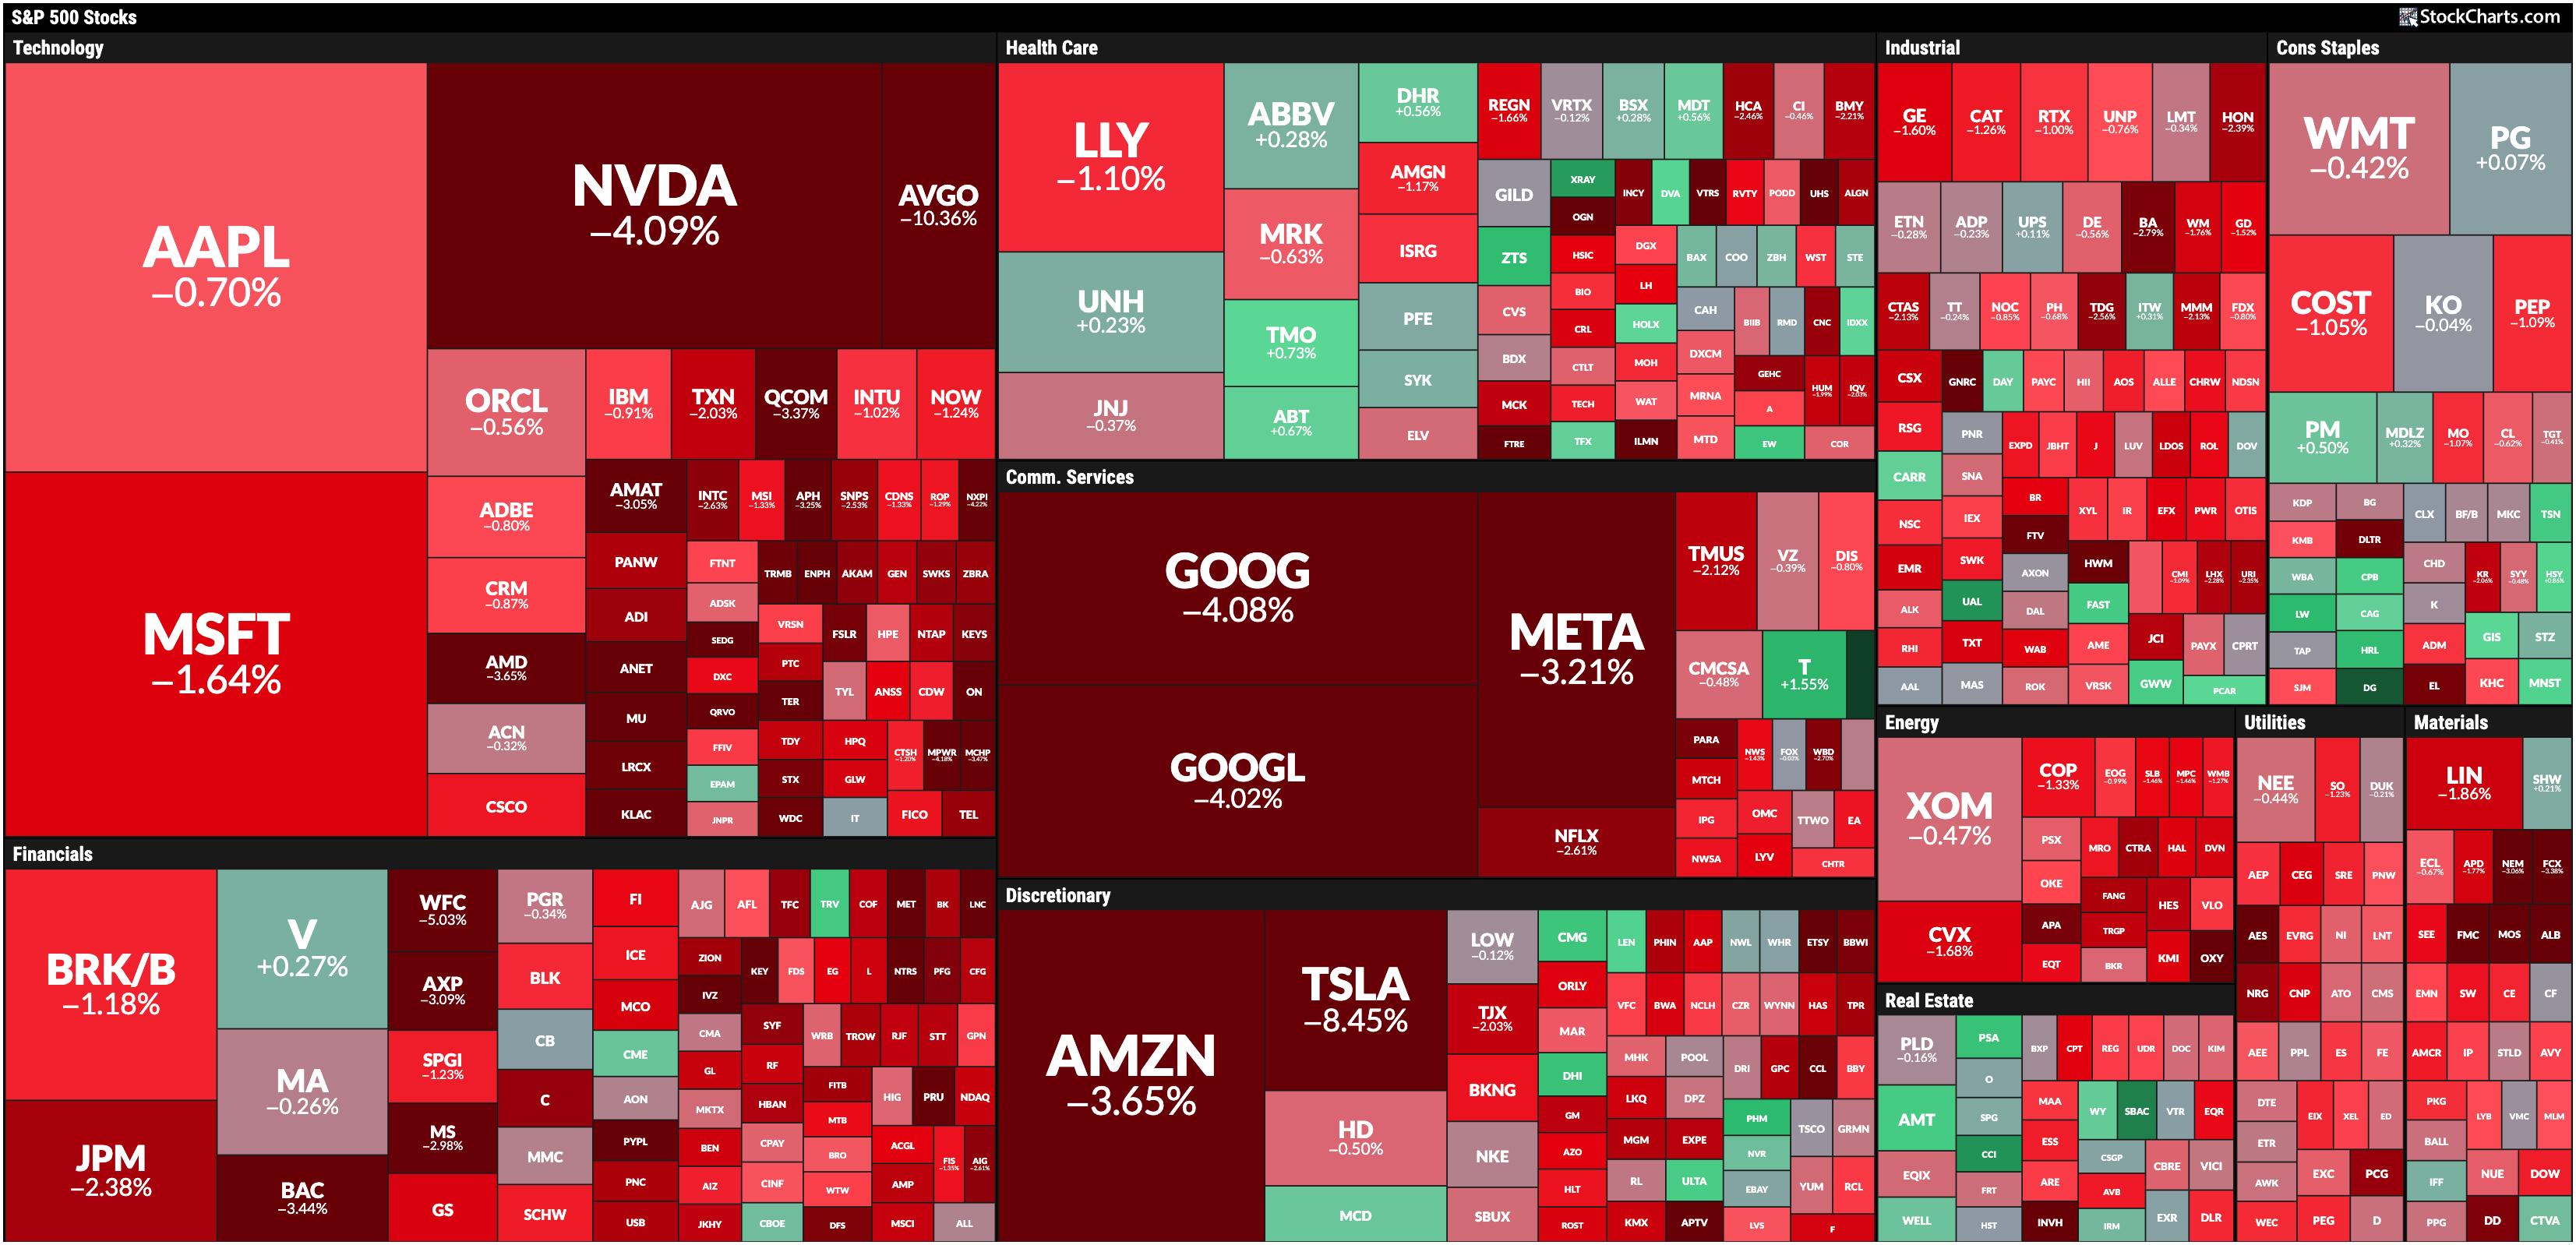
Stock Market Today: Tech Tumbles as Mega-Cap Stocks Get Hit by Major Profit-Taking
by Jayanthi Gopalakrishnan,
Director of Site Content, StockCharts.com
KEY TAKEAWAYS
* Semiconductor stocks get slammed
* Volatility rises as investors become more fearful of more selling pressure ahead
* Investors should be extremely cautious as Broadcom earnings and Non-Farm Payrolls could impact the stock market
I hope you had a relaxing, restful long weekend, and welcome to September.
It was a...
READ MORE
MEMBERS ONLY
Why the S&P 500 Going Sideways is the Best Case Scenario

by Julius de Kempenaer,
Senior Technical Analyst, StockCharts.com
In this video from StockCharts TV,Julius evaluates the completed monthly charts for August, noting the strength of defensive sectors. He then analyzes a monthly RRG and seeks alignment for the observations from the price charts. Could "sideways" be the most positive scenario for the S&P...
READ MORE
MEMBERS ONLY
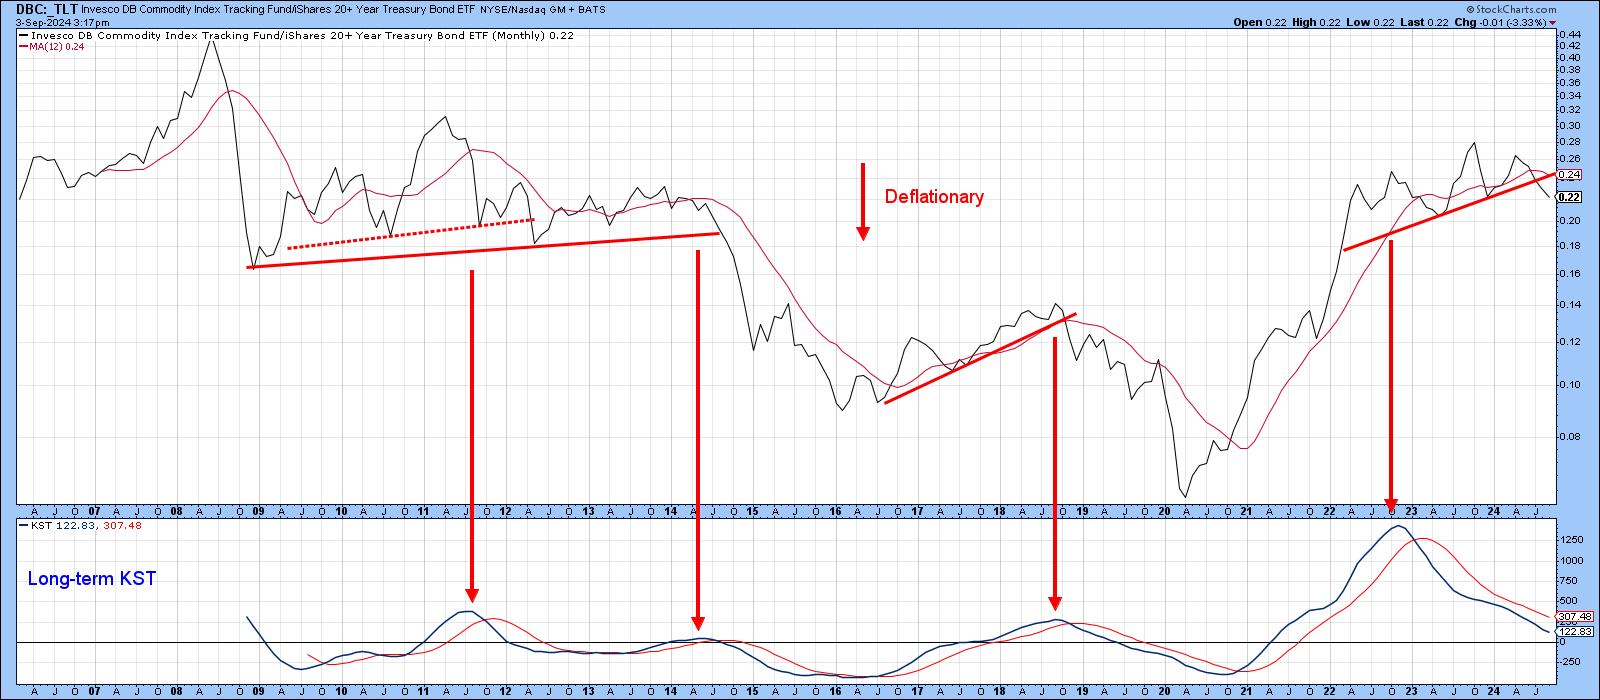
Is It Inflation or Deflation? What's in Your Wallet?
by Martin Pring,
President, Pring Research
Every business cycle has an inflationary and deflationary part, and it's very important for both traders and investors at least to try to have some understanding which has the upper hand at any particular point in time.
For example, when the economy is in a slowdown or recessionary...
READ MORE
MEMBERS ONLY
Equities Hold Firm in "Go" Trend as Industrials Play Strong Defense
by Alex Cole,
Co-founder, GoNoGo Charts®
by Tyler Wood,
Co-founder, GoNoGo Charts®
Good morning and welcome to this week's Flight Path. Equities consolidated their new "Go" trend this week. We see that the indicator painted mostly strong blue bars even as price moved mostly sideways. Treasury bond prices remained in a "Go" trend but painted an...
READ MORE
MEMBERS ONLY

Signing Off

by Greg Morris,
Veteran Technical Analyst, Investor, and Author
Signing Off
I want to thank the owner/President of StockCharts.com, Chip Anderson, and his son, Eric, for 25 years of friendship, over 10 years of writing 200+ articles in my "Dancing with the Trend" blog on StockCharts.com. StockCharts.com offers a giant selection of tools...
READ MORE
MEMBERS ONLY

It all Started with a Big Bang!
by Arthur Hill,
Chief Technical Strategist, TrendInvestorPro.com
KEY TAKEAWAYS
* Extended uptrends often start with a bang, a big bang.
* Chartists can find big bangs by measuring price moves in ATR terms.
* Paypal broke a major resistance level with a 5+ ATR advance in August.
Extended trends often start with big bangs and major breakouts. Chartists can identify...
READ MORE
MEMBERS ONLY
Recognize The New Leaders NOW!
by Tom Bowley,
Chief Market Strategist, EarningsBeats.com
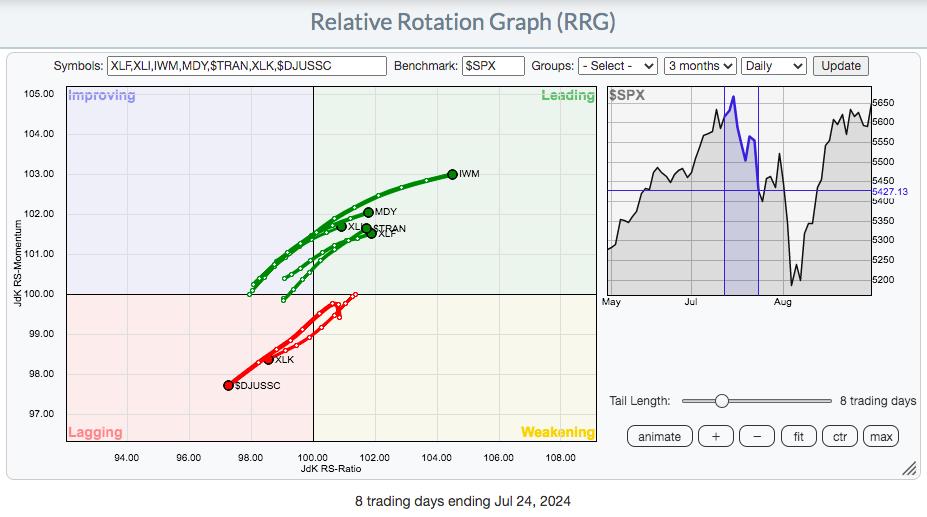
We had a sneak preview of emerging leadership on the morning of July 12th. That was the morning the June Core CPI came in well below expectations. The immediate rotation into several areas was quite evident and you can see it right here on this RRG Chart:
Financials (XLF), industrials...
READ MORE
MEMBERS ONLY
Week Ahead: Uptrend Stays Intact for NIFTY; RRG Shows Distinctly Defensive Setup
by Milan Vaishnav,
Founder and Technical Analyst, EquityResearch.asia and ChartWizard.ae
The past session for the markets stayed quite trending, as the headline index continued with its upward move. While extending its gains, the Nifty 50 Index ended the week on a very strong note. Witnessing a strong momentum on the upside, the market expanded its trading range as well. The...
READ MORE
MEMBERS ONLY

Should You Buy the Dip in NVDA?
by Mary Ellen McGonagle,
President, MEM Investment Research
In this StockCharts TV video, Mary Ellen reviews the broader markets, including NASDAQ weakness, and the outperformance in the equal-weighted S&P 500. She examines NVDA and shares how you should trade the stock depending on your investment horizon. Last up, Mary Ellen reveals top stocks in leadership areas....
READ MORE
MEMBERS ONLY
What Would a Top in Semiconductors Mean for the S&P 500?
by David Keller,
President and Chief Strategist, Sierra Alpha Research
KEY TAKEAWAYS
* A head-and-shoulders top pattern has to complete three phases before it can be considered valid.
* Even if semiconductors would complete this bearish price pattern, strength in other sectors suggests limited impact on the broader equity space.
After Nvidia (NVDA) dropped after earnings this week, investors are once again...
READ MORE
MEMBERS ONLY
Charting Forward: Opportunities You Can Seize in September
by Jayanthi Gopalakrishnan,
Director of Site Content, StockCharts.com
KEY TAKEAWAYS
* Stocks close higher on Friday with volatility remaining low.
* September is typically a weak month for equities.
* Energy and Utilities tend to perform better in September.
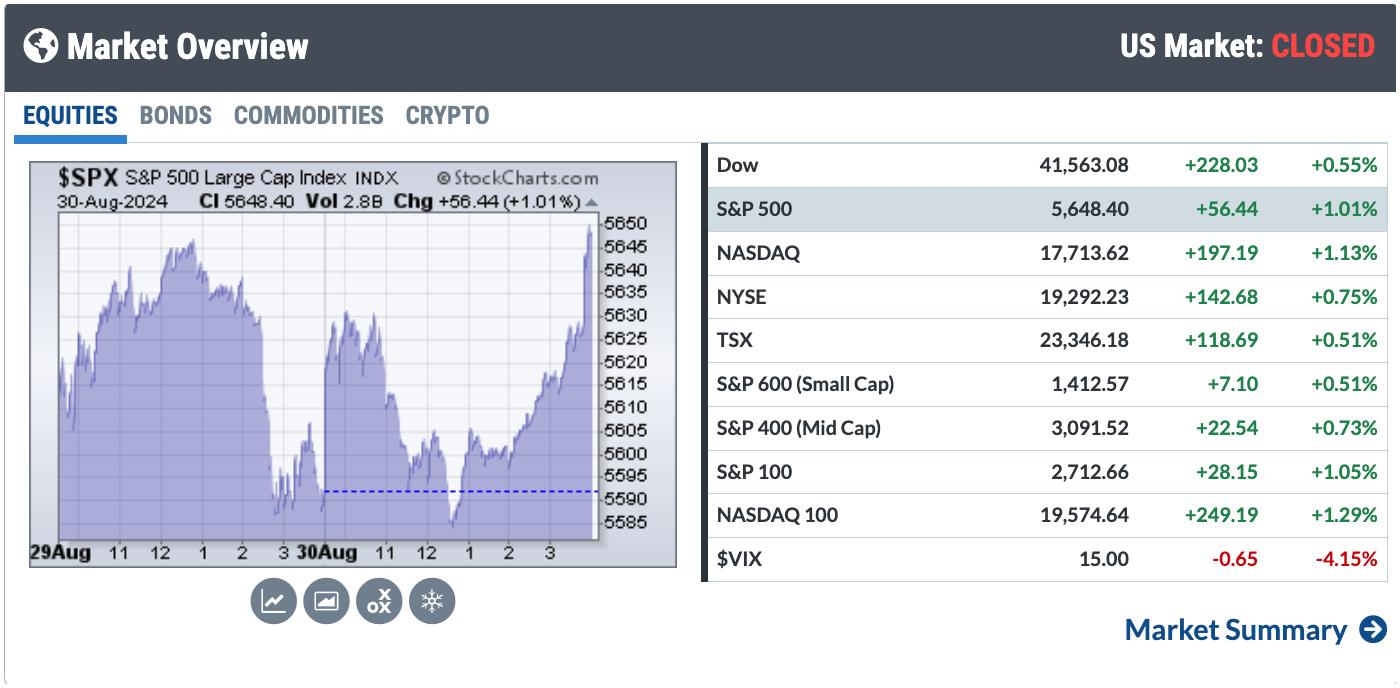
It's a quiet end to August, with the broader stock market indexes wavering higher and lower. The Market Overview panel...
READ MORE
MEMBERS ONLY

New Highs, But Danger Looms—Is XLF Heading for a Big Fall?
by Karl Montevirgen,
The StockCharts Insider
KEY TAKEAWAYS
* Financials typically struggle in September, but tend to rally in Q4.
* XLF has broken into all-time high territory, but its momentum is fading.
* If XLF dips in September, it could present a buying opportunity.
Financial sector stocks are at an all-time high, fueled partly by earnings beats, a...
READ MORE
MEMBERS ONLY
NVDA is Not the Only Semiconductor Stock Out There
by Julius de Kempenaer,
Senior Technical Analyst, StockCharts.com
KEY TAKEAWAYS
* SPY is pushing against resistance.
* The technology sector is out of favor, and semiconductors are a drag for it.
* NVDA is big, but it is not the only semiconductor stock.
It's All Still Relative
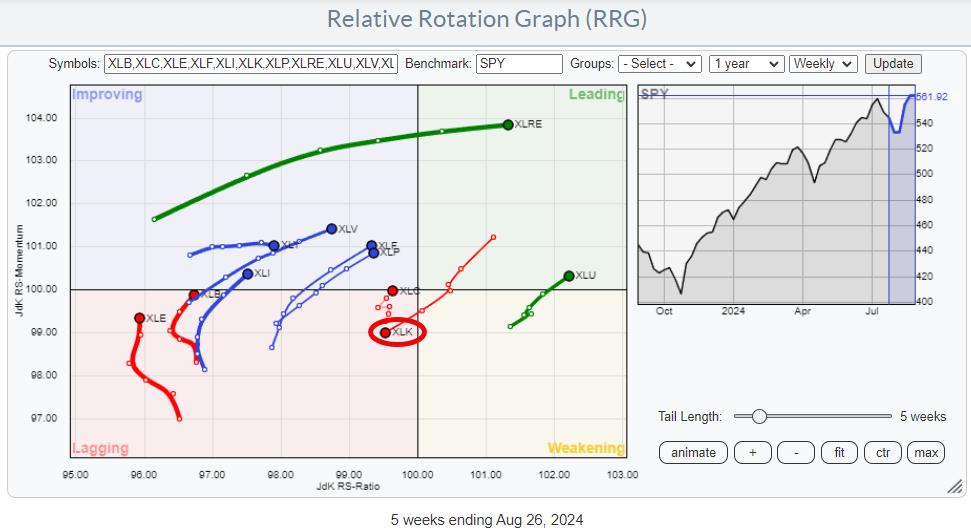
The weekly Relative Rotation Graph, as it looks toward the close of...
READ MORE
MEMBERS ONLY

A Deeper Dive into the Dollar | Focus on Stocks: September 2024

by Larry Williams,
Veteran Investor and Author
Let's get this out of the way...
In our last Family Gathering, I announced I am doing my best to retire. That means we will have our September Family Gathering, the October newsletter and mid-month Family Gathering. After that, "Focus on Stocks" is all over.
I...
READ MORE
MEMBERS ONLY
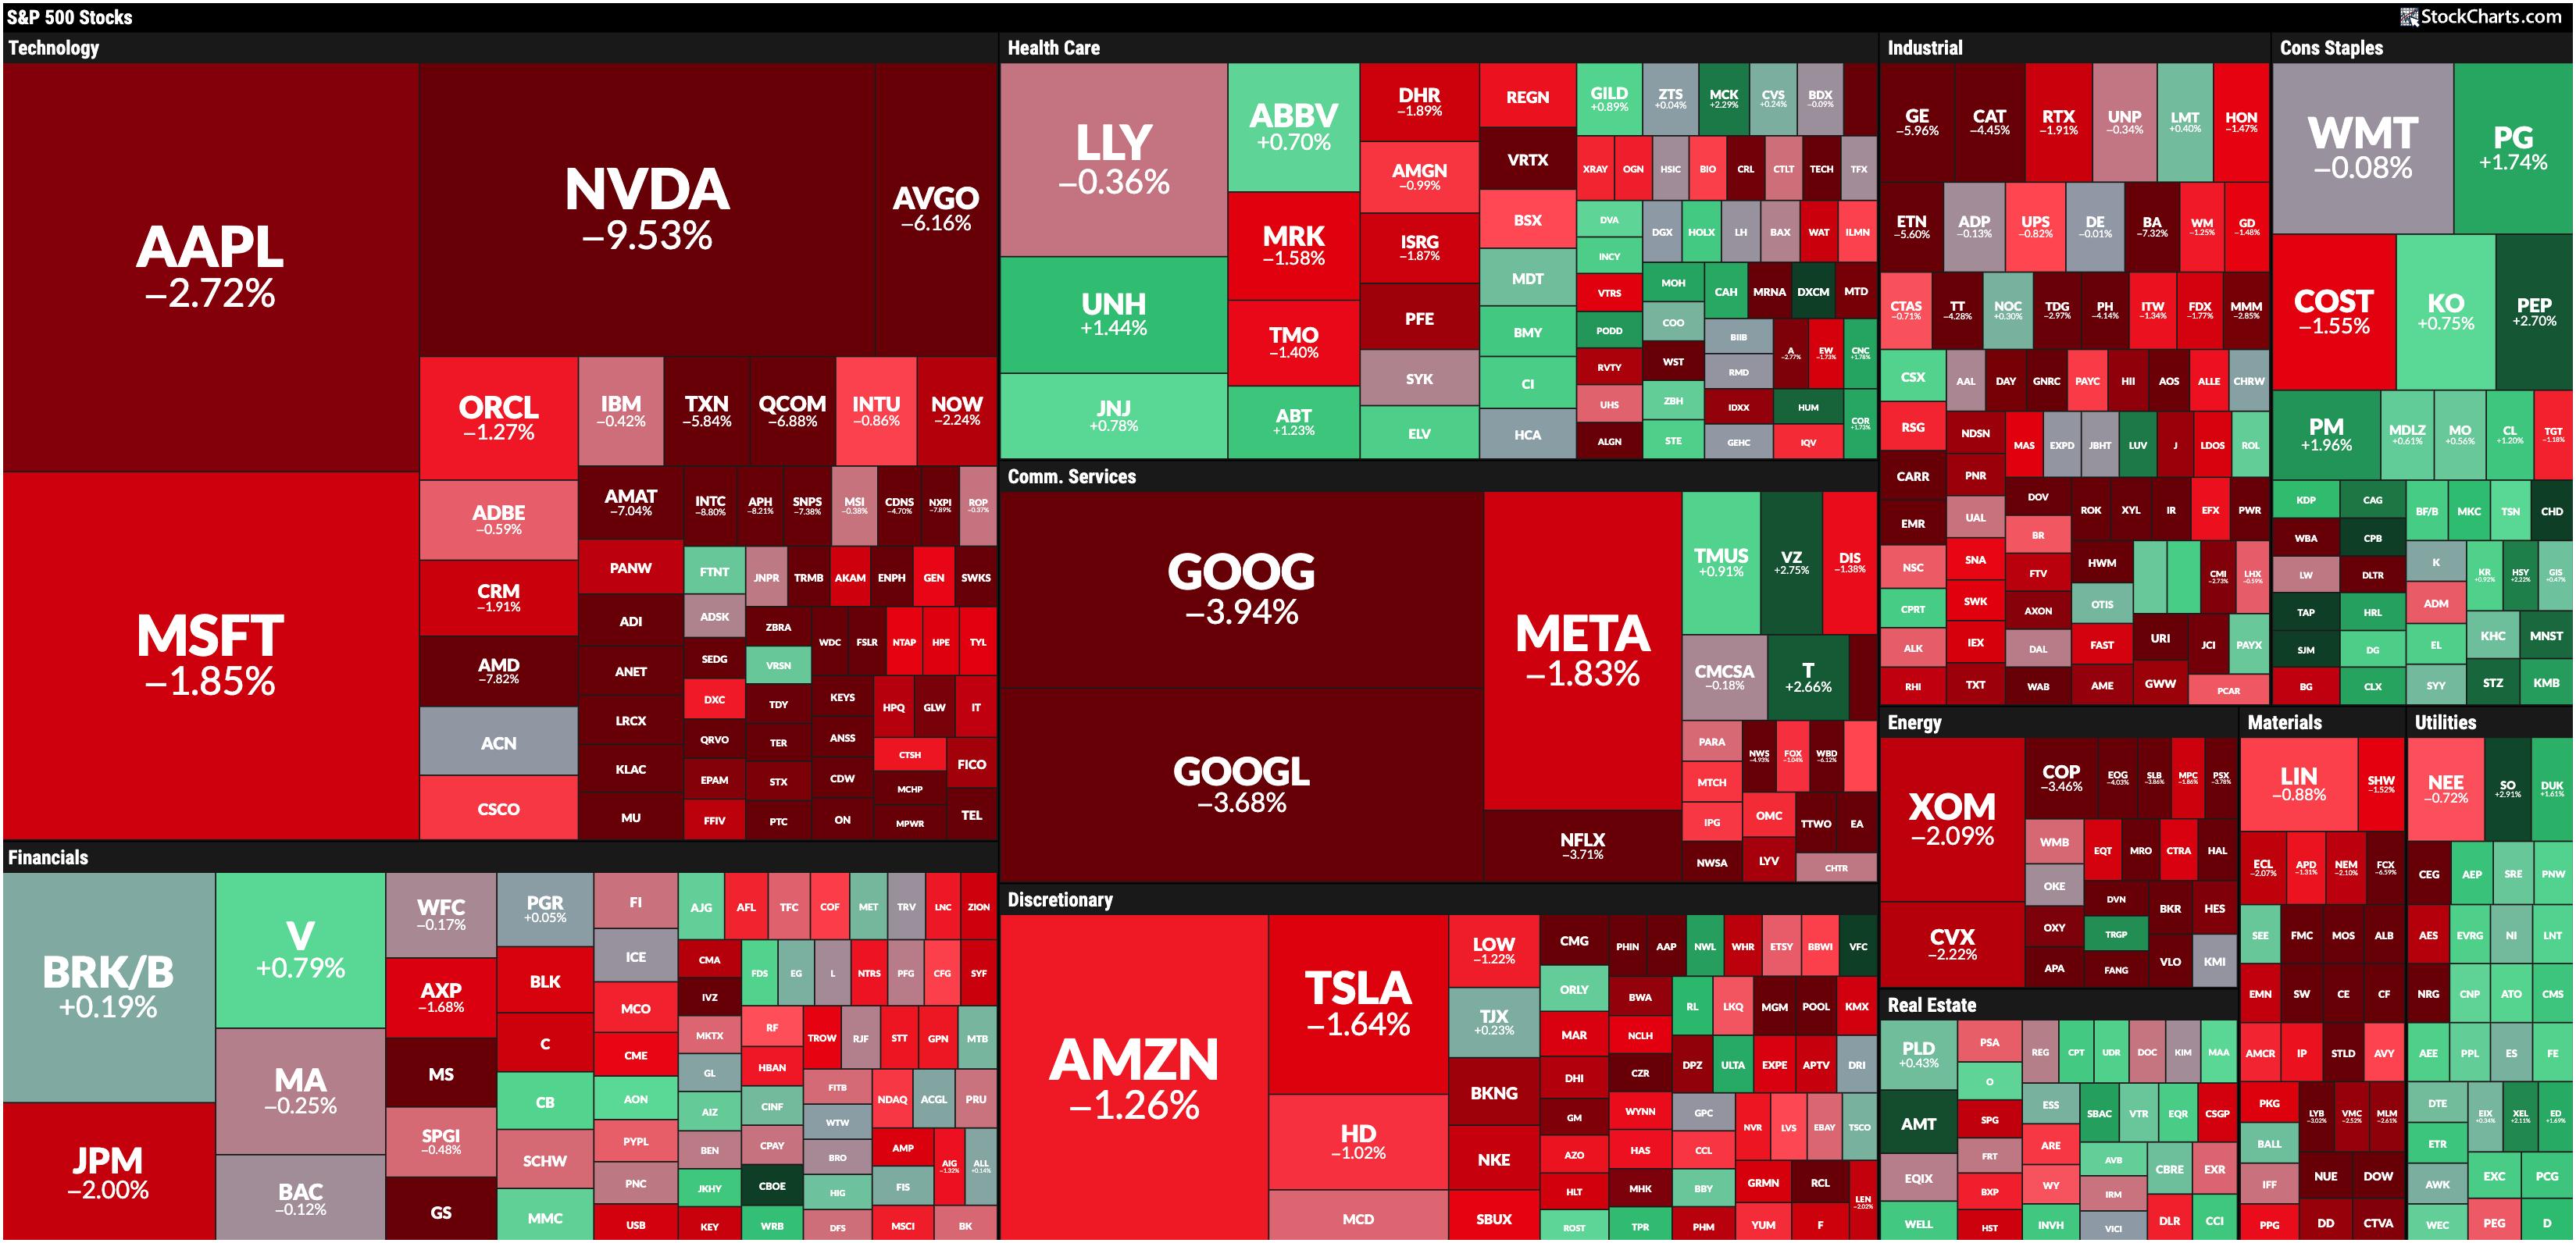
MarketCarpet Report: Stock Market Remains Resilient With Dow Notching a Record Close
by Jayanthi Gopalakrishnan,
Director of Site Content, StockCharts.com
KEY TAKEAWAYS
* The Dow Jones Industrial Average closed at a record high in a thin trading day.
* The Financial sector continues to lead.
* Overall, the stock market remains healthy with low volatility.
The thin trading ahead of Labor Day weekend is here. Despite that, on Thursday, the Dow Jones Industrial...
READ MORE
MEMBERS ONLY

NVDA Earnings Miss, Yet Dow Powers Higher
by David Keller,
President and Chief Strategist, Sierra Alpha Research
In this edition of StockCharts TV'sThe Final Bar, Dave breaks down key sector leadership themes and why growth stocks like Nvidia continue to take a back seat to value-oriented sectors. He speaks to the inverted yield curve, performance of the equal-weighted S&P 500 vs. the Magnificent...
READ MORE
MEMBERS ONLY
Stock Market Today: NVDA Reports, Tech Lags, Financials Take the Lead
by Jayanthi Gopalakrishnan,
Director of Site Content, StockCharts.com
KEY TAKEAWAYS
* The leading sector today was the Financials, followed by Health Care and Utilities.
* Technology stocks sold off significantly and was the worst sector performer.
* With interest rate cuts expected in the next FOMC meeting, financial stocks have the potential to rise further.
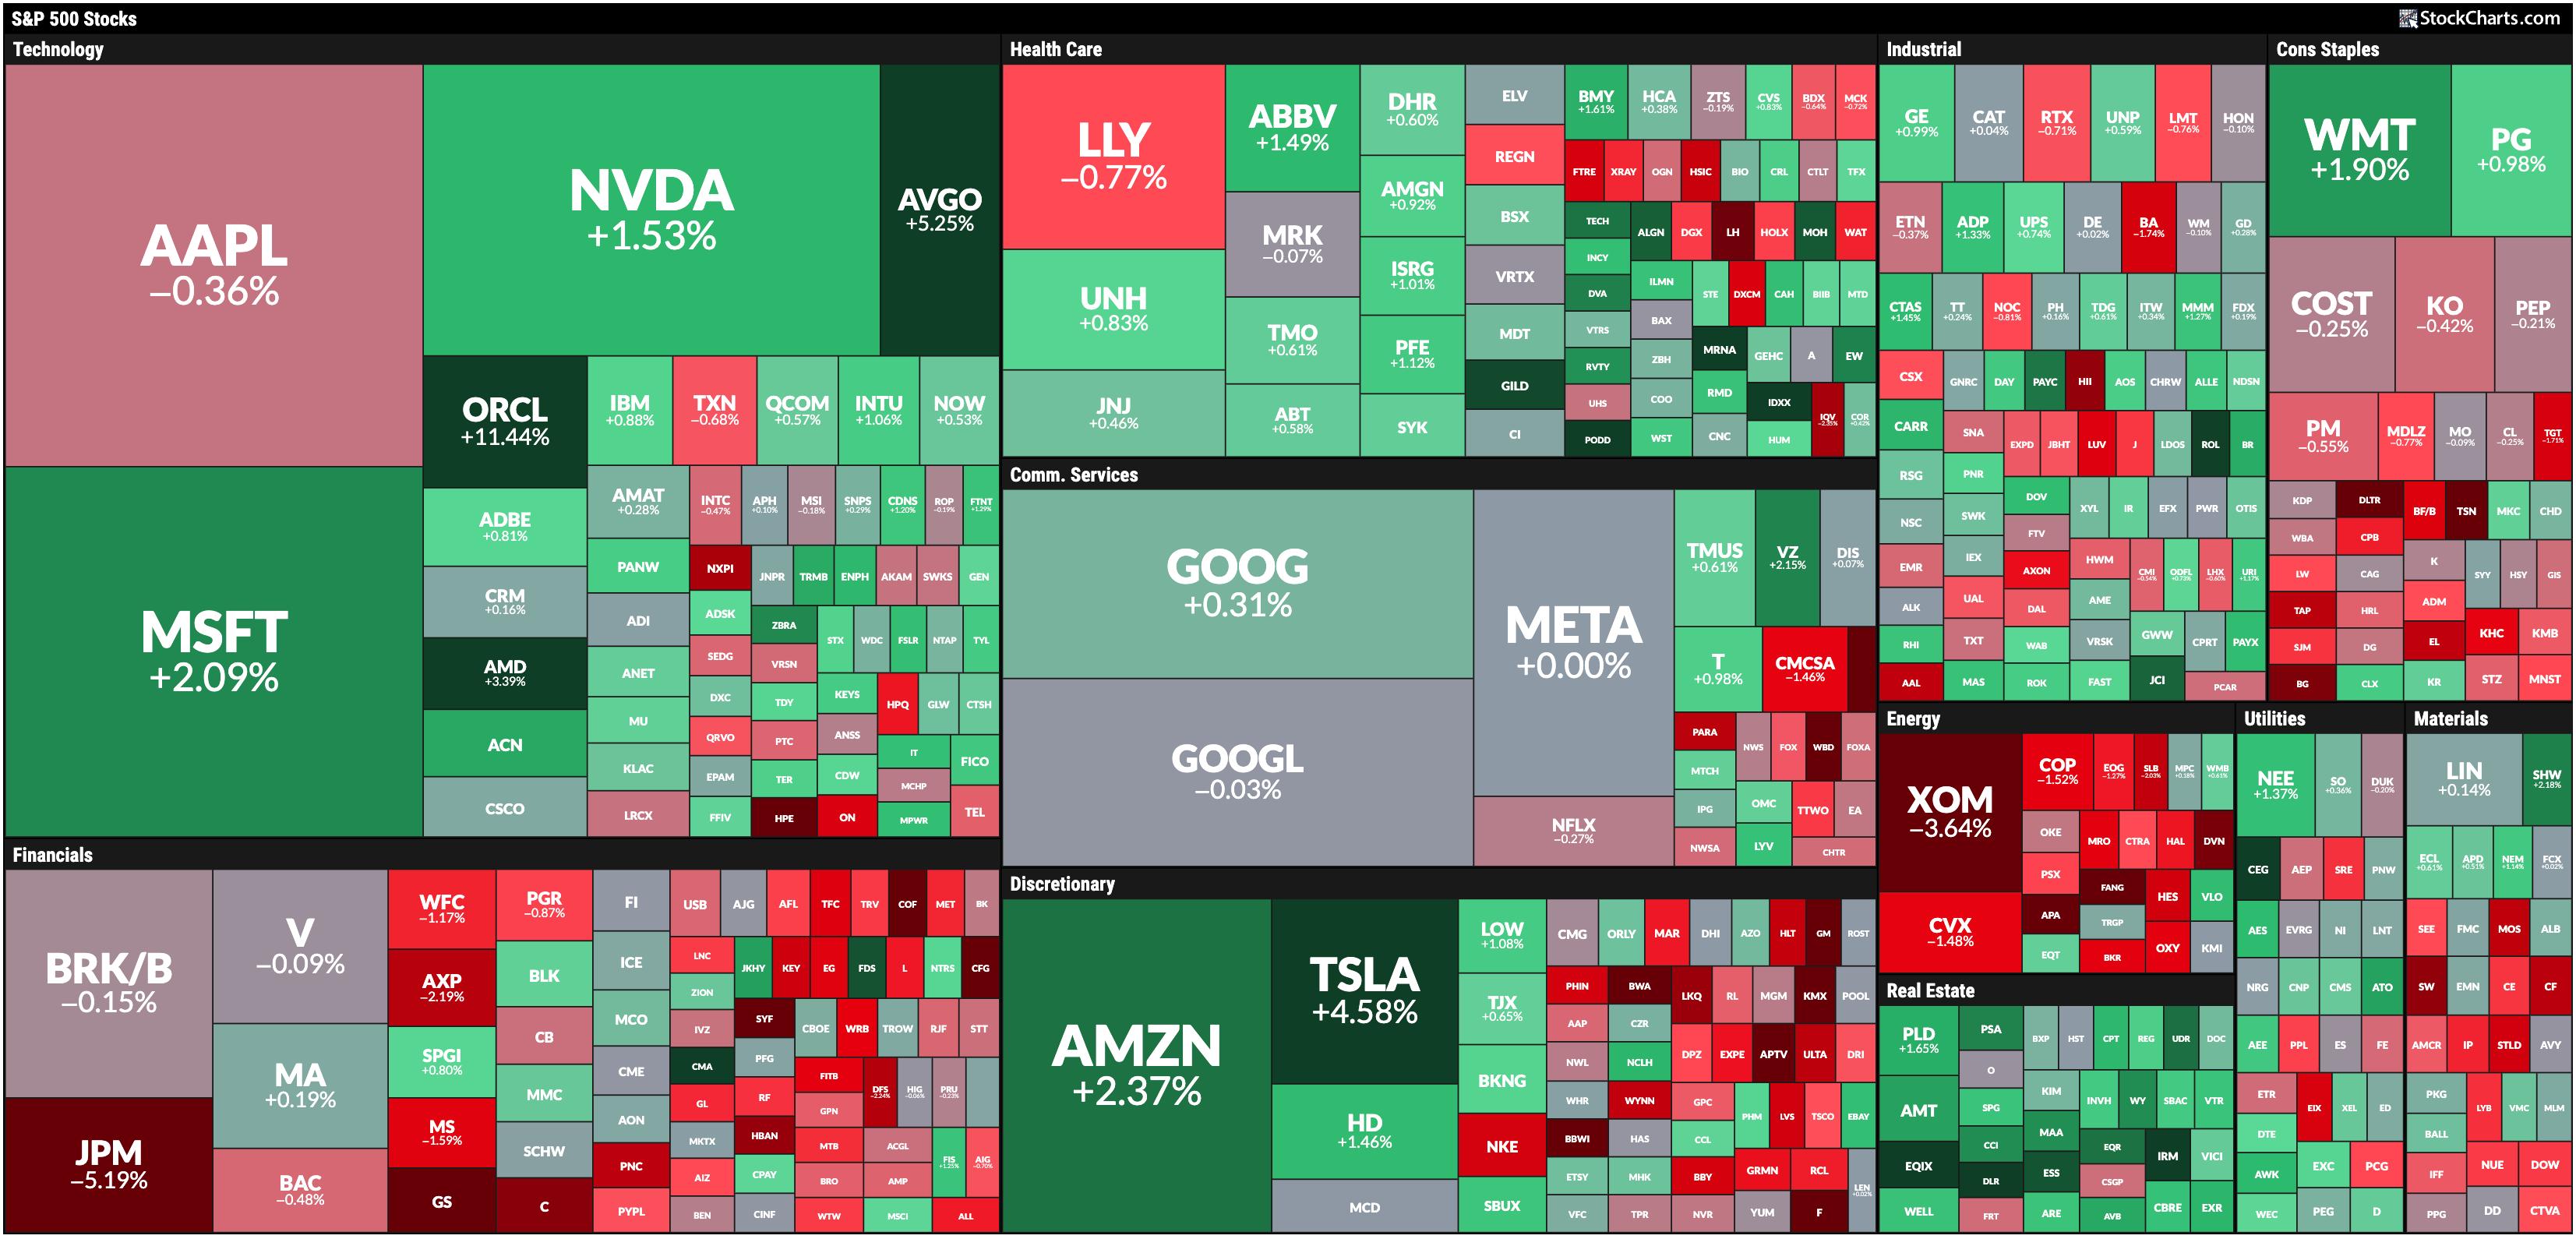
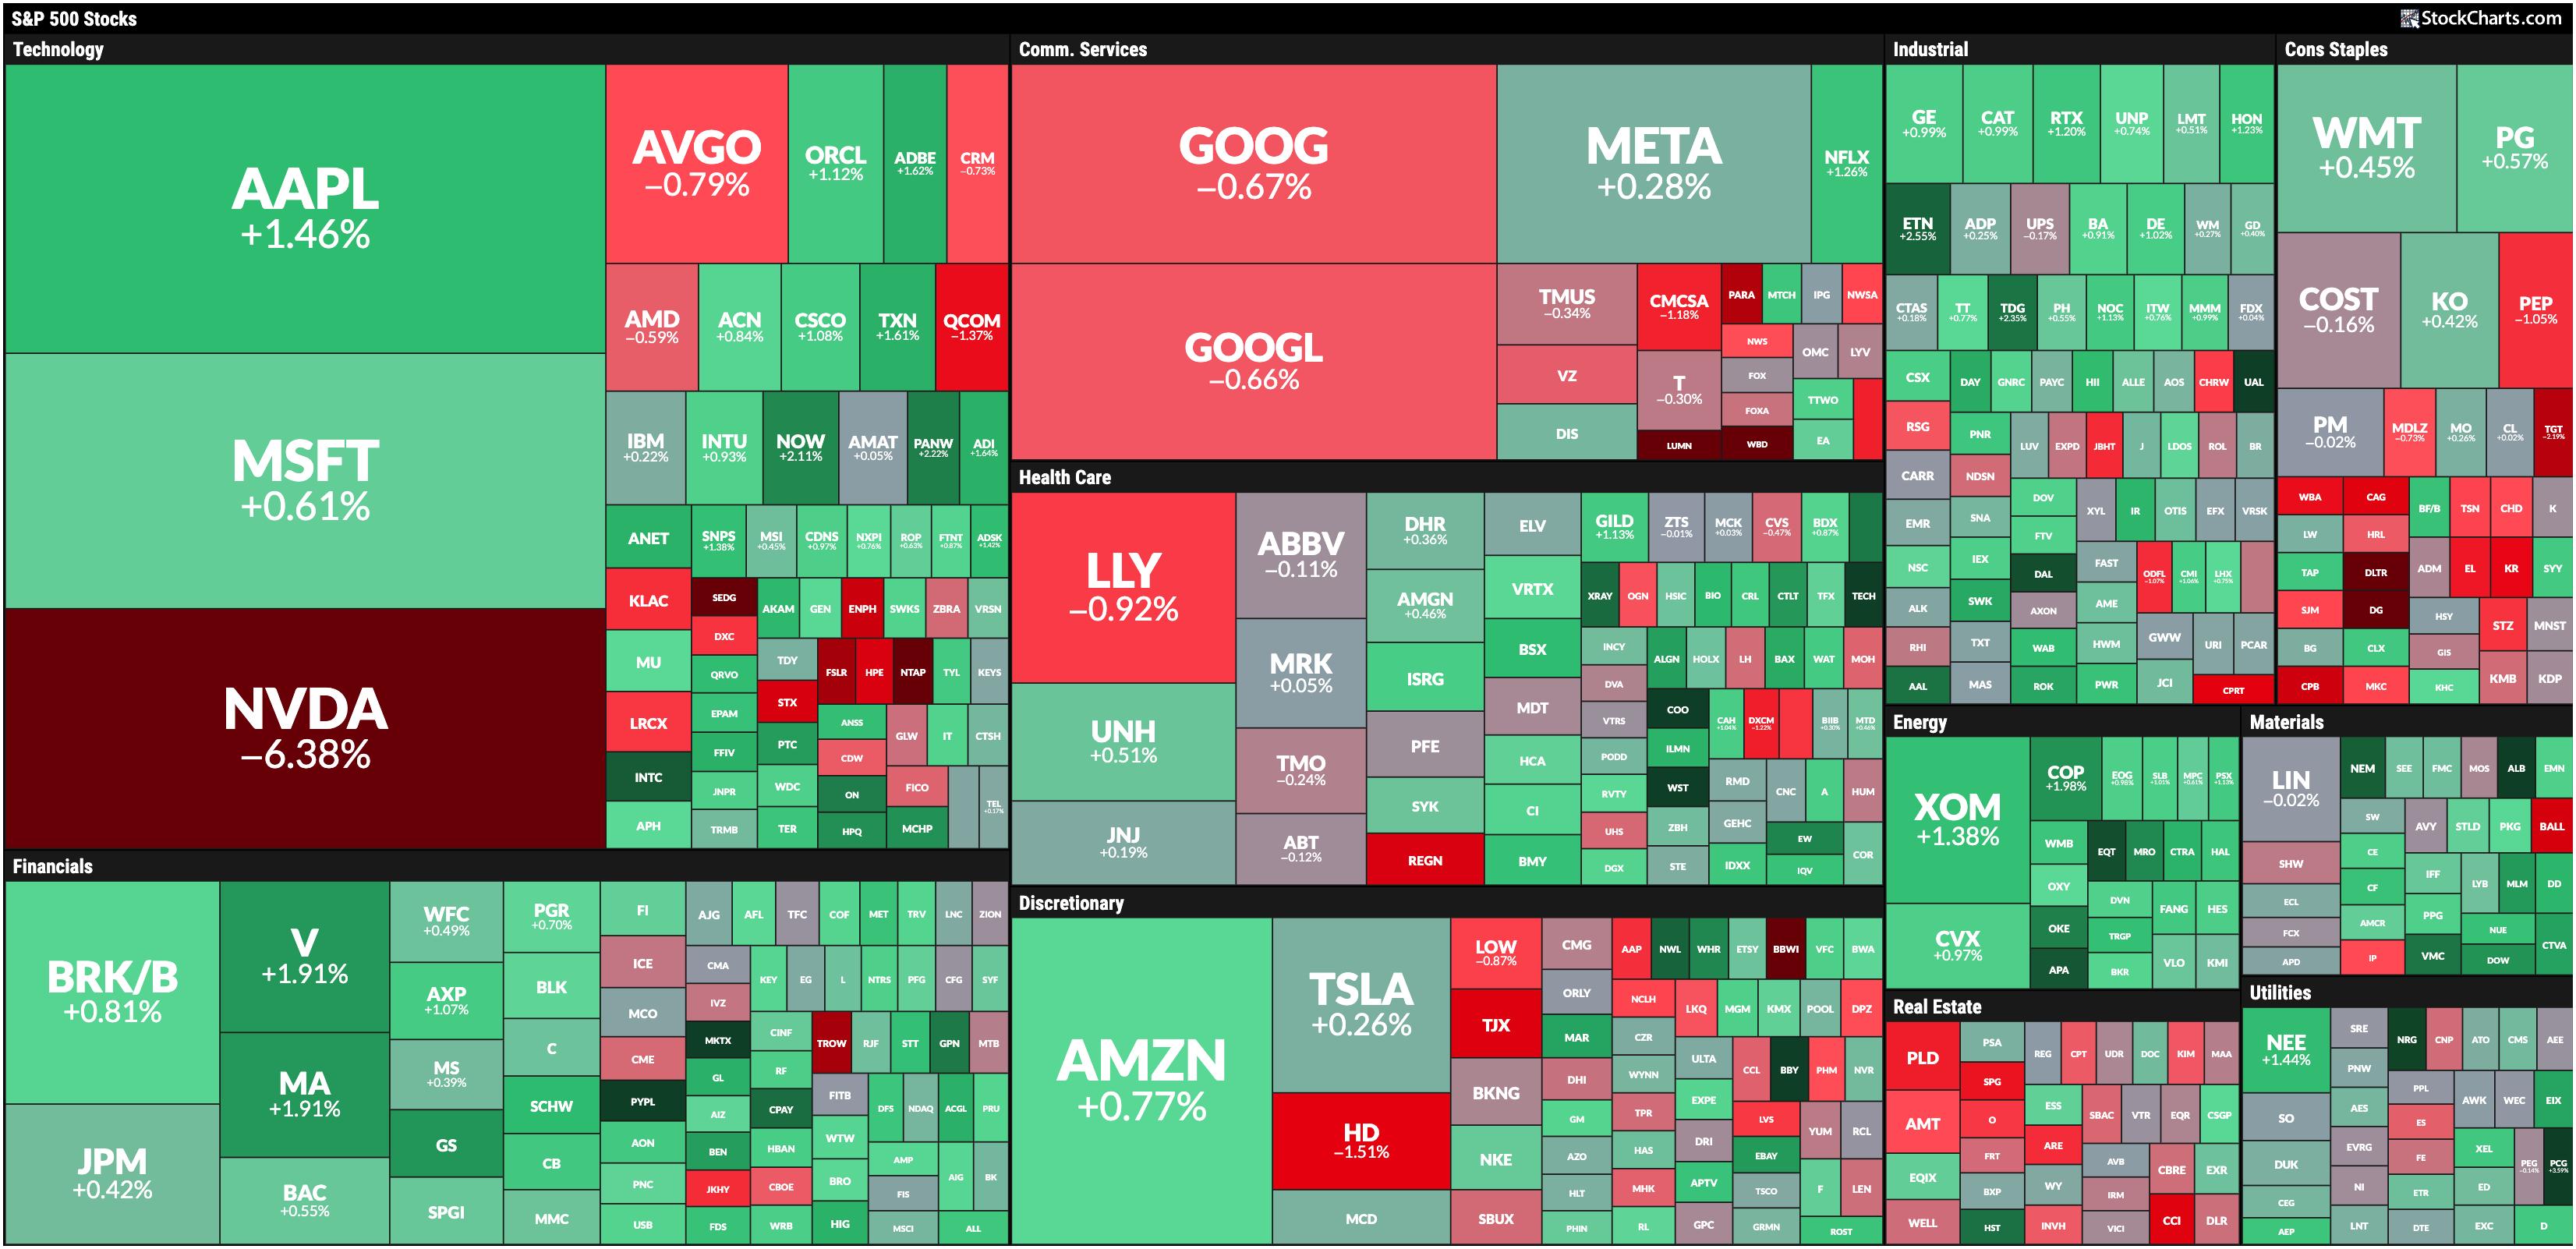
Today's MarketCarpet was a...
READ MORE
MEMBERS ONLY

Earnings Provide Another Nail in the Retail Coffin
by David Keller,
President and Chief Strategist, Sierra Alpha Research
In this edition of StockCharts TV'sThe Final Bar, Dave recaps a brutal day for retailers as ANF, FL, and BBWI drop on earnings misses. He also highlights the bullish primary trend for hold, shares two breakout names in the consumer staples sector, and breaks down key names in...
READ MORE
MEMBERS ONLY
4 MACD Patterns That Will Give You an Edge
by Joe Rabil,
President, Rabil Stock Research
In this exclusive StockCharts TV video, Joe shares four MACD patterns that he focuses on - Pinch, Reverse Divergence, Divergence, and Zero Line Reversal. These signals will help to improve the timing of your trades. He then shares which sectors are showing relative improvement vs the S&P 500,...
READ MORE
MEMBERS ONLY

Weak September Rotation - What Does it Mean for Sectors?
by Julius de Kempenaer,
Senior Technical Analyst, StockCharts.com
In this video from StockCharts TV,Julius addresses the expected sector rotation for the upcoming month of September which is traditionally the weakest month of the year. But what does it mean for sectors and how are current sector rotations shaping up on the Relative Rotation Graphs? Breaking down the...
READ MORE
MEMBERS ONLY

Three Technology Stocks in Make or Break Scenarios
by David Keller,
President and Chief Strategist, Sierra Alpha Research
In this edition of StockCharts TV'sThe Final Bar, Dave focuses in on three key charts to watch in the technology sector as investors anxiously await NVDA earnings and Friday's inflation data. He also shares two important charts for tracking improving market breadth conditions and highlights the...
READ MORE
MEMBERS ONLY
Stock Market Today: Two Sectors That Can Make Sizable Moves
by Jayanthi Gopalakrishnan,
Director of Site Content, StockCharts.com
KEY TAKEAWAYS
* Financial and Technology sectors were the leaders.
* With NVDA reporting earnings, tech stocks, especially semiconductors, could steal the spotlight again.
* With interest rate cuts on the horizon, financial stocks could see increased momentum.
Have you ever been in a plane that keeps circling around, waiting to land? That&...
READ MORE