MEMBERS ONLY

RISING YIELDS, THE YIELD CURVE, BANKING STOCKS, KEY LEVELS FOR BREADTH, HOUSING-RETAIL-SEMI ETFS CORRECT, BIOTECH ETFS HOLD GAPS, OIL EXTENDS UPTREND, GOLD FLOUNDERS, AIRLINES CORRECT, STOCKS OF INTEREST

by John Murphy,
Chief Technical Analyst, StockCharts.com
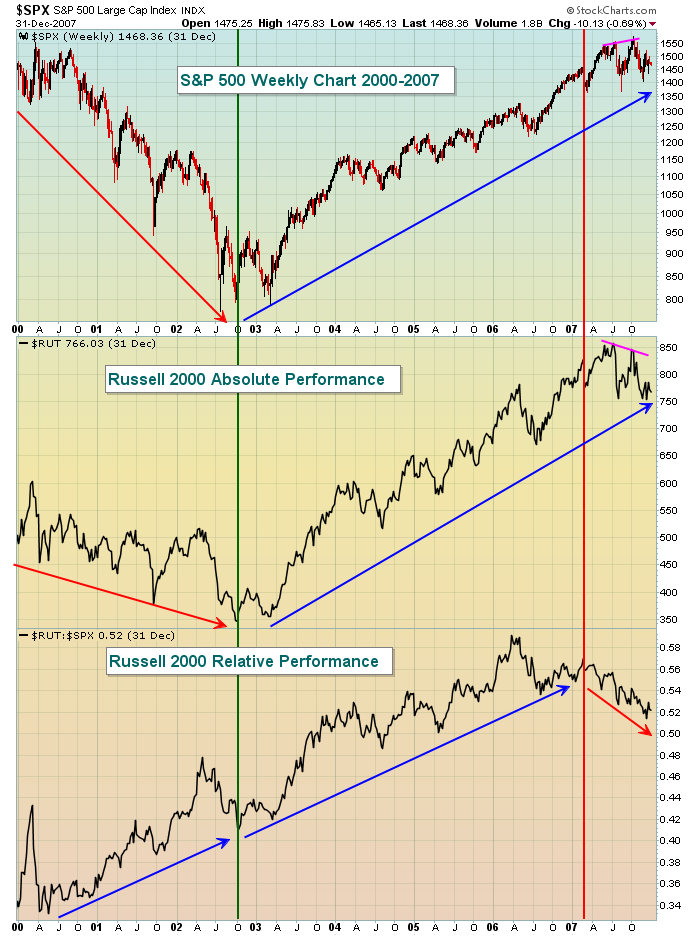
THE KEY LINES IN THE SAND... There are certainly some concerns in the stock market right now, but I have yet to get a bearish signal to confirm these concerns. The bond market imploded over the last few weeks, long-term Treasury yields surged, small-caps have been lagging since early April...
READ MORE
MEMBERS ONLY

5 Easy Steps to Trading Smarter

by Tom Bowley,
Chief Market Strategist, EarningsBeats.com
The best stock traders on the planet share one common ingredient. They manage risk. Managing risk can mean lots of things. You can manage risk by trading Exchange Traded Funds (ETFs) instead of individual stocks. This will help to eliminate, or significantly reduce, specific stock risk. If you don'...
READ MORE
MEMBERS ONLY
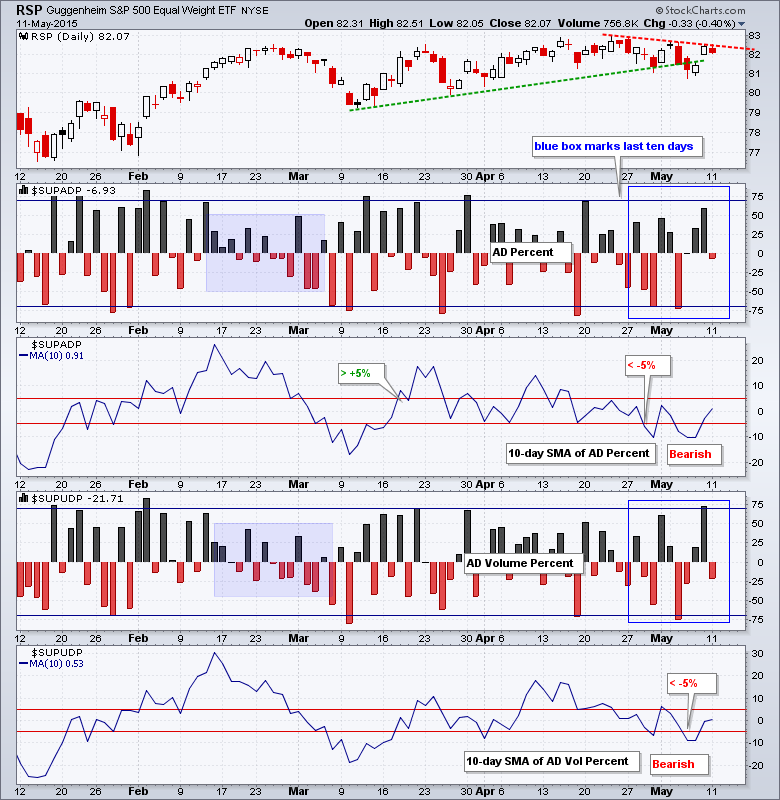
Short-Term Trend Analysis 12-May-15

by Arthur Hill,
Chief Technical Strategist, TrendInvestorPro.com
The S&P 500 surged on Friday morning, traded flat the rest of the day and then worked its way lower on Monday. The overall loss (.50%) was modest and this could be just a correction after the Friday surge. The sectors were mostly lower with energy leading the...
READ MORE
MEMBERS ONLY

Announcing the NEW DecisionPoint Alert Blog!

by Erin Swenlin,
Vice President, DecisionPoint.com
Back by popular demand and reinvented, the DP Daily Market Updates will return in theNEW "DecisionPoint Alert Blog". The free "DecisionPoint" Blog will continue as before with feature articles by both me and Carl. The new content-rich "DecisionPoint Alert" blog will only be available...
READ MORE
MEMBERS ONLY

Getting some Basic Wyckoff Terminology Under our Belts

by Bruce Fraser,
Industry-leading "Wyckoffian"
The stock market is a mystery. Sometimes it makes sense and it seems rational, such as when stock prices rise with expanding earnings growth and general business conditions. And conversely when stock prices typically fall with declining earnings and sales growth. At other times the stock market does not make...
READ MORE
MEMBERS ONLY
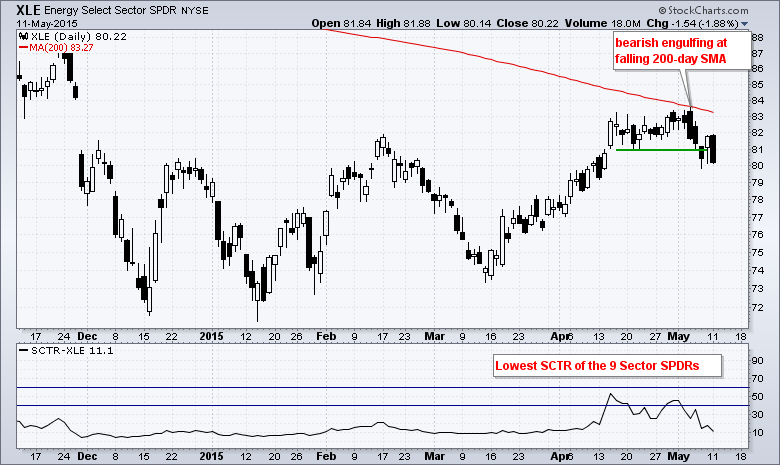
Energy SPDR Fails at Long-term Moving Average
by Arthur Hill,
Chief Technical Strategist, TrendInvestorPro.com
The Energy SPDR (XLE) is in a long-term downtrend and it looks like the short-term uptrend reversed over the last few days. The chart below shows XLE failing at the falling 200-day moving average with a bearish engulfing last week and breaking below short-term support at 81. The ETF bounced...
READ MORE
MEMBERS ONLY

Will the Giant Trading Range for the Emerging Markets ETF be Resolved on the Upside or Downside?

by Martin Pring,
President, Pring Research
* China, Taiwan and South Korea digesting gains following upside breakouts.
* India, Russia, and Brazil face technical challenges.
* The counter-cyclical commodity rally may well be over.
Emerging Markets
The MSCI Emerging Markets ETF, the EEM, has been in a large trading range during the last few years, as you can see...
READ MORE
MEMBERS ONLY

LARGE AND GROWTH LEAD, DIA CHALLENGES HIGHS, IWM BOUNCES, SMALL-CAP BREADTH LAGS, TAIL VERSUS DOG, DEFENSE-AEROSPACE ETFS HIT SUPPORT, FOUR DEFENSE STOCKS
by John Murphy,
Chief Technical Analyst, StockCharts.com
LARGE-CAPS AND GROWTH SHOW RELATIVE STRENGTH... Link for today's video. Stocks surged on Friday, but small-caps and mid-caps lagged with smaller gains. In fact, looking at one-month performance for several major index ETFs, we can see that large-caps are leading and small-caps are lagging. Chart 1 shows a...
READ MORE
MEMBERS ONLY
Stocks Surge with Uninspiring Breadth - GLD Forms Two Flags
by Arthur Hill,
Chief Technical Strategist, TrendInvestorPro.com
Stocks surged on Friday as the S&P 500 opened around 2113 and closed around 2116. Even though the index held the opening surge, there was not much movement after the surge (+3 points). The major index ETFs closed higher, but small-caps and mid-caps lagged. MDY and IWM were...
READ MORE
MEMBERS ONLY
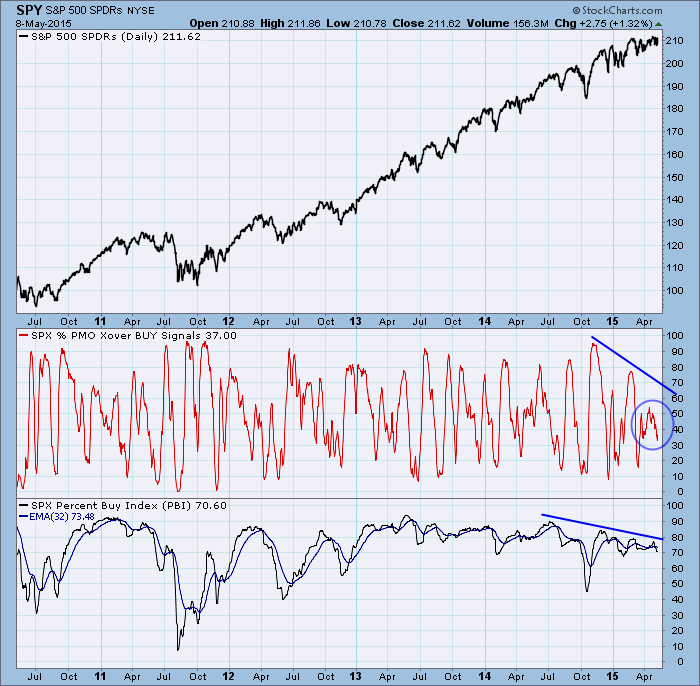
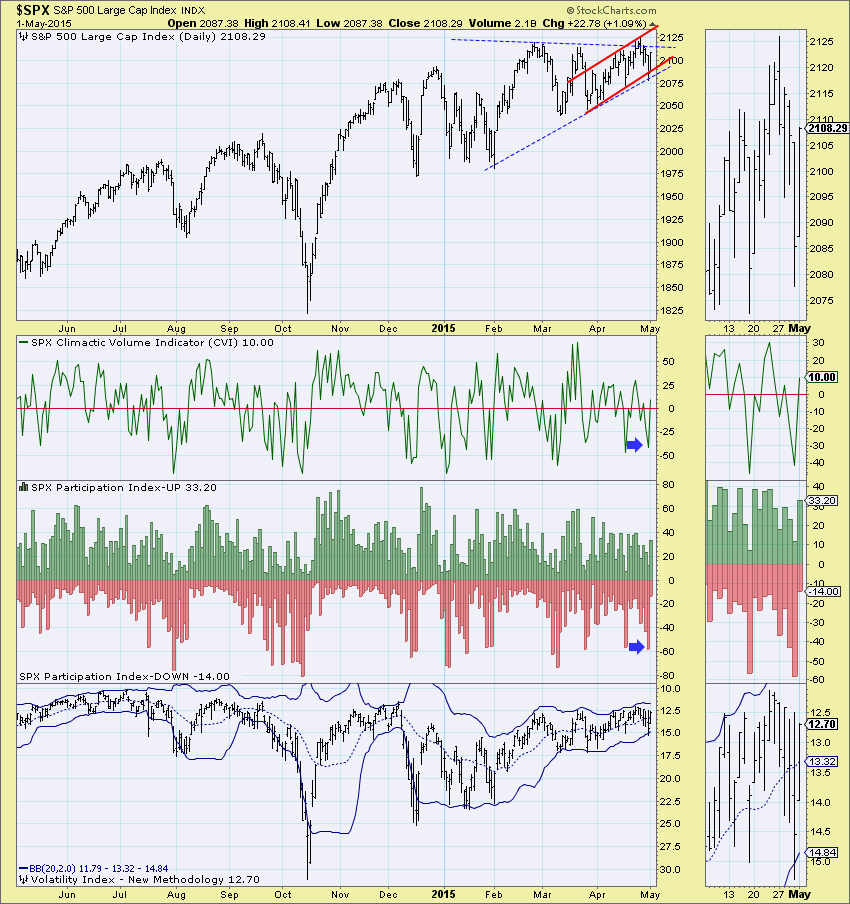
Short-Term Signal Aggregate Flashing Strong Warning

by Carl Swenlin,
President and Founder, DecisionPoint.com
One of the charts we like to review from time to time is the Mechanical Signal Analysis chart. It shows the percentage of S&P 500 stocks on PMO crossover BUY signals (short-term), and the Percent Buy Index (PBI), which shows the percentage of S&P 500 stocks...
READ MORE
MEMBERS ONLY

LATE WEEK STOCK RALLY IS BASED ON MORE THAN A JOBS REPORT -- SPIKE IN BOND YIELDS PEAKED ON THURSDAY WHICH BOOSTED DIVIDEND ISHARES -- THE DJ COMPOSITE AVERAGE BOUNCES OFF 200-DAY AVERAGE -- BRITISH MARKETS BOUNCE ON ELECTION RESULTS
by John Murphy,
Chief Technical Analyst, StockCharts.com
10-YEAR TREASURY YIELD BACK BELOW 200-DAY AVERAGE... The report of 223,000 jobs created in April (and a drop in the unemployment rate to 5.4%) helped spark a strong stock rally on Friday. It's not that the report was so strong. In fact, it barely met expectations....
READ MORE
MEMBERS ONLY

SLOW AND STEADY IS STILL WINNING, SMALL-CAPS AND MID-CAPS ARE NOT BROKEN, XLY SURGES OFF SUPPORT, XLF RENEWS BREAKOUT, IAI CONSOLIDATES, CLOUD-INTERNET-SOFTWARE ETFS SPORT STRONG SCTRS, XLI BREAKS TRIANGLE
by John Murphy,
Chief Technical Analyst, StockCharts.com
SLOW AND STEADY IS STILL WINNING... Link for today's video. Stocks fell back from late April to early May and and this might have been enough to turn short-term bearish, but these declines did not affect the medium-term uptrends. In fact, the S&P 500 was never...
READ MORE
MEMBERS ONLY

Investing: The Probability Tool

by Gatis Roze,
Author, "Tensile Trading"
Investing and thinking in probabilities should go hand in hand. Probabilities can be expressed both quantitatively (as a percentage from zero to one hundred percent) or qualitatively. I use both, but recently I have found myself gravitating more to qualitative assessments and descriptions.
Determining the precise probability of any particular...
READ MORE
MEMBERS ONLY
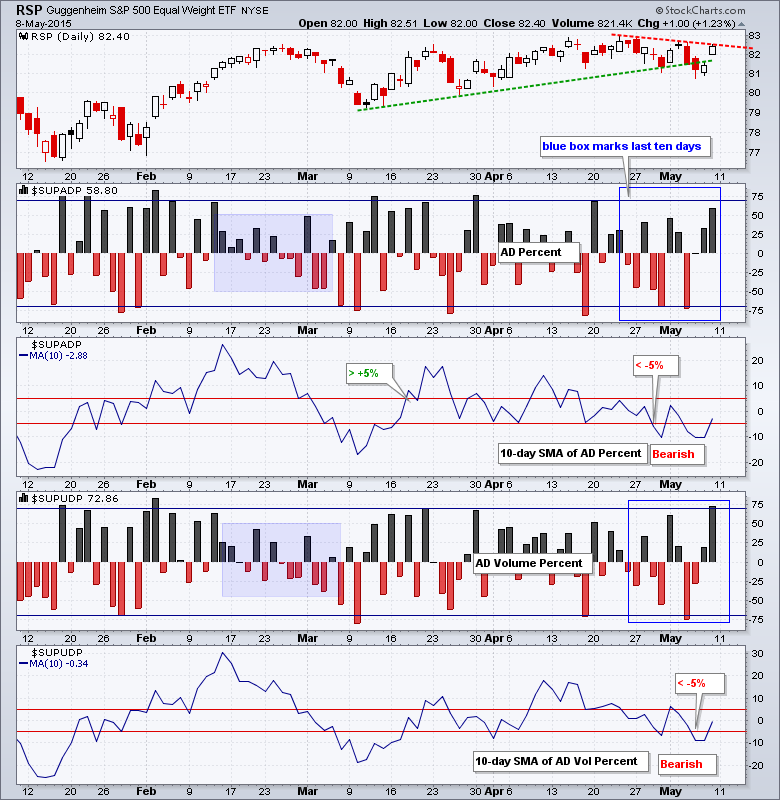
Short-Term Trend Analysis 08-May-15
by Arthur Hill,
Chief Technical Strategist, TrendInvestorPro.com
Stocks bounced and the major index ETFs closed modestly higher. Eight of the nine sector SPDRs were up. Energy fell because oil was down sharply. The decline in oil boosted the Airline ETF (JETS) and this helped the Transport iShares (IYT) to a 1.11% gain. Commodities were down pretty...
READ MORE
MEMBERS ONLY

SELLOFF IN ENERGY SHARES MAY SUGGEST OIL PEAK -- THAT'S HELPING AIRLINES AND TRANPORTS -- 10-YEAR BOND YIELD BACKS OFF FROM MARCH HIGH -- THAT'S HELPING RATE-SENSITIVE REITS
by John Murphy,
Chief Technical Analyst, StockCharts.com
ENERGY STOCKS BACK OFF FROM 200-DAY AVERAGE... While stocks in general are rebounding from yesterday's selloff, some interesting rotations are going on beneath the surface. One of the has to do with a pullback in energy shares and the price of crude. Energy stocks are the day'...
READ MORE
MEMBERS ONLY
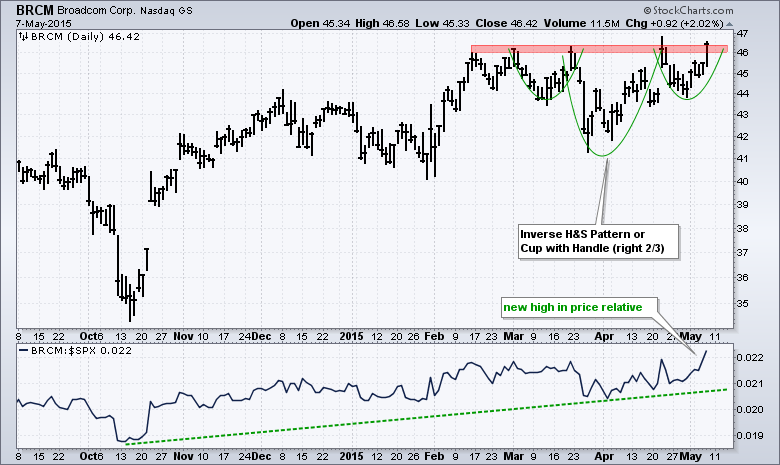
BroadCom Forms Bullish Continuation Pattern
by Arthur Hill,
Chief Technical Strategist, TrendInvestorPro.com
It has been a rough month for stocks overall, but Broadcom (BRCM) is bucking the selling pressure and challenging resistance. There are two bullish continuation patterns possible on this chart. First, an inverse head-and-shoulders pattern extends back to early March. Second, the right two-thirds of the pattern looks like a...
READ MORE
MEMBERS ONLY
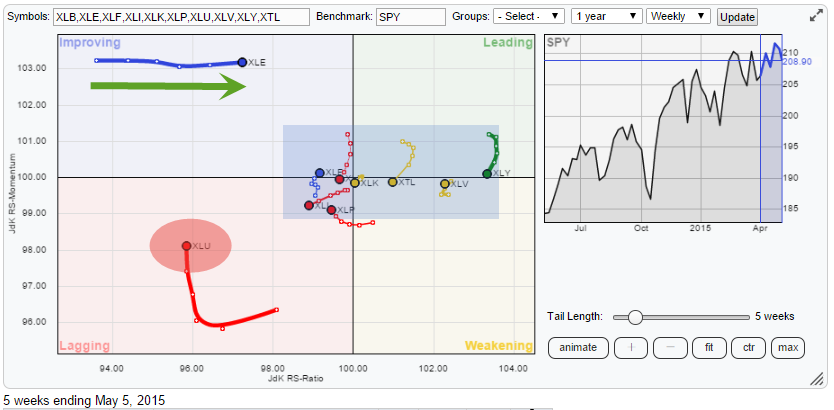
Weak industrials (XLI) vs. strong(er) energy (XLE)

by Julius de Kempenaer,
Senior Technical Analyst, StockCharts.com
Sector time!
With the general market picture being a bit 'un-clear' and showing pretty wide swings from week to week, the Relative Rotation Graph holding the ten (I added XTL - Telecom) sector ETFs will shine some light on the sector rotation that is going on within the...
READ MORE
MEMBERS ONLY
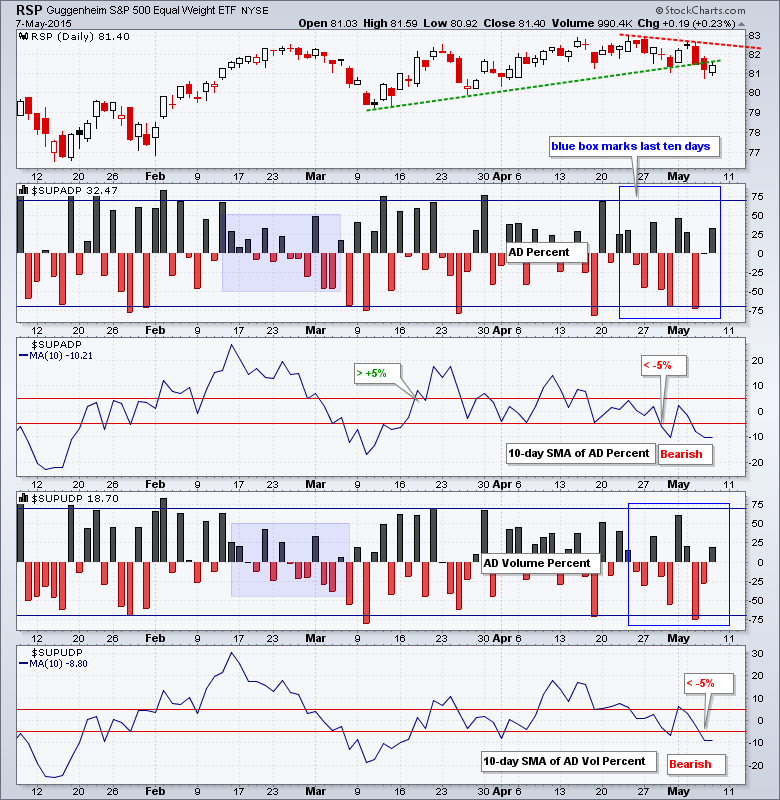
Short-Term Trend Analysis 07-May-15
by Arthur Hill,
Chief Technical Strategist, TrendInvestorPro.com
Stocks closed lower again on Wednesday, but a late afternoon bounce pushed the major index ETFs off their lows. IWM and MDY actually closed with small gains as small and mid-caps held up well on Wednesday. QQQ and SPY closed fractionally lower. The Equal-Weight Consumer Discretionary ETF (RCD) led the...
READ MORE
MEMBERS ONLY
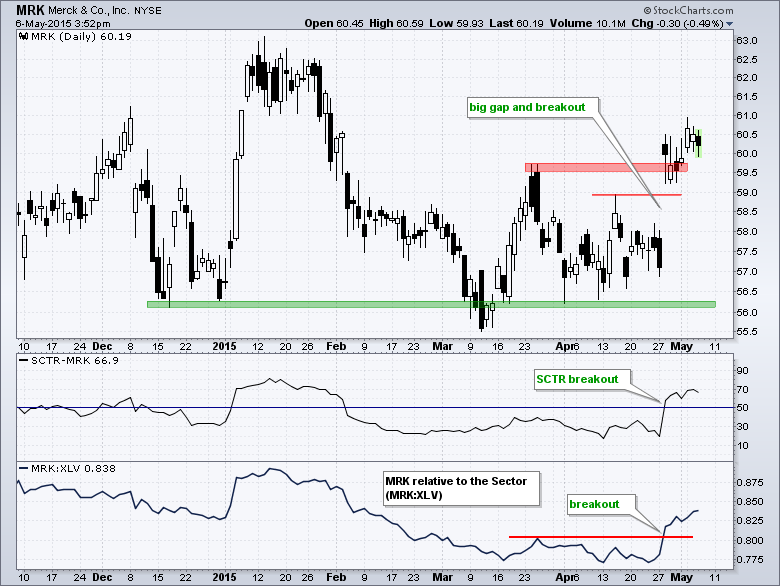
Merck Holds Up and Outperforms its Sector
by Arthur Hill,
Chief Technical Strategist, TrendInvestorPro.com
Stocks have been under pressure the last eight days with the S&P 500 SPDR (SPY) down around 2% from its late April high and the HealthCare SPDR (XLV) down around 4% from this high. At times like this, it is good to look around and see what is...
READ MORE
MEMBERS ONLY

STOCK MARKET CONTINUES TO RETREAT -- A LOT OF SHORT-TERM SUPPORTS ARE BEING BROKEN -- FALLING APPLE HURTS NASDAQ -- BOND ETFS FALL BELOW 200-DAY AVERAGES -- SO DO UTILITIES
by John Murphy,
Chief Technical Analyst, StockCharts.com
MAJOR STOCK AVERAGES BREAK 50-DAY LINES... Stock selling that started yesterday has spilled over to today as the market's short-term trend continues to weaken. Trading volume over the last week has also taken on a negative pattern, with heavier trading on down days and lighter volume on bounces....
READ MORE
MEMBERS ONLY
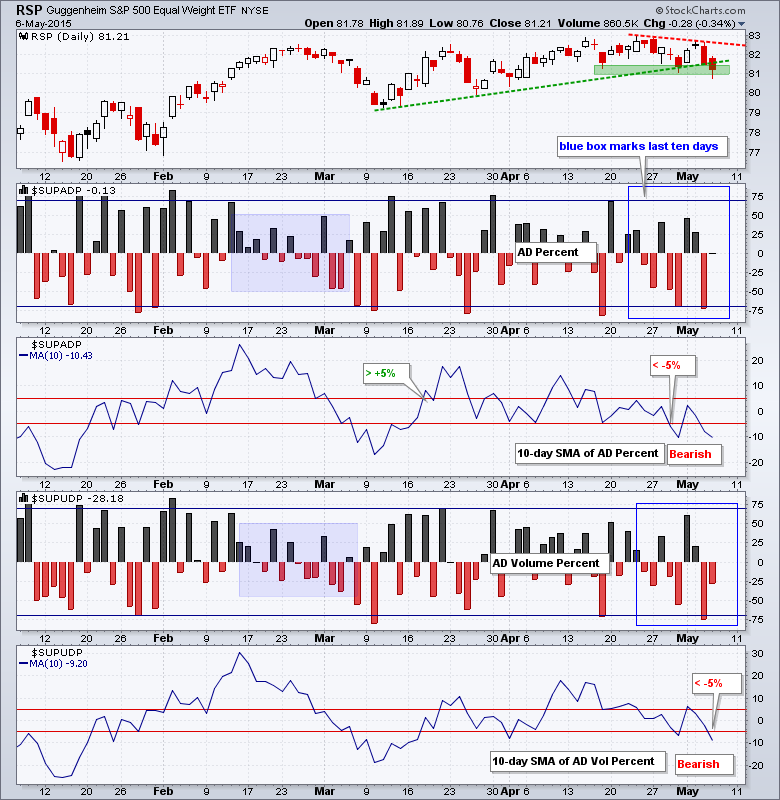
Short-Term Trend Analysis 06-May-15
by Arthur Hill,
Chief Technical Strategist, TrendInvestorPro.com
Stocks were hit with broad selling pressure on Tuesday with the Nasdaq 100 ETF (QQQ) leading the major index ETFs lower. All sectors were down with utilities getting hammered. Looks like XLU finally caught on to the rise in rates and followed the REIT iShares (IYR) lower. Techs were hit...
READ MORE
MEMBERS ONLY
DP Market Update: All-Time Highs Prove Difficult to Achieve - May 5, 2015
by Erin Swenlin,
Vice President, DecisionPoint.com
Price snapped back toward the Friday low today. It appeared at the end of the day it might break out from the descending wedge. It's a bullish formation so that is the expectation. A wedge tells us the direction to expect a move. Unfortunately, it doesn't...
READ MORE
MEMBERS ONLY

Will Last Month's NYSE Breakout Hold?
by Martin Pring,
President, Pring Research
* McClellan Summation gives a sell for the Wilshire 5000.
* Bond confidence ratios turn positive.
* Inflation ratios break to the upside. Trick or treat?
* Bonds complete a head and shoulders top.
US Equities
The NYSE Composite ($NYA) has been doing its best to break to the upside but continues to vacillate...
READ MORE
MEMBERS ONLY
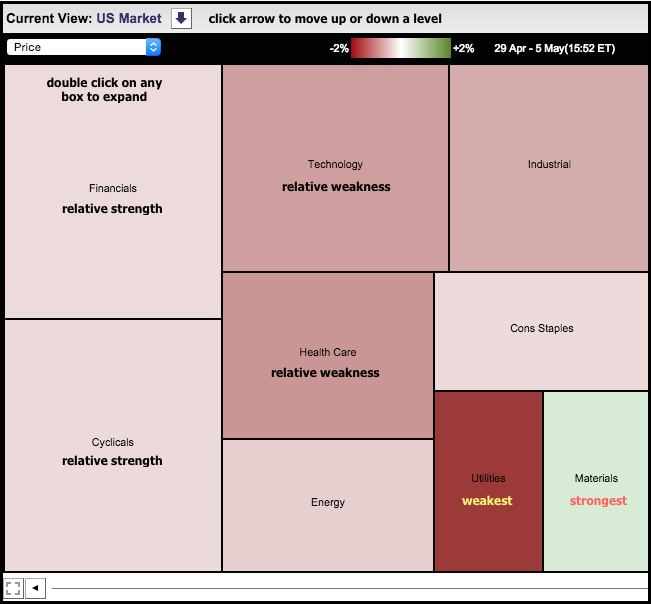
A Rough Ride for Utilities
by Arthur Hill,
Chief Technical Strategist, TrendInvestorPro.com
The chart below shows the Sector MarketCarpet over the last five days (29-Apr to 5-May) and utility stocks are the weakest. The average stock in the sector is down over 2% during this timeframe, which is why the box is dark red. Healthcare and technology stocks also came under selling...
READ MORE
MEMBERS ONLY

STOCKS AND TREASURIES DIVERGE, KEY GROUPS AND BREADTH WEAKENING, FINANCE HOLDS STRONG, MATERIALS START TO LEAD, ENERGY ETFS EXTEND UPTRENDS, COPPER AND ALUMINUM LEAD BASE METALS, USING THE CHANDELIER EXIT
by John Murphy,
Chief Technical Analyst, StockCharts.com
WEBINAR ... Stocks came under selling pressure on Tuesday with techs and small-caps leading the way lower. The overall picture for stocks remains largely unchanged. The major index ETFs are in slow and steady uptrends this year, but we are seeing some weakness in a few key groups and some breadth...
READ MORE
MEMBERS ONLY
How Do Stock Market Tops Form? Part 7 (Final)
by Tom Bowley,
Chief Market Strategist, EarningsBeats.com
This is a series of articles designed to remind each of us the keys to identifying the many potential warning signs that create stock market tops. If you're just tuning in, you can CLICK HERE for Part 1 that begins the series. Enjoy!
This is the final part...
READ MORE
MEMBERS ONLY
Short-Term Trend Analysis 05-May-15
by Arthur Hill,
Chief Technical Strategist, TrendInvestorPro.com
Stocks closed modestly higher on Monday with the technology, healthcare and utilities sectors leading the way. It is most interesting to see utilities higher because the 10-YR Treasury Yield ($TNX) is up sharply over the last two weeks. Utilities have been negatively correlated to Treasury yields the last few months,...
READ MORE
MEMBERS ONLY

PUTTING THE BIOTECH DECLINE INTO PERSPECTIVE, GILEAD SURGES ON BIG VOLUME, MANAGING THE UPSWINGS IN OIL AND ENERGY, SEASONAL TENDENCIES FOR OIL, DOLLAR HITS SUPPORT ZONE
by John Murphy,
Chief Technical Analyst, StockCharts.com
PUTTING THE BIOTECH DECLINE INTO PERSPECTIVE... Link for today's video. It has been a rough ride for biotechs since mid March, but I am not ready to throw in the towel on the long-term uptrend. Chart 1 shows the Biotech iShares (IBB) with two sharp declines over the...
READ MORE
MEMBERS ONLY
How Do Stock Market Tops Form? Part 6
by Tom Bowley,
Chief Market Strategist, EarningsBeats.com
This is a series of articles designed to remind each of us the keys to identifying the many potential warning signs that create stock market tops. If you're just tuning in, you can CLICK HERE for Part 1 that begins the series. Enjoy!
Today, I want to delve...
READ MORE
MEMBERS ONLY
Short-Term Trend Analysis 04-May-15
by Arthur Hill,
Chief Technical Strategist, TrendInvestorPro.com
Stocks fell from Monday to Thursday and then surged on Friday with a strong open and strong close. QQQ and large-caps led the bounce, while IWM and small-caps lagged with smaller gains. The consumer discretionary, technology, industrials and materials sectors led with 1+ percent advances. The Home Construction iShares (ITB)...
READ MORE
MEMBERS ONLY
BUY, Neutral, SELL -- Trading the PMO -- What Are Trend Model Signals Good For?
by Carl Swenlin,
President and Founder, DecisionPoint.com
During our last webinar we received questions and comments to which we were unable to respond due to time constraints, so we will take this opportunity to address some of the ones deemed to have broad interest.
Q: Please review the definitions of Buy, Neutral, and Sell signals.
A: First...
READ MORE
MEMBERS ONLY
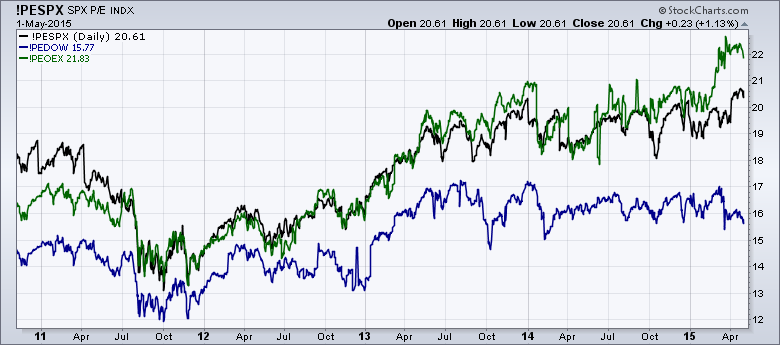
Index P/E Charts Can Show You If the Market is Too Expensive Right Now
Hello Fellow ChartWatchers!
Is the market too expensive right now? Our P/E ratios for the various market indexes can show you the answer to that question. Currently, we have P/E values for the following indexes:
* The Dow (!PEDOW)
* The S&P 500 (!PESPX)
* The S&P...
READ MORE
MEMBERS ONLY
Do Earnings Really Matter?

by John Hopkins,
President and Co-founder, EarningsBeats.com
And the answer is...You bet!
Why do earnings reports matter? Because it gives investors a quarterly snapshot of how a company is performing and what they can look forward to down the road. And when you stop to think about it, when you filter out everything else out there...
READ MORE
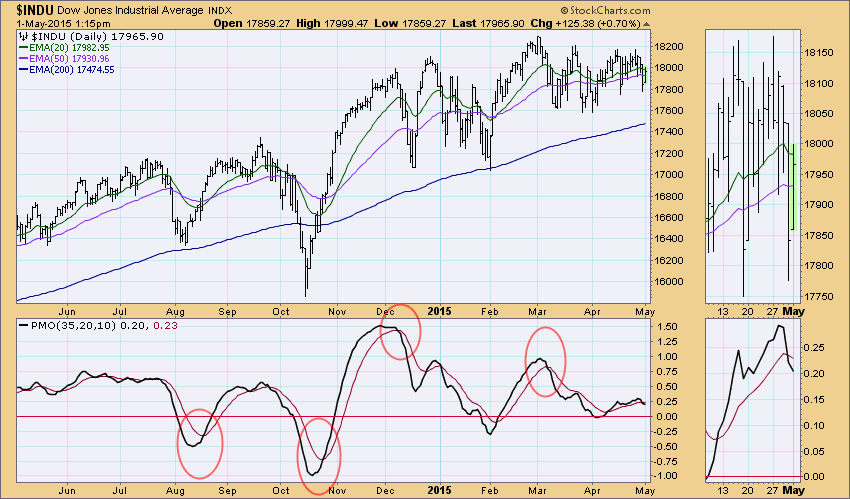
MEMBERS ONLY
Ultra-Short Term Spikes Bullish
by Erin Swenlin,
Vice President, DecisionPoint.com
Last week was not only an interesting for price, ultra-short-term indicators finally woke up. With indicators staying mostly mum this week, it was exciting to see movement in the shorter-term.
Below is a chart of our ultra-short-term indicators taken from the DP Chart Gallery (available free here). When observing our...
READ MORE
MEMBERS ONLY
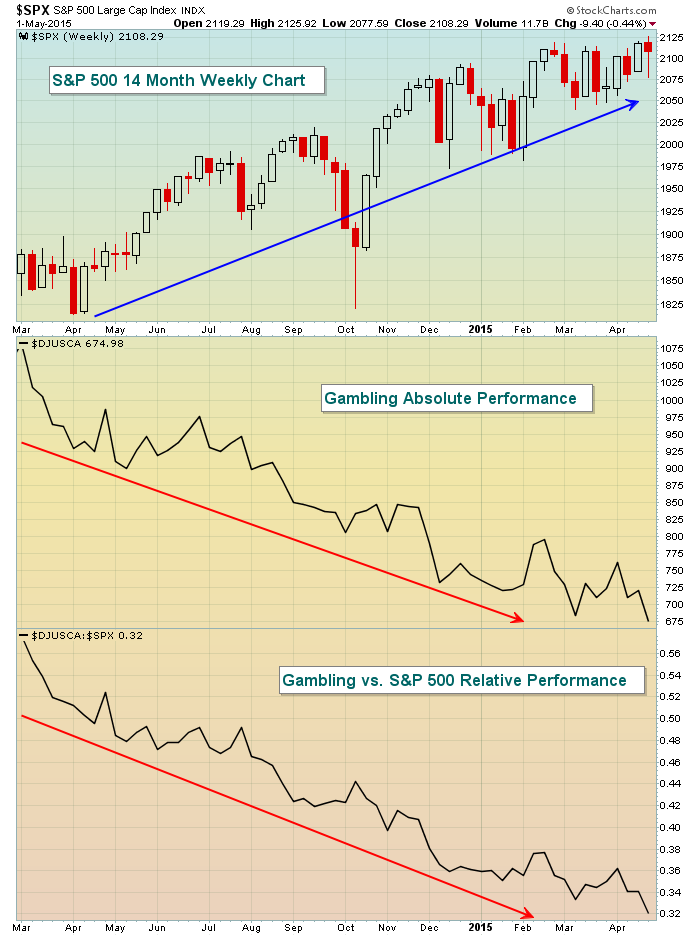
Place Your Wagers Please
by Tom Bowley,
Chief Market Strategist, EarningsBeats.com
It's Kentucky Derby Day so of course! Oops, wrong blog! :-)
We know that the stock market goes through periods of consolidation and rotation. Groups that lead for a period of time eventually fall out of favor as new groups emerge as leaders. Then we rinse and repeat....
READ MORE
MEMBERS ONLY

THIS WEEK'S JUMP IN COPPER AND BOND YIELDS MAY BE LINKED -- SO IS THE BIG JUMP IN THE GERMAN 10-YEAR BUND YIELD -- TREASURY YIELD CURVE APPEARS TO BE BOTTOMING -- RISING BOND YIELDS HELP BANKS AND INSURERS WHICH GAINED ON THE WEEK
by John Murphy,
Chief Technical Analyst, StockCharts.com
COPPER AND YIELDS ARE WEEK'S BIGGEST GAINERS ... Two of the most significant events of the past week were the sharp rally in copper and Treasury bond yields. The two may be linked. Chart 1 shows the price of copper (red line) and the 10-Year Treasury Note Yield (green...
READ MORE
MEMBERS ONLY
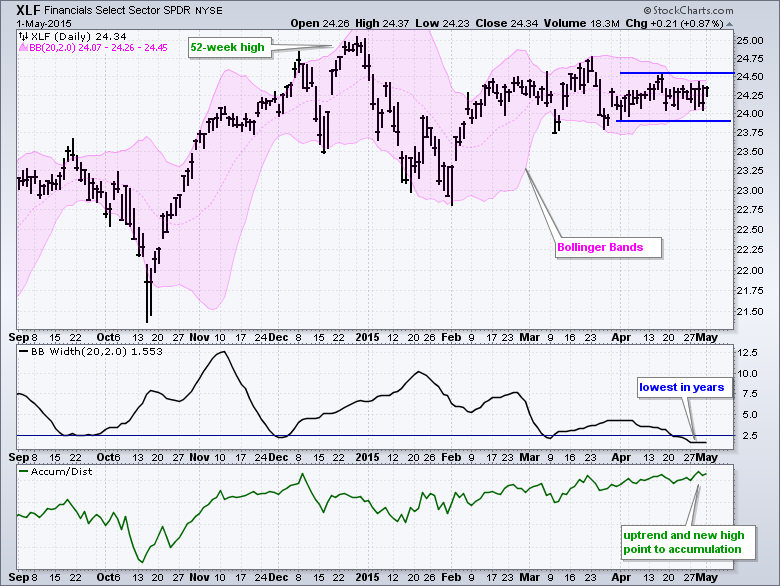
The Noose Tightens for the Finance SPDR
by Arthur Hill,
Chief Technical Strategist, TrendInvestorPro.com
The Finance SPDR (XLF) has become the most boring of the nine sector SPDRs over the last five weeks. Boring today does not mean it will be boring tomorrow though. The chart below shows the Finance SPDR (XLF) surging to new highs in December, bouncing around in January-February and then...
READ MORE
MEMBERS ONLY

SPY MAINTAINS UPTREND, BREADTH WANES, SMALL AND MID-CAP ETFS BREAK SUPPORT, QQQ IS STILL THE LEADER, A BIG WEEK FOR MATERIALS, TECH AND CONSUMER DISCRETIONARY HOLD STRONG, NOOSE TIGHTENS FOR FINANCE AND INDUSTRIALS
by John Murphy,
Chief Technical Analyst, StockCharts.com
SPY MAINTAINS UPTREND, BUT BREADTH WANES ... Link for today's video. There are clearly some signs of underlying weakness in the stock market and this could foreshadow a correction over the coming weeks. Today's market message will start with four major index ETFs. We will look at...
READ MORE
MEMBERS ONLY
How Do Stock Market Tops Form? Part 5
by Tom Bowley,
Chief Market Strategist, EarningsBeats.com
Today marks two months for me here at StockCharts.com and I just want to thank everyone for your kind words and especially for all of the technical feedback. Your comments are very important to me so please keep them coming. Writing and teaching about the stock market is what...
READ MORE
MEMBERS ONLY

This is What Made a Top Hedge Manager So Successful
by Gatis Roze,
Author, "Tensile Trading"
I just read The Buy Side, Turney Duff’s book about his years as the biggest and most successful healthcare hedge fund manager on Wall Street. Let me say up front that I am not reviewing or endorsing the book or its content in any manner. In fact, I’m...
READ MORE
