MEMBERS ONLY
Short-Term Trend Analysis 01-May-15

by Arthur Hill,
Chief Technical Strategist, TrendInvestorPro.com
Stocks started the day weak and finished weak. The S&P 500 plunged below 2095 on the open, chopped around and then dipped below 2090 in the afternoon. Small-caps led the way lower as IWM lost over 2%. All sectors were down with healthcare and technology leading the way....
READ MORE
MEMBERS ONLY
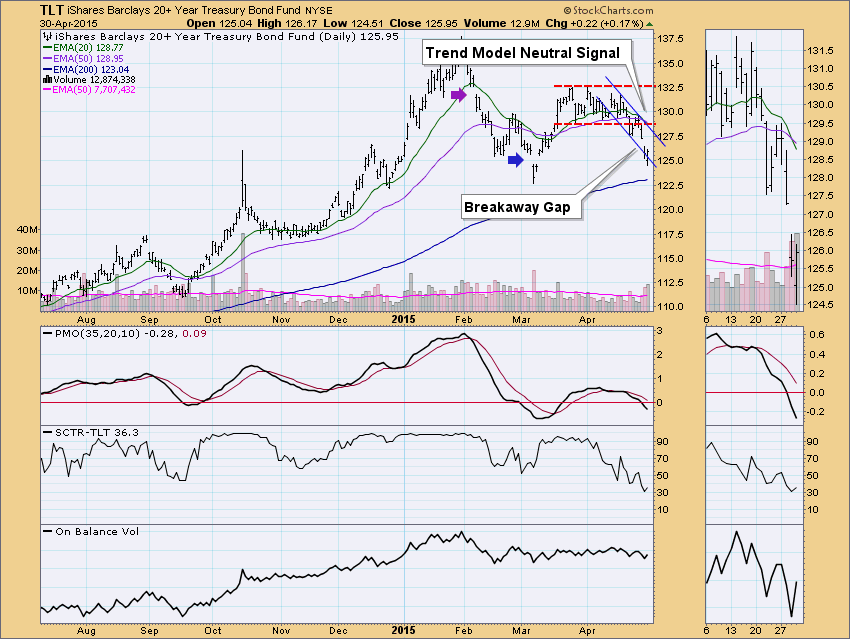
Bonds (TLT) Generate Trend Model Neutral Signal on Breakaway Gap

by Erin Swenlin,
Vice President, DecisionPoint.com
Yesterday an Intermediate-Term Trend Model Neutral signal was generated on TLT, the ETF we use to calculate our official Trend Model signal. This combined with a breakdown from the congestion zone and a what appears to be a breakaway gap tells us there is likely more downside to come for...
READ MORE
MEMBERS ONLY
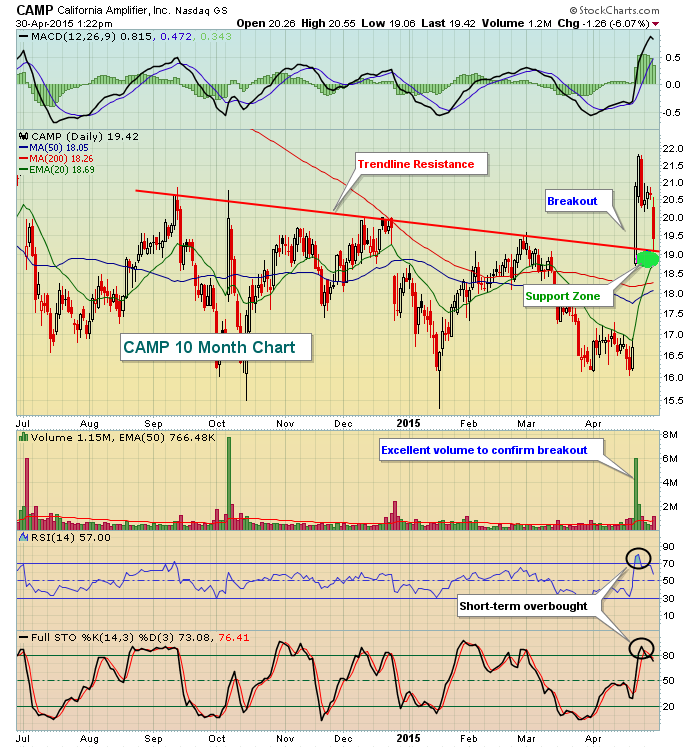
California Amplifier (CAMP) Retests Key Support Zone

by Tom Bowley,
Chief Market Strategist, EarningsBeats.com
A little more than a week ago, CAMP broke trendline resistance after posting better than expected earnings results. CAMP's top line was $69.2 mil (actual) vs. $68.0 (estimate), while its bottom line also beat Wall Street estimates, $.29 vs. $.25. The breakout occurred on huge volume...
READ MORE
MEMBERS ONLY

BOND YIELDS CONTINUE TO RISE AS BOND PRICES FALL -- THAT'S HURTING BOND PROXIES LIKE REITS AND UTILITIES -- RISING RATES PUSH GOLD SHARPLY LOWER -- RISING OIL PRICES ARE HURTING TRANSPORTS -- SMALL STOCKS BREAK 50-DAY AVERAGE

by John Murphy,
Chief Technical Analyst, StockCharts.com
BOND YIELDS CONTINUE TO MOVE HIGHER... After jumping sharply yesterday, Treasury bond yields are climbing again today. [Yesterday's jump followed big gains in Eurozone bond yields]. Chart 1 shows the 10-Year Treasury Note yield trading at the highest level since mid-March. The jump in bond yields is obviously...
READ MORE
MEMBERS ONLY

Shampooing the Market

by Greg Morris,
Veteran Technical Analyst, Investor, and Author
It seems that technical analysts on many of the electronic boards I view occasionally want to be the first to say, “I see a head and shoulders pattern in XYZ.” All too often when I look at their prognostication, I see that it often does not come close to a...
READ MORE
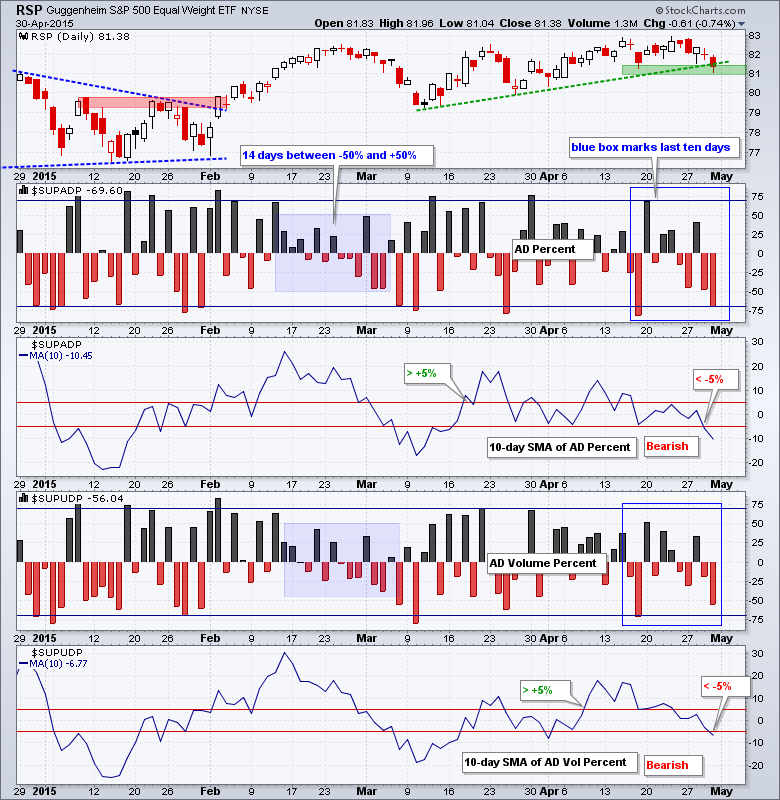
MEMBERS ONLY
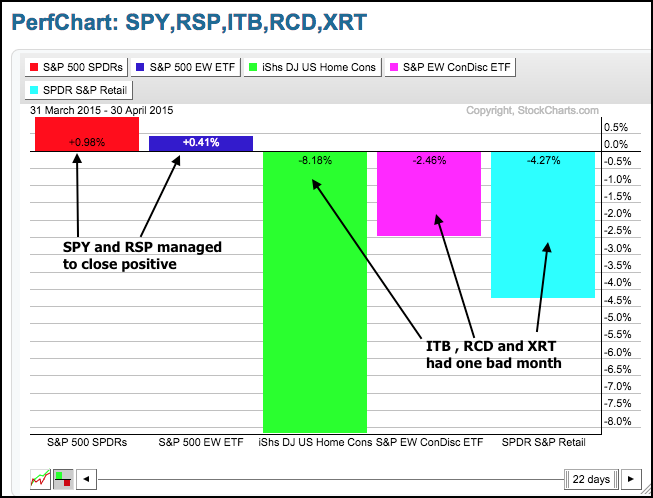
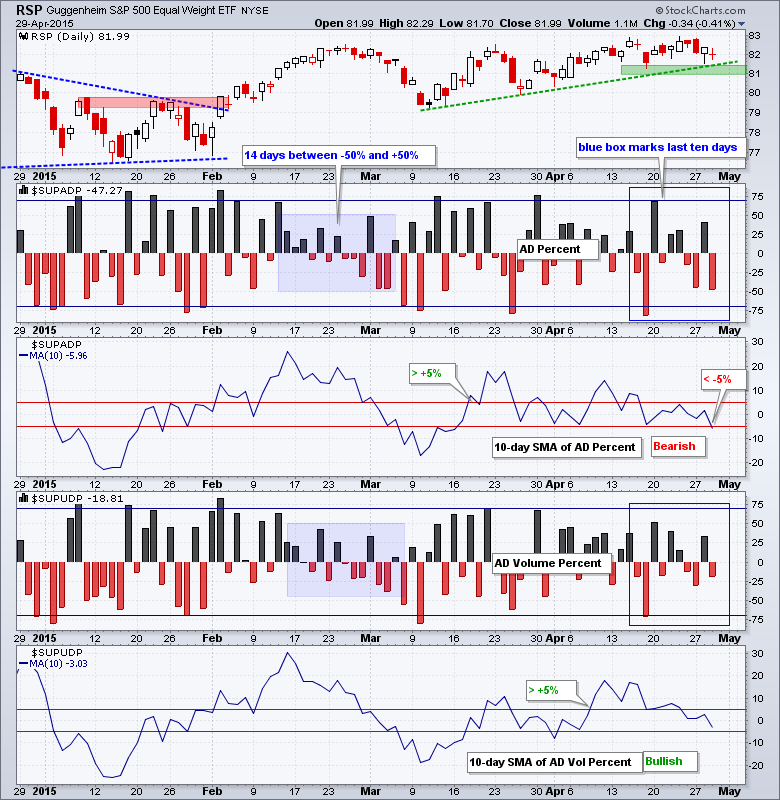
Three Key Groups Lagging in April
by Arthur Hill,
Chief Technical Strategist, TrendInvestorPro.com
The S&P 500 remains in an uptrend and hit a new high on Monday, but some key groups are showing signs of selling pressure in April. The PerfChart below shows month-to-date performance for the S&P 500 SPDR (SPY), the Equal-Weight S&P 500 ETF (RSP)...
READ MORE
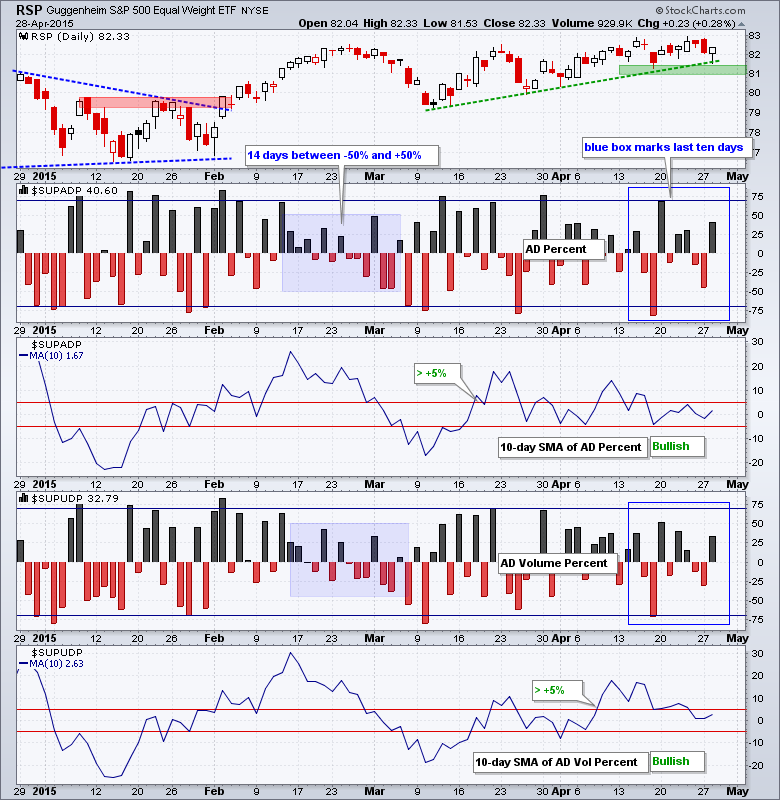
MEMBERS ONLY
Short-Term Trend Analysis 30-Apr-15
by Arthur Hill,
Chief Technical Strategist, TrendInvestorPro.com
Stocks were hit with selling pressure on Wednesday with small-caps leading the way. IWM and IJR lost around 1.1% on the day and have been underperforming since early April. Eight of the nine sectors were down with consumer discretionary, consumer staples and healthcare leading lower. The Equal-Weight Consumer Discretionary...
READ MORE
MEMBERS ONLY
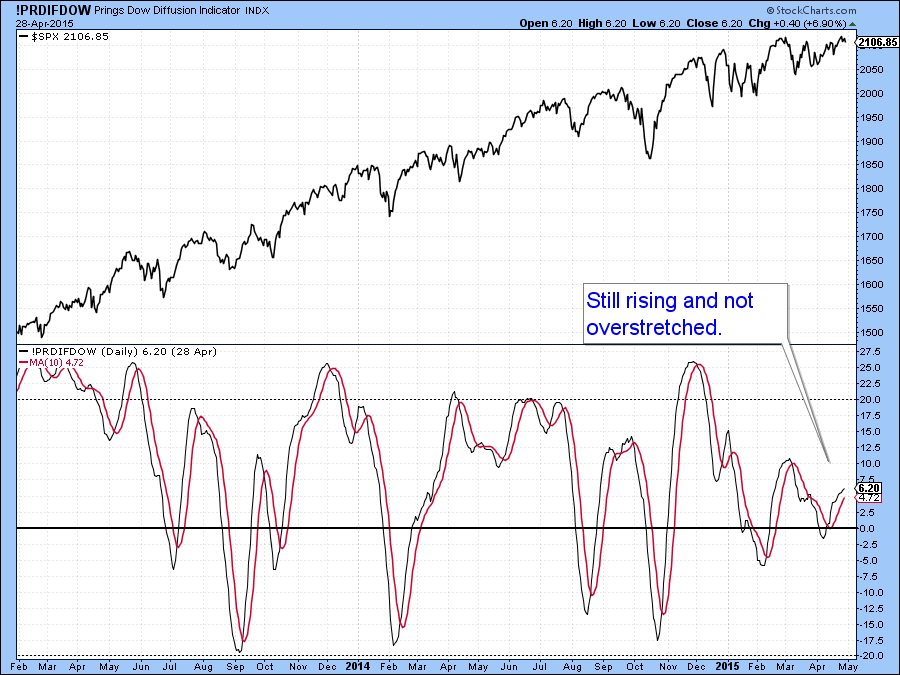
With Recent Breakouts Lacking Strong Conviction, "Sell in May?" Could Be A Legitimate Question

by Martin Pring,
President, Pring Research
* Global equities starting to get overbought.
* Dollar Index and related relationships break to new correction lows.
* Commodities tentatively break to the upside.
US Equities
From now until next Tuesday the market will be under the spell of the bullish end of the month seasonal. That condition, combined with the fact...
READ MORE
MEMBERS ONLY
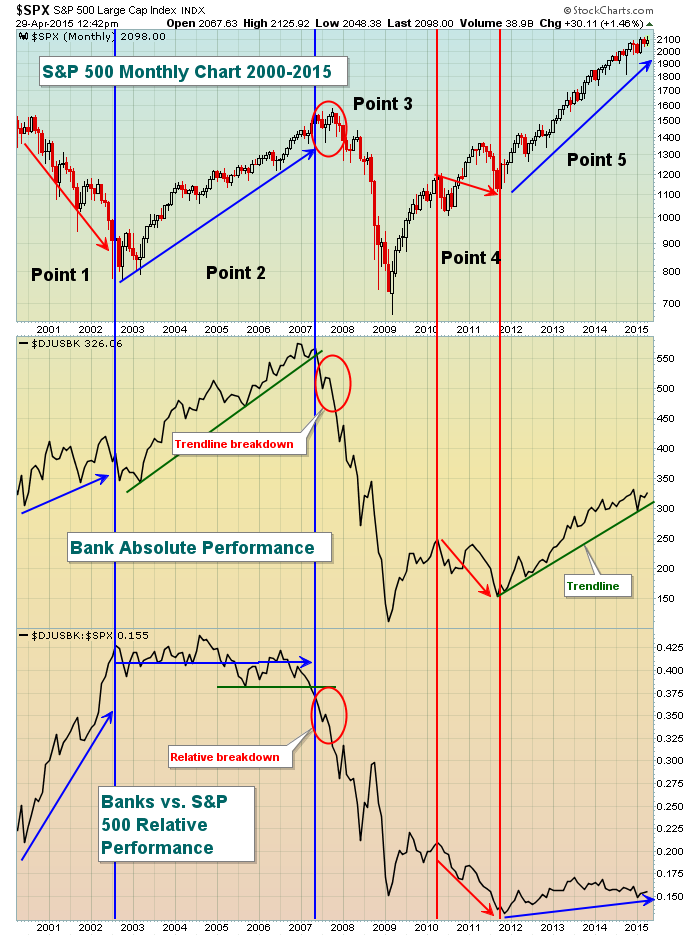
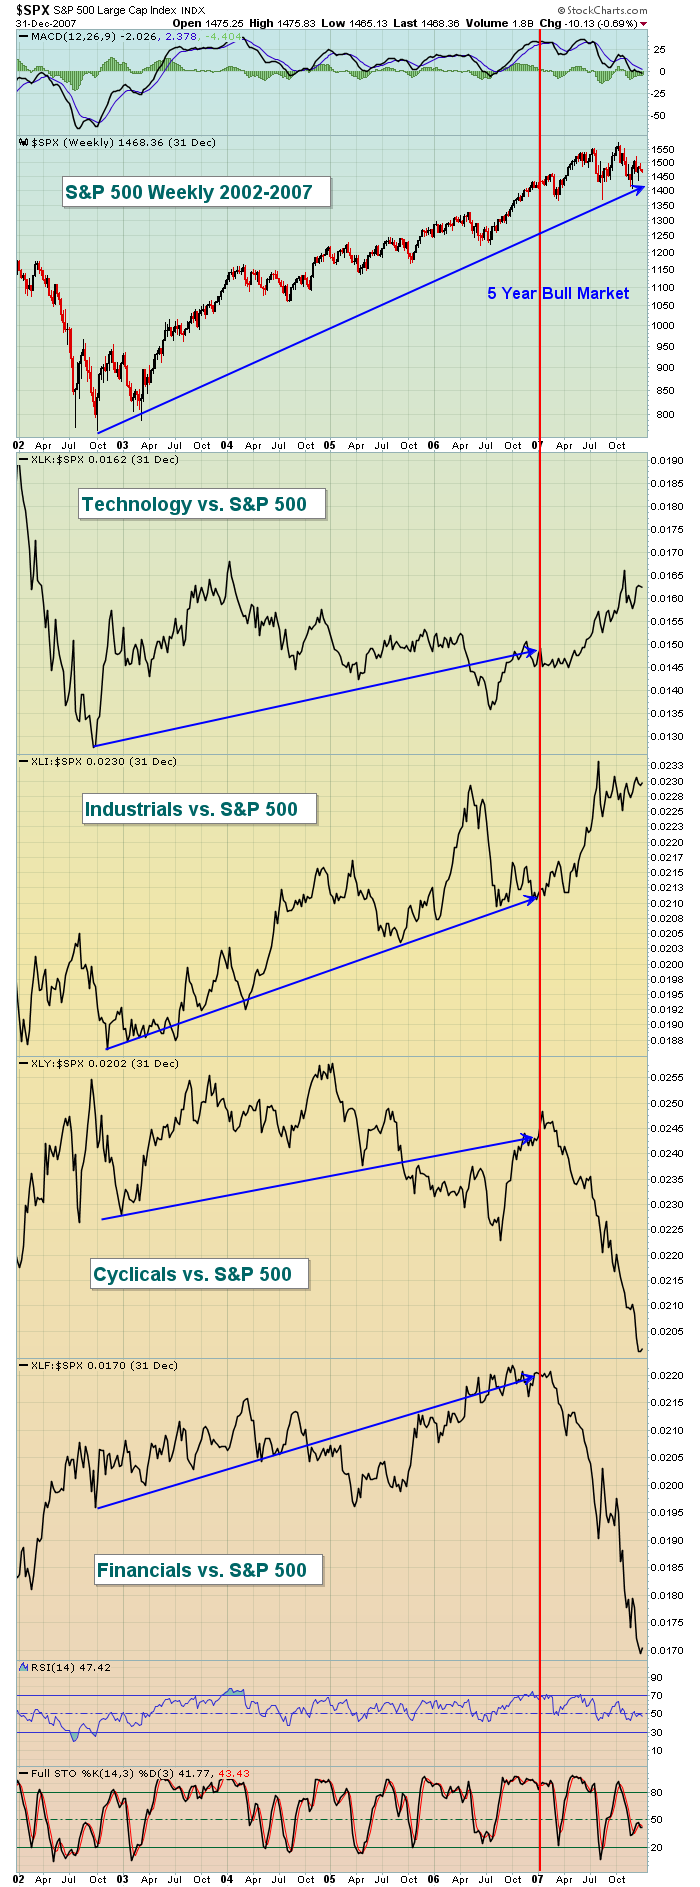
How Do Stock Market Tops Form? Part 4
by Tom Bowley,
Chief Market Strategist, EarningsBeats.com
I've discussed price action (duh!), the relative performance of aggressive sectors and defensive sectors vs. the benchmark S&P 500 and the relationship between consumer discretionary (cyclical) stocks and its consumer staples counterparts in prior articles and how they impact the future behavior of stock prices. This...
READ MORE
MEMBERS ONLY

JUMP IN GERMAN BUND YIELD HELPS BOOST TREASURY BOND YIELDS -- THAT'S GOOD FOR BANK AND INSURANCE STOCKS WHICH ARE TRADING HIGHER TODAY -- THE DOLLAR DROP IS PUSHING COMMODITY PRICES HIGHER
by John Murphy,
Chief Technical Analyst, StockCharts.com
GERMAN BUND YIELDS ARE RISING AS MANAGERS SELL... Something unusual is happening in Europe. For the first time in awhile, money managers are selling eurozone sovereign bonds which is pushing their yields higher. The best example is Germany. Chart 1 shows the 10-Year German Treasury yield jumping to 0.28%...
READ MORE
MEMBERS ONLY
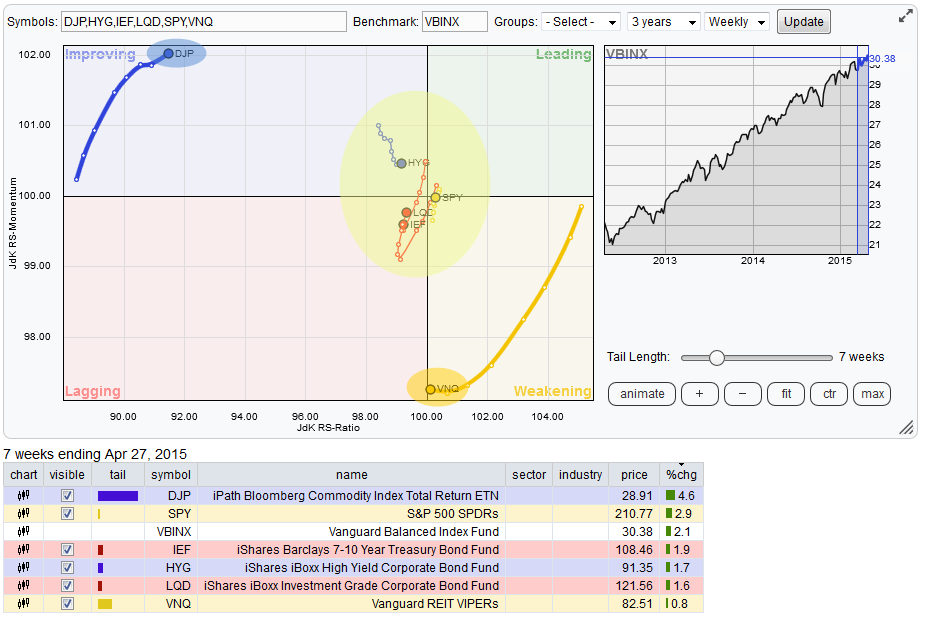
All asset classes starting to hug the benchmark

by Julius de Kempenaer,
Senior Technical Analyst, StockCharts.com
The Relative Rotation Graph below shows the rotation of various asset classes (ETFs) around a balanced portfolio as represented by VBINX (Vanguard Balanced Index Fund).
While reading this RRG the two asset classes that remain on the outskirts of the plot are commodities (DJP) and Real Estate (VNQ). All other...
READ MORE
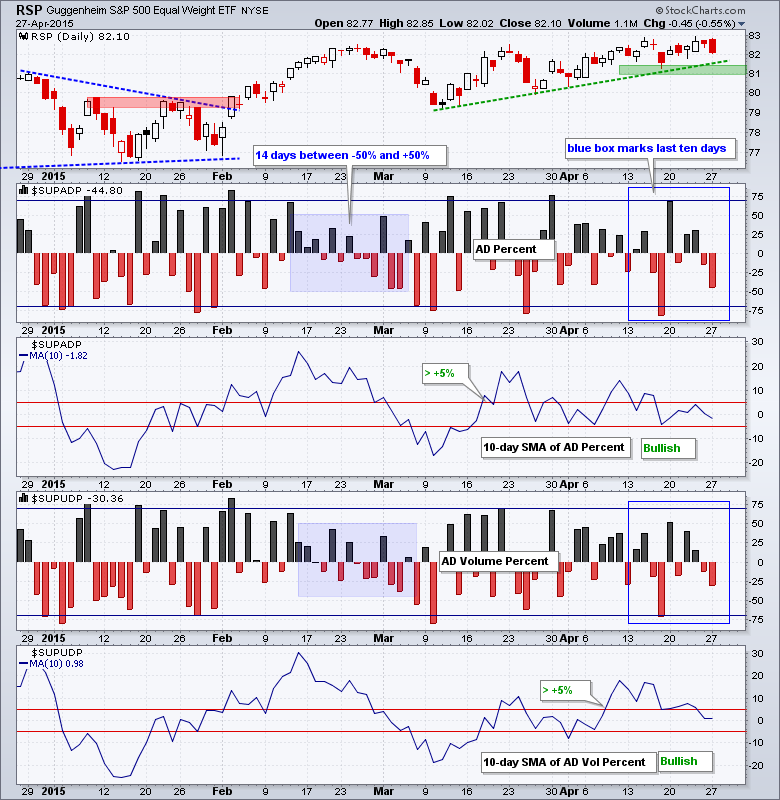
MEMBERS ONLY
Short-Term Trend Analysis 29-Apr-15
by Arthur Hill,
Chief Technical Strategist, TrendInvestorPro.com
It was pop and drop on Monday, and then drop and pop on Tuesday. Welcome to the week featuring the Fed policy statement on Wednesday and the employment report on Friday. Trading could remain choppy the next few days as these events become reality. Stocks were mostly higher on Tuesday...
READ MORE
MEMBERS ONLY
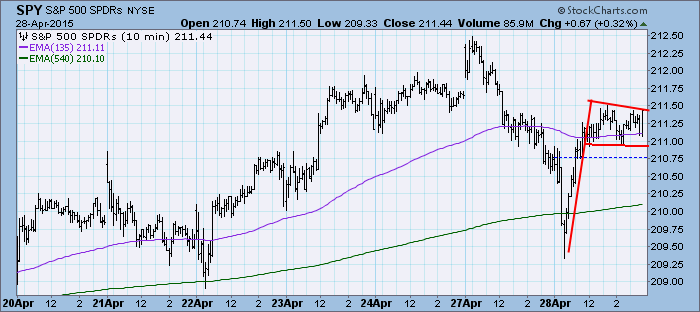
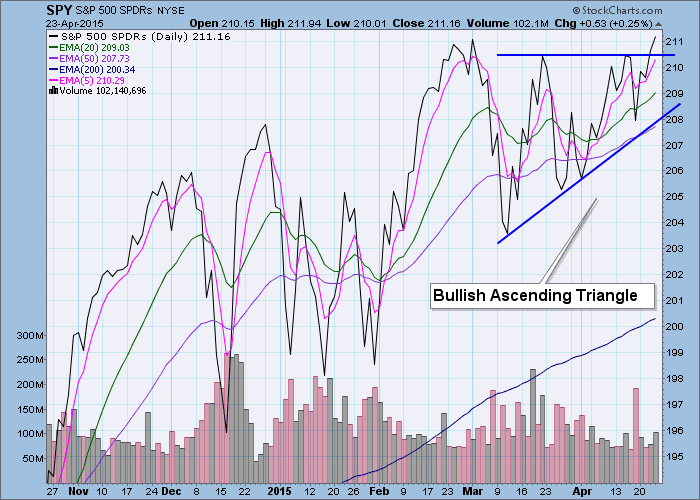
DP Market Update: Tiny Breakout from Bullish Ascending Triangle - April 28, 2015
by Erin Swenlin,
Vice President, DecisionPoint.com
It was a volatile morning but price consolidated in the afternoon, resting as investors contemplate upcoming news from the Fed on Wednesday. Yesterday, price disintegrated. It appeared this morning as if the market planned on continuing into a strong correction; however, upon reaching support near Wednesday's low, it...
READ MORE
MEMBERS ONLY

SPY GETS NOISY, IWM ESTABLISHES SUPPORT, T-BONDS AND UTILITIES BRACE FOR BIG WEEK, CHEMICAL STOCKS LIFT MATERIALS SPDR, EW S&P 500 LAGS, SMALL-CAPS AND CONSUMER DISCRETIONARY START UNDERPERFORMING
by John Murphy,
Chief Technical Analyst, StockCharts.com
WEBINAR CHARTS... The charts below represent some of those featured in today's Webinar. The big trends are clearly up for the major index ETFs, but I am seeing some signs of weakness in a few key groups. It is not a major concern right now, however, it is...
READ MORE
MEMBERS ONLY
IWM Lags and Tests Support, GLD Surges
by Arthur Hill,
Chief Technical Strategist, TrendInvestorPro.com
Stocks got the old pop and drop on Monday as the S&P 500 surged to a new high in the morning and then worked its way lower the rest of the day. The index closed with a modest loss of .41%. IWM led the way lower with a...
READ MORE
MEMBERS ONLY
How Do Stock Market Tops Form? Part 3
by Tom Bowley,
Chief Market Strategist, EarningsBeats.com
When evaluating the stock market for a potential top, there's another intermarket relationship that seems to provide us a nice clue. So without further hesitation, let me move on to my third area of the stock market to watch:
3. WHICH GROUP OF CONSUMER STOCKS IS LEADING?
There&...
READ MORE
MEMBERS ONLY

RCD CHALLENGES RESISTANCE, HEALTHCARE IS THE STRONGEST, MRK, GILD AND JNJ LAG, ABBV AND BMY LEAD, BASE METALS ETF CHALLENGES RESISTANCE, XME EXTENDS UPSWING, STEEL ETF BREAKS OUT, GOLD SURGES
by John Murphy,
Chief Technical Analyst, StockCharts.com
EQUAL-WEIGHT CONSUMER DISCRETIONARY CHALLENGES RESISTANCE... Link for today's video. A funny thing happened on the way to new highs last week. The S&P 500 recorded a new high last week, but only one sector SPDR recorded a new high and only one equal-weight sector ETF hit...
READ MORE
MEMBERS ONLY
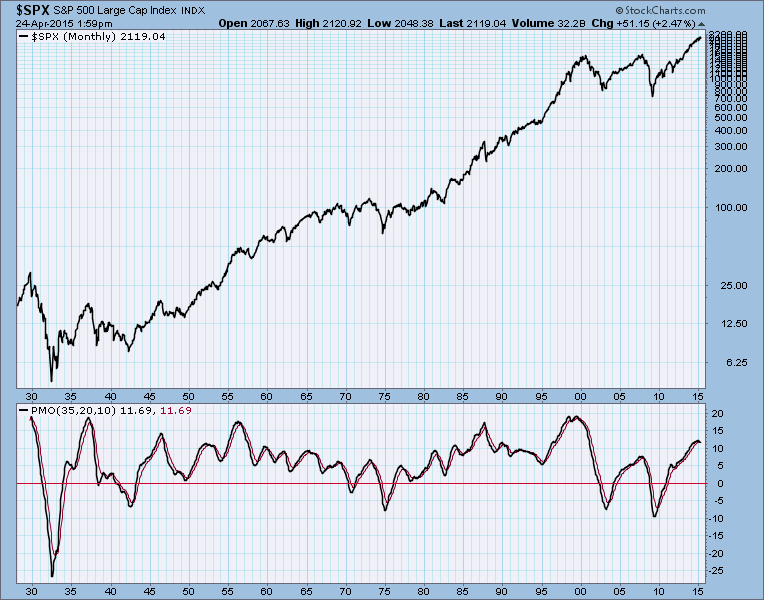
SPY Monthly PMO: Long-Term SELL Signal Lurking

by Carl Swenlin,
President and Founder, DecisionPoint.com
For most of this month we have been watching the monthly PMO (Price Momentum Oscillator) because it topped in December, and in April it crossed below its trigger line, potentially generating a long-term SELL signal. This hasn't happened for over seven years, so it really is kind of...
READ MORE
MEMBERS ONLY
GLD Breaks Down, TLT Tests Break and IWM Lags
by Arthur Hill,
Chief Technical Strategist, TrendInvestorPro.com
It was all about big techs on Friday as QQQ surged over 1%. The rest of the market was mixed as IWM edged lower and SPY edged higher. Strength in Amazon (+14%) lifted the Consumer Discretionary SPDR (XLY) and strength in Microsoft (+10.5%) lifted the Technology SPDR (XLK). The...
READ MORE
MEMBERS ONLY

RISING STOCK MARKET IS BAD FOR GOLD -- COPPER LOOKS LIKE A BETTER ALTERNATIVE -- GLOBAL X COPPER MINERS ETF HITS FIVE-MONTH HIGH -- FREEPORT MCMORAN FLATTENS OUT -- SOUTHERN COPPER BREAKS NECKLINE RESISTANCE -- HUDBAY MINERALS ALSO TURNS UP
by John Murphy,
Chief Technical Analyst, StockCharts.com
RISING STOCKS ARE BAD FOR GOLD... During last Saturday's webinar, one of the attendees asked what I thought of gold. I responded that I didn't like gold and haven't liked it for at least two years. The main reason for that view is the...
READ MORE
MEMBERS ONLY

Welcome to "Wyckoff Power Charting with Bruce Fraser"!
Today I am very happy to announce the start of another great new blog on StockCharts.com - "Wyckoff Power Charting with Bruce Fraser."
For those of you that do not know Bruce, he has been teaching graduate level courses on Technical Analysis (and Wyckoff Analysis in particular)...
READ MORE
MEMBERS ONLY

AMAZON AND MICROSOFT POWER QQQ, BROAD INDICES-TECHS-ASIA DOMINATE NEW HIGHS, NEW HIGH-NEW LOW SCAN, RRG SHOWS BIFURCATION IN FINANCE, XLF AND RYF LAG, REGIONAL BANK AND BROKER ETFS CONSOLIDATE NEAR HIGHS, JAPANESE FINANCIALS MAKE A MOVE
by John Murphy,
Chief Technical Analyst, StockCharts.com
QQQ SURGES TO NEW HIGH... Link for today's video. Large-cap techs took charge on Friday and powered the Nasdaq 100 ETF (QQQ) to a new high. The underlying index, Nasdaq 100, is now around 6% from its all time high, which was recorded in March 2000. Chart 1...
READ MORE
MEMBERS ONLY
How Do Stock Market Tops Form? Part 2
by Tom Bowley,
Chief Market Strategist, EarningsBeats.com
On Wednesday, I began a series of blog articles that is designed to evaluate the health of the stock market. In other words, what should we be looking for in determining whether we should leave our retirement and taxable accounts at risk? Wednesday's blog was the first, and...
READ MORE
MEMBERS ONLY

New Potent Organizational Framework Plus 200 Timely Tradeable Insights ChartPack Update Version 7.0

by Gatis Roze,
Author, "Tensile Trading"
“You don’t have to be a genius to be successful. You just need a framework.”
—Michael Dell, Entrepreneur and Investor
For those of you who regularly download the free quarterly ChartPack updates, I don’t need to explain the value of its framework and contents. But there are still...
READ MORE
MEMBERS ONLY
SPY and QQQ Hit New Highs - IWM Lags
by Arthur Hill,
Chief Technical Strategist, TrendInvestorPro.com
Stocks put in another modest performance with the major index ETFs gaining less than a half percent. Well, the S&P SmallCap iShares (IJR) did gain .60% to lead, but this was the exception. The sectors were mostly higher with energy and technology leading the way. The Home Construction...
READ MORE
MEMBERS ONLY
What's the Difference Between an Ascending Wedge and an Ascending Triangle?
by Erin Swenlin,
Vice President, DecisionPoint.com
I recently received a question from one of the attendees of yesterday's webinar (recording available here). I was reviewing the charts in our DP Chart Gallery as well as symbol requests and often referred to ascending triangle patterns and ascending wedge patterns. Here is the question:
"Erin....
READ MORE
MEMBERS ONLY

SOUTH KOREA RALLIES AS TAIWAN ETF EXPLODES TO RECORD HIGH -- EFA AND EEM HIT NEW RECOVERY HIGHS -- BOUNCING COMMODITIES AND A WEAKER DOLLAR ARE BOOSTING CANADA ISHARES -- NYSE INDEX HITS NEW RECORD -- NASDAQ TRADES ABOVE ITS MARCH 2000 CLOSING HIGH
by John Murphy,
Chief Technical Analyst, StockCharts.com
SOUTH KOREA RISES -- TAIWAN ETF HITS NEW HIGH... China and Japan aren't the only Asian countries that are hitting new highs. Two of today's strongest performers are South Korea and Taiwan. Chart 1 shows South Korea iShares (EWY) climbing nearly 2% to the highest level...
READ MORE
MEMBERS ONLY
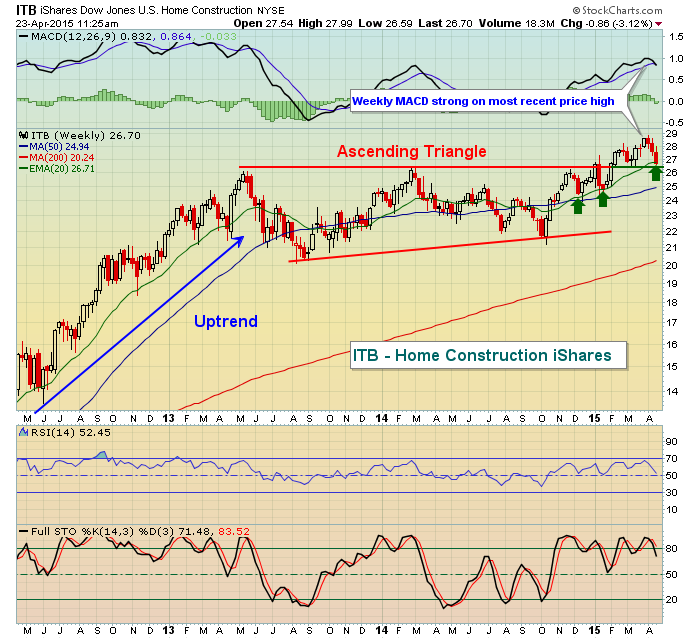
Home Construction iShares (ITB) Hit Critical Support
by Tom Bowley,
Chief Market Strategist, EarningsBeats.com
At 10am EST this morning, March new home sales were released and they fell well short of expectations. Is that a long-term problem for home construction ($DJUSHB) or is it an opportunity for traders to move into this area of the market at lower prices? Well, you'll have...
READ MORE
MEMBERS ONLY
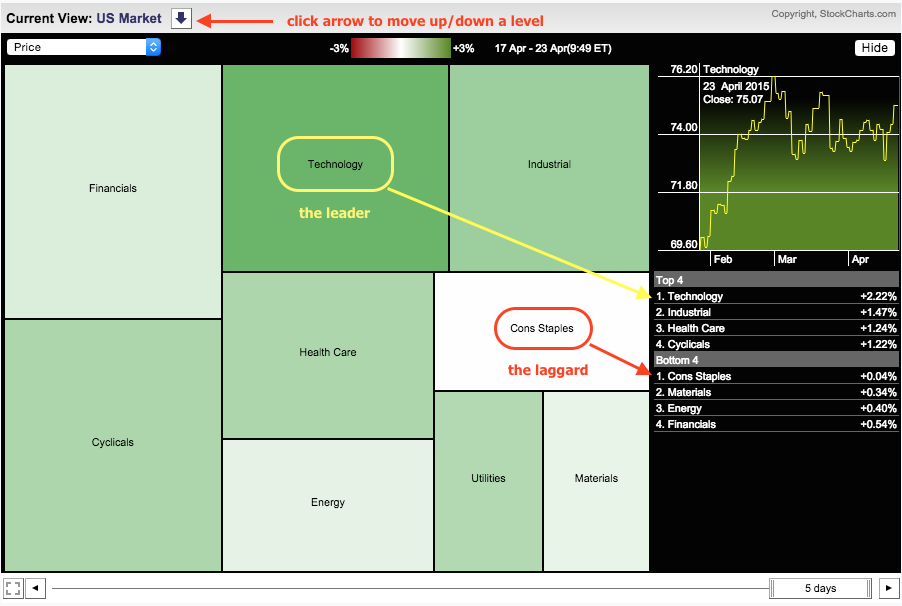
Techs Lead and Staples Lag on Market Carpet
by Arthur Hill,
Chief Technical Strategist, TrendInvestorPro.com
The image below shows the Sector MarketCarpet at "sector" level, which means we are seeing solid boxes for each of the nine sectors. There is a table on the left that ranks sector performance and this MarketCarpet shows performance for the current week (so far). The technology sector...
READ MORE
MEMBERS ONLY

News is Noise
by Greg Morris,
Veteran Technical Analyst, Investor, and Author
We have Breaking News; but first, we’ll be right back after this message from our sponsor. Do you find that irritating? Baiting you with the ubiquitous breaking news anticipation, then launching into a commercial of someone selling gold because the world is coming to an end? Also, isn’t...
READ MORE
MEMBERS ONLY
SPY Hits Range Resistance, TLT and GLD Break Down
by Arthur Hill,
Chief Technical Strategist, TrendInvestorPro.com
Stocks dipped on the open, but quickly caught a bid and moved higher for most of the day. The final gains, however, were modest as QQQ, IWM, SPY and DIA gained around a half percent. The Finance SPDR and the Technology SPDR led the way higher. The consumer discretionary sector...
READ MORE
MEMBERS ONLY

CSX AND RAILS LEAD TRANSPORTS HIGHER -- DOW ENDS BACK OVER 50-DAY AVERAGE -- NASDAQ 100 NEARS TEST OF HIGH AND LEADS MARKET HIGHER -- BROADCOM LEADS TECHNOLOGY AND SEMICONDUCTOR ETFS HIGHER -- S&P 500 IS AGAIN TESTING TOP OF SYMMETRICAL TRIANGLE
by John Murphy,
Chief Technical Analyst, StockCharts.com
DOW TRANSPORTS HIT NEW MONTHLY HIGH... The chart picture for the Dow Transports continues to improve. I recently showed the transports finding support at their 200-day moving average and chart support along first quarter lows. Chart 1 shows the TRAN rising today to the highest level in a month. It&...
READ MORE
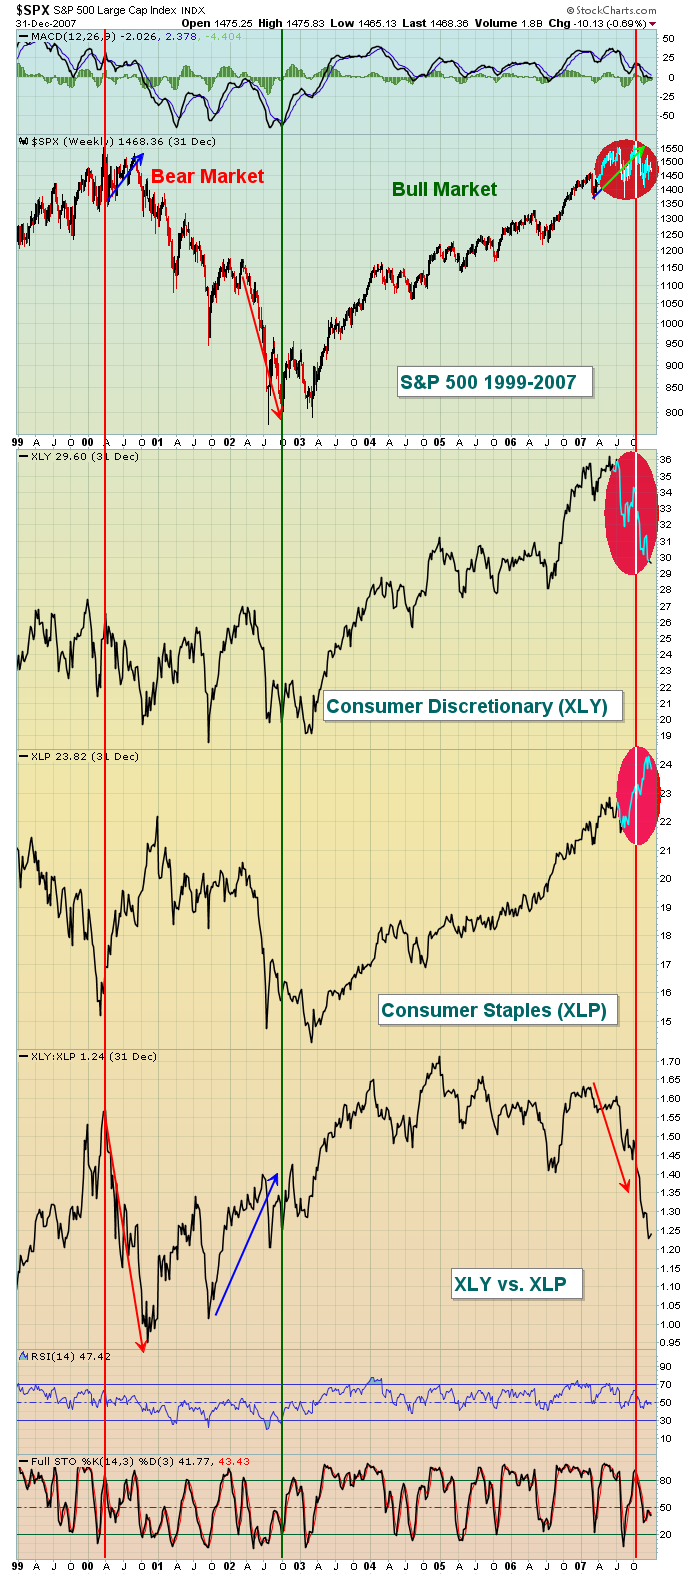
MEMBERS ONLY
How Do Stock Market Tops Form? Part 1
by Tom Bowley,
Chief Market Strategist, EarningsBeats.com
Wow, this is a loaded question and it will take a few articles to try to address it. For every bear market, we seem to have a different reason. Since the turn of the century, we've seen two significant bear markets - one that gripped the market from...
READ MORE
MEMBERS ONLY
QQQ Holds Gap and Starts to Lead
by Arthur Hill,
Chief Technical Strategist, TrendInvestorPro.com
Stocks drifted on Tuesday with a slight downward bias as IWM and SPY closed fractionally lower. QQQ bucked the selling pressure with a modest gain. The sectors were mixed. The healthcare sector led the gainers, while the energy sector led the losers. The consumer discretionary sector finished with a small...
READ MORE
MEMBERS ONLY
DP Market Update: Trend Model BUY Signal on USO - April 21, 2015
by Erin Swenlin,
Vice President, DecisionPoint.com
The market has been in a continuation pattern as price consolidates. Of possible interest is the ultra-short-term declining trend channel, I'm curious how it will resolve.
The purpose of the DecisionPoint Daily Update is to quickly review the day's action, internal condition, and Trend Model status...
READ MORE
MEMBERS ONLY
Strong relative rotation for GE, JPM and GS
by Julius de Kempenaer,
Senior Technical Analyst, StockCharts.com
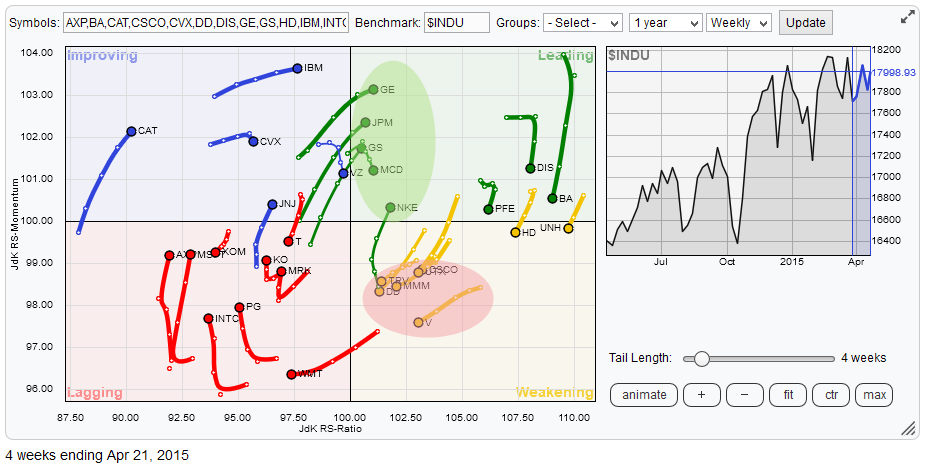
It is time for a look at the relative rotation of the Dow 30 industrial stocks again. The Relative Rotation Graph below shows the 30 stocks that make up this index.
When I look at that RRG there are two things that immediately catch my eye.
The first thing is...
READ MORE
MEMBERS ONLY
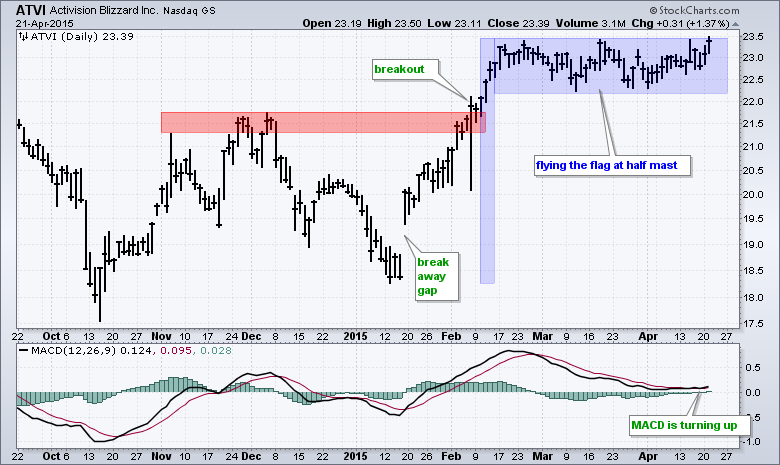
Activision Flies the Flag at Half-Mast
by Arthur Hill,
Chief Technical Strategist, TrendInvestorPro.com
Activision Blizzard (ATVI) sports a bullish continuation pattern and improving momentum. The stock gapped up in mid January and broke out in early February. ATVI was overbought after a 25% surge and worked off these overbought conditions with an extended flag. I say extended because eight weeks is getting long...
READ MORE
MEMBERS ONLY

HIGH-LOW PERCENT SIGNALS, AD LINE CONFIRMATION, TREND MOVEMENTS, FINANCE SECTOR WEAKENS, MATERIALS SECTOR WOBBLES, TWO LEADING HEALTHCARE GROUPS, WATCH SWINGS IN OIL AND XLE, 10-YR YIELD LACKS CATALYST, UTILITIES WEAKEN
by John Murphy,
Chief Technical Analyst, StockCharts.com
WEBINAR CHARTS... Below are some of the charts highlighted in today's Webinar. There was also a tutorial on Bollinger Bands using Apple as the example. Lots of stocks and ETFs show narrowing ranges and this is a great time to brush up on a classic indicator. I also...
READ MORE
MEMBERS ONLY
SPY Gaps Back Up, TLT and GLD Stall
by Arthur Hill,
Chief Technical Strategist, TrendInvestorPro.com
Stocks surged on Monday and recovered most of Friday's losses. The S&P 500 moved back above 2100 in the first hour (+1%) and then consolidated the rest of the day. The consumer discretionary, technology, industrials and utilities sectors led with 1+ percent gains. Internet, software, semiconductor...
READ MORE
MEMBERS ONLY
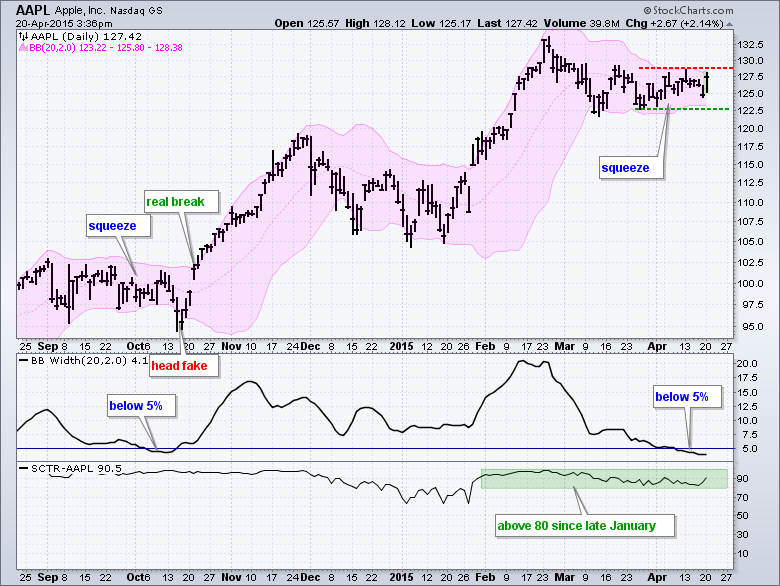
Apple Gets a Volatility Squeeze
by Arthur Hill,
Chief Technical Strategist, TrendInvestorPro.com
Trading in Apple has turned dull over the last six weeks as the stock moves in a tightening consolidation. The volatility contraction can be seen by the Bollinger Bands, which contracted to their narrowest since October. Notice that BandWidth moved below 5%. Also notice that the October squeeze featured a...
READ MORE
